Short communication
Assessing bias from boles in calculating leaf area index in immature
Douglas-fir with the LI-COR canopy analyzer
H.J. Barclay
∗, J.A. Trofymow, R.I. Leach
Pacific Forestry Centre, 506 West Burnside Road, Victoria, BC, Canada, V8Z 1M5
Received 26 April 1999; accepted 3 September 1999
Abstract
Measurements of leaf area index (LAI) taken with photometers such as the LAI2000 are biased by boles and branches which stop part of the light from reaching the photometer. We estimated how much of the sky would be obscurred by boles in an immature stand of Douglas-fir (Pseudotsuga menziesii (Mirb) Franco) that was stem-mapped and of known diameter, height and height-to-live-crown. These yielded gap fractions which were then converted to bole area index (BAI) via the algorithm used by the LAI2000. The mean BAI, as a fraction of the effective leaf area index (LAIe) calculated by the LAI2000, ranged from<0.01 for Douglas-fir at 24 years of age to about 0.1 at 48 years. Comparing readings on Douglas-fir trees defoliated by root rot with readings on fully foliated trees yielded a proportion of 0.41, which included branches. Measurements were also taken on clumps of maple (Acer macrophyllum Pursh) and alder (Alnus rubra Bong.) both before and after leaf-fall, yielding corresponding proportions, including branches, of 0.41 and 0.25, respectively. The values obtained this way are probably upper limits. The contributions of boles may be appreciable, particularly in mature unthinnned stands with closed canopies. ©2000 Elsevier Science B.V. All rights reserved.
Keywords: Leaf area index; LAI-2000; Douglas-fir
1. Introduction
Leaf area index (LAI- one half total leaf area per unit ground surface area (m2/m2)) can be assessed in-directly with the LI-COR LAI-2000 Plant Canopy An-alyzer (Deblonde and Penner, 1994). However, these estimates are biased by blockage of light by boles and branches and, in conifer stands, also by non-random distribution of foliage elements. The output of the LAI-2000 analyzer is thus an effective leaf area index
∗Corresponding author. Tel.:+1-250-363-0736;
fax:+1-250-363-0775.
E-mail address: [email protected] (H.J. Barclay).
(LAIe) rather than a LAI (Chen and Black, 1992). It would thus, be useful to quantify the contributions of the woody parts to the calculation of LAIe.
LAIe is related to LAI according to the equation (Chen, 1996)
whereα is the ratio of woody surface area to total surface area;γE is the shoot clumping factor; E is the clumping index quantifying the effect of foliage clumping at larger scales than the shoot, andγE/E is the total stand clumping index () and equals unity when foliage distribution is random.
2. Methods
2.1. Study site
The BAI estimations were all done using trees from the Shawnigan study site (Barclay et al., 1982). That experiment involved three levels of both fertilization and thinning, done when the trees were 24 years old. These trees were all stem mapped to the nearest 30 cm, and dbh (cm), H (m), and Hlc (m) were recorded for each tree in each plot every 3 years for 12 years starting in 1971. Plots were 20 m by 20 m with a 15 m treated buffer strip surrounding them. Data were available for tree ages 24, 27, 30, 33, 36, 39, 42 and 48 years. Data from 36 plots were analyzed, 12 from each treatment T0 (unthinned), T1 (thinned to 2/3 basal area), and T2 (thinned to 1/3 basal area).
2.2. Calculation of bole area
Polar projections of the silhouette areas of the boles of the Shawnigan trees were used to calculate gap fractions (1–stem area projected against the sky/total sky area) for each of the 15◦ annular zenith ranges
used by the LAI-2000 analyzer (LI-COR, 1992). These gap fractions were input to the algorithm used by the analyzer, producing BAI values analogous to the LAIe values.
LAI is approximated (Welles and Norman, 1991) as the sum:
be aligned vertically with no foliage from other trees impeding visibility; thus this treatment would tend to overestimate the BAI visible from the ground. All the plot trees were used and mean gap fraction and BAI values were generated using each of the two bole shapes.
To ensure lack of edge effects in a plot, for each plot the trees were replicated 25 times yielding 25 identical plots which were then concatenated providing a 5 plot by 5 plot matrix (100 m by 100 m), allowing analysis of projected bole area of stems within a 40 m radius of any point within the central plot. This is similar to the situation in the actual plot with the 15 m treated buffer.
Sample reference points were chosen at random within the central plot, but at least 1 m from any stem, and each reference point yielded one estimate of BAI. All the trees within a 40 m radius of a ref-erence point were included and data calculated for the reference point included distance to each stem, azimuth angles to the two edges of the stem, and zenith angle to the stem’s Hlc. The resolution was 0.1◦.
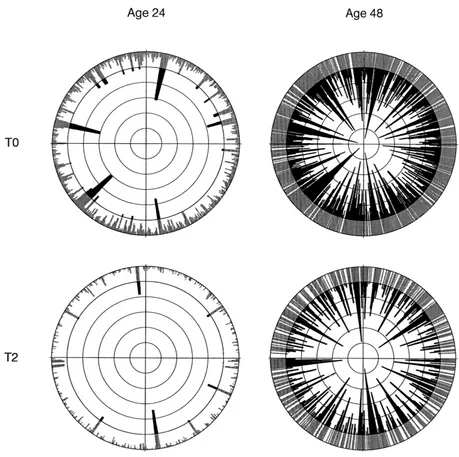
Fig. 1. Hemispherical view of a control plot (T0) and a heavily thinned and fertilized plot (T2) at age 24 years and again at 48 years, from a random reference point within each plot. The trees are shown as cylinders using a polar projection onto the hemisphere. The zenith is at the centre.
2.3. Estimation of effective leaf area index using the LA 12000
Measurements using the LAI2000 were taken in eight plots representing the four extreme treatments at Shawnigan, namely T0F0 (no thinning or
clump of standing Douglas-fir trees that had been killed by root rot and (ii) inside an adjacent stand of foliated live Douglas-fir trees less than ten m dis-tant; (b) under a clump of maple (Acer macrophyllum Pursh) trees both in October before leaf-fall and again in January after leaf-fall; (c) under a clump of alder (Alnus rubra Bong.) trees both in October before leaf-fall and again in January after leaf-fall. Due to an adjacent stand of foliated Douglas-fir, only the inner three rings of the LAI2000 were used in the LAIe calculations for the Douglas-fir and alder trees, whereas all the five rings were used for the maple trees.
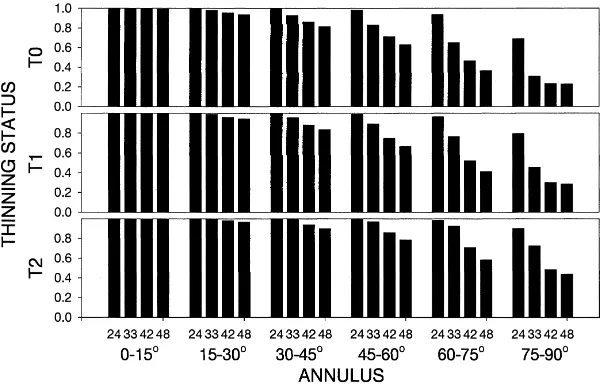
Fig. 2. Variation in gap fractions with thinning status, zenith angle of the annulus and age at measurement. T0 is unthinned, T1 had 1/3 of the basal area removed, and T2 had 2/3 of the basal area removed in 1971.
proportions of sky covered are small.
3. Results and discussion
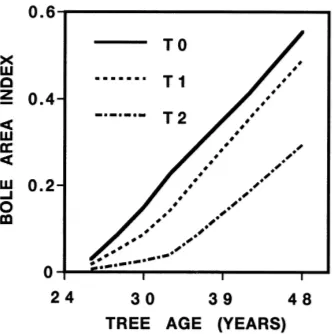
Fig. 3. Calculated Bole Area Index (BAI) to Hlc by thinning status for 24, 27, 30, 33, 36, 39, 42 and 48 years of age. T0–unthinned; T1–one third of basal area thinned out; T2–two thirds of basal area thinned out.
of 0.675. BAI increased with stand age and density (Fig. 3). The gap fractions, BAI, LAIe and BAI as a fraction of LAIe are shown in Table 1.
Taken singly, regressions showed that basal area had the strongest effect on BAI and gap fractions, fol-lowed by Hlc, age, H, QMD, mean dbh and stand den-sity (Table 2), and the first three had an r2of greater than 0.75. Addition of a second predictor to the model improved fit significantly; seven of the better pairwise combinations are shown in Table 2, with all yielding an r2 of greater than 0.9. Although it had a strong
Table 2
Regressions of integrated gap fractions versus (i) basal area/ha (Ba/ha), (ii) height to live crown (Hlc) (iii) age (iv) mean height (H) (v) quadratic mean diameter (QMD) (vi) mean dbh, and (vii) stand density. The seven single predictors are shown in the upper section and seven pairwise regressions in the lower section
Intercept Ba/ha Hlc Age H QMD Dbh Density R2
1.15 −0.01 0.95
Proportion of sky not covered by boles (Gap fractions (GF)); BAI, LAIe and the proportion (Prop) that BAI is of LAIe, by thinning status at ages 24, 33 and 48 years
Thin age T0 T2
24 33 48 24 33 48
GF 0.96 0.78 0.58 0.99 0.96 0.73
BAI 0.03 0.23 0.55 0.01 0.04 0.29
LAIe 4.83 6.61 5.70 1.66 5.50 5.48 Prop <0.01 0.04 0.10 <0.01 <0.01 0.05
effect, only one regression incorporating Hlc is shown, as it is seldom measured by foresters. Addition of fur-ther predictors did not significantly improve model fit. The best pairwise combination was age and mean dbh (r2=0.98) followed by Ba/ha and Hlc, (r2=0.97).
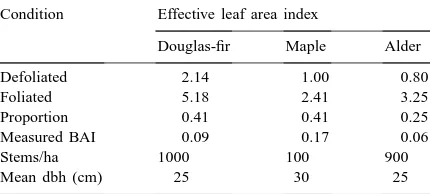
Comparison of the LAIe of foliated with defoliated trees yielded identical fractions (0.41) for Douglas-fir and maple and 0.25 for alder (Table 3). This com-parison includes both boles and branches in the de-foliated trees. However, because the deciduous trees were in relatively small clumps, the boles further away from the measurement point that would otherwise tribute to sky coverage were not present and the con-tribution of the boles was smaller than it would have been in a larger stand, partially offsetting the effect of including branches.
Measured BAI 0.09 0.17 0.06
Stems/ha 1000 100 900
Mean dbh (cm) 25 30 25
via Eq. (2)) and as such are fairly accurate. However, the proportions that BAI were of LAIe (Tables 1 and 3) should be taken as approximate, rather than quan-titatively accurate because many boles will obscure foliage on other trees, so that removing a bole may not result in a view of clear sky, and so the calculated bias is often an overestimate. The values of BAI in Table 3 are thus probably upper limits. In addition, because of the nonlinearity of Eq. (2) the values out-put by the LAI2000 are unlikely to be strictly additive
effects on a Douglas-fir ecosystem at Shawnigan Lake: 9 year growth response. Can. For. Serv., Pac. For. Res. Cent. Inf. Rep. BC-X 238, Victoria, BC.
Chen, J.M., 1996. Optically based methods for measuring seasonal variation in leaf area index in boreal conifer stands. Agric. Forest Meteorol. 80, 135–163.
Chen, J.M., Black, T.A., 1992. Defining leaf area index for non-flat leaves. Plant Cell and Environ. 15, 421–429.
Deblonde, G., Penner, M., 1994. Measuring leaf area index with the LI-COR LAI-2000 in pine stands. Ecology 75, 1507–1511. Kucharik, C.J., Norman, J.M., Gower, S.T., 1998. Measurements of branch area and adjusting leaf area index indirect measurements. Agric. Forest Meteorol. 91, 69–88.
LI-COR, 1992. LAI-2000 Plant Canopy Analyser Instruction Manual. LI-COR, P.O. Box 4425, Lincoln, NE, USA. Welles, J., Norman, J., 1991. Instrument for indirect measurement