The influence of land-use change on the organic carbon distribution and microbial
respiration in a volcanic soil of the Chilean Patagonia
Francis Dube
a,*, Erick Zagal
b,c, Neal Stolpe
b,c, Miguel Espinosa
a aFaculty of Forest Sciences, University of Concepcio´n, Victoria 631, Casilla 160-C, ChilebDepartment of Soils and Natural Resources, Faculty of Agronomy, University of Concepcio´n, Vicente Me´ndez 595, Casilla 537, Chillan, Chile cInvestigators Associated to the Center for Ecological Investigations of Patagonia (CIEP), Chile
1. Introduction
During the 1990s, terrestrial ecosystems captured approxi-mately 36% of the total carbon liberated to the atmosphere by combustion of fossil fuels (IPCC, 2001). Consequently, there is a growing interest to study the potential for carbon sequestration in agro-ecosystems worldwide, including remote regions such as the Patagonia, Chile where large areas of degraded pastures and eroded soils are found, where the ranchers face increasing pressures to maintain the productivity of their land. The Ayse´n Region, located in the heart of Patagonia between Latitude S. 448 and 498, covers an area of 110,000 km2, and the main forest types are evergreen (2.2 million ha),Nothofagus pumilio(1.4 million ha),
Nothofagus dombeyi(0.6 million ha) andPilgerodendron uviferum
(0.5 million ha) (SAG, 1999).
The native forest that originally covered most of the Ayse´n Region has been reduced to 45% of the total because of fires that were used to ‘‘open fields’’ to cattle, leaving the valley slopes exposed to an inexorable erosion and degradation of the soils that formed in volcanic ash deposits. Overgrazing has also contributed to degradation of forests that are adjacent to the pastures (Gobierno Regional de Ayse´n, 2002). Deforested areas with steep slopes suffer extreme erosive processes, which has complicated reforestation efforts. The forest plantations that have been established on degraded soils cover approximately 30,000 ha and consist of exotic species, mostlyPinus ponderosa,Pinus contorta
andPseudotsuga menziesii.
Non-sustainable use of volcanic soils can notably diminish the content of organic matter, which can be reverted by sustainable management that can improve the soil’s physical and chemical
A R T I C L E I N F O
Article history:
Received 31 August 2008
Received in revised form 19 January 2009 Accepted 19 January 2009
Keywords:
Andisols
Carbon sequestration Soil aggregates Soil microbial respiration
A B S T R A C T
Land-use changes can modify soil carbon contents. Depending on the rate of soil organic matter (SOM) formation and decomposition, soil-vegetation systems can be a source or sink of CO2. The objective of this study was to determine the influence of land-use change on SOM distribution, and microbial biomass and respiration in an Andisol of the Chilean Patagonia. Treatments consisted of degraded natural prairie (DNP), thinned and prunedPinus ponderosaplantations (PPP), and unmanaged second-growth Nothofagus pumilio forest (NPF). The soil was classified as medial, amorphic, mesic Typic Hapludands. Soil microbial respiration and microbial biomass were determined in the laboratory from soil samples taken at 0–5, 5–10, 10–20 and 20–40 cm depths obtained from three pits excavated in each treatment. Physical fractionation of SOM was performed in soil of the upper 40 cm of each treatment to obtain the three following aggregate-size classes: macroaggregates (>212mm), mesoaggregates (212– 53mm) and microaggregates (<53mm). Plant C content was 68% higher in PPP than in DNP and 635% higher in NPF than in PPP. Total soil and vegetation C content in both DNP and PPP were less than half of that in NPF. Total SOC at 0–10 cm depth decreased in the order DNP (7.82%)>NPF (6.16%)>PPP (4.41%), showing that land-use practices affected significantly (P<0.01) SOC stocks. In all treatments, microbial biomass C and respiration were significantly higher (P<0.05) in the upper 5 cm. Soil microbial respiration was also correlated positively with microbial biomass C and SOC. The different land uses affect the formation of organic matter, SOC and microbial biomass C, which in turn will affect soil microbial respiration. Conversion of DNP to PPP resulted in a 44% decrease of SOC stocks in 0–10 cm mineral soil. The largest amount of SOC was stabilized within the mesoaggregate fraction of the less disturbed system, NPF, followed by PPP. In the long term, formation of stable mesoaggregates in soils protected from erosion can behave as C sinks.
ß2009 Elsevier B.V. All rights reserved.
* Corresponding author. Tel.: +56 41 2204848; fax: +56 41 2246004.
E-mail address:[email protected](F. Dube).
Contents lists available atScienceDirect
Forest Ecology and Management
j o u r n a l h o m e p a g e : w w w . e l s e v i e r . c o m / l o c a t e / f o r e c o
properties, and increase organic matter content, which is known as ‘‘carbon capture or sequestration’’ in soils (Zagal and Co´rdova, 2003). The influence of land management on the carbon (C) contents in biomass and soils is well documented worldwide (Peichl et al., 2006; Huygens et al., 2005; Six et al., 2002; Ross et al., 2002, 1999; Post and Kwon, 2000) and soils are known to be the largest terrestrial C reservoir. According toTate (1987), land-use changes can modify soil C contents because of the interactions between residue inputs to soil and the subsequent transformations mediated by soil microorganisms. Depending on the rate of soil organic matter (SOM) formation and decomposition, soil-vegeta-tion systems can be a source or sink of CO2(Six et al., 2002). The understanding of SOM dynamics and its link with previous or current type of vegetation is also helpful to determine whether the ecosystem is sustainable, because land management affects the content and quality of SOM as well as microbial biomass and respiration in soil (Carter, 2002). However, there have been few comparative studies of the influence of land-use changes on organic matter, and microbial biomass and respiration in volcanic soils, especially in the Patagonia. In general, volcanic soils have unique physical and chemical properties compared with other soils. Volcanic soils (Andisols) commonly form in humid temperate climates and are dark in color because of high organic matter content and Al, Fe-humus complexes. Other properties include: low bulk density, fine crumb or granular structure, the presence of amorphous clay (allophane or imogolite) having a pH-dependent charge and high specific surface area, high content of water at 1500 kPa tension, low exchangeable bases, and elevated retention of phosphate (Wada, 1985).
The objective of this study was to determine the influence of land-use change on SOM distribution, and microbial biomass and respiration in an Andisol of the Chilean Patagonia.
2. Materials and methods
2.1. Site description
The site was located in the San Gabriel Agroforestry Unit that was established in 2002 by the Forestry Research Institute (INFOR) and the Agricultural and Cattle Development Institute (INDAP) of the Chilean government. This module is located in the Mano Negra Sector, 30 km north of the city of Coyhaique, on a western exposed slope with 730 m altitude above sea level at Latitude S 458250, Longitude W 728000. Within the module, there are several adjacent experimental land-use management practices (200 m apart), hereafter referred to as treatments: (1) more than 50-year-old degraded prairie with traditional management of cattle grazing – 5 ha (DNP), (2) 16-year-old thinned and prunedP. ponderosaexotic plantations – 5 ha (PPP), and (3) 150-year-old unmanaged second-growthN. pumilioforest – approximately 100 ha (NPF). It is worth mentioning that more than 50 years ago, the entire zone was originally covered with indigenous forest, mostlyN. pumilio, which has been burnt in diverse sectors to ‘‘open fields’’ to cattle-raising activities.
Treatments were imposed in March 2006 in a randomized complete design with three replicates (20-m spaced pits that consisted in one centralized pit at 100 cm depth that also served for the soil description and classification, and two adjacent ones at 40 cm depths). All replicates (or sampling plots) had a slope ranging from 10 to 15%, a uniform aspect and were located at similar elevations. In each sampling site, soil samples were taken at 0–5, 5–10, 10–20 and 20–40 cm depths, and also at 40–60, 60–80 and 80–100 cm depths in the central pit that served for classifying the soil.
In 1991, the pine plantation was established, with an initial density of 2000 stems ha 1and a spacing of 2 m
2.5 m; in 2003 it
was thinned to 800 trees ha 1. In 2006, average height and diameter at breast height (DBH) were 6.3 m and 17.3 cm for the
P. ponderosatrees, and 23.7 m and 32.5 cm for theN. pumiliotrees, respectively. The natural prairie that gradually established itself after the native forest was cleared has traditional cattle-raising activities, with an animal density of 2 cows ha 1. The pastures presently consist of a mixture of perennial gramineas (Dactylis glomerata, Holcus lanatus, Poa pratensis), perennial leguminous plants (Trifolium pratense, T. repens), and other accompanying species. During the growth period of years 2004–2005, the prairie was fertilized with 16 kg N ha 1, 30 kg Mg ha 1and 79 kg S ha 1. In 2005–2006, 24 kg N ha 1, 17 kg Mg ha 1 and 77 kg S 1 were applied.
The climate is temperate with dry summers and cool, humid winters. Mean temperatures fluctuate between 128C and 148C in summer and 28C and 38C in winter (Silva et al., 1999). The annual precipitation varies from 1000 mm to 1500 mm. However, only 15% of the precipitations take place between December and February, coinciding with the windiest and warmest period. The soil is characterized as a well drained, deep and medium acidic, formed from relatively unaltered volcanic ash deposits (Silva et al., 1999). The soil has been classified as medial, amorphic, mesic Typic Hapludands (Soil Survey Staff, 2006).
2.2. Soil analysis
To check soil variability, the soil morphology was described in the central pit of each land-use area and samples were taken at 0– 5, 5–10, 10–20, 20–40, 40–60, 60–80 and 80–100 cm depths (Soil Survey Staff, 1992). Soil samples were air-dried and sieved (2 mm mesh) for later analyses. Soil texture was determined using the hydrometer method (Day, 1965). The total C and N contents were determined by dry combustion (Wright and Bailey, 2001). Soil pH was measured using a 1:1 mixture of soil and water (McLean, 1982). Effective cation exchange capacity (ECEC) was measured using 1 M NH4O2C2H3for extraction of exchangeable cations Ca, Mg, K, and Na, and 1N KCl for determination of exchangeable Al (Thomas, 1982). Available N (NO3–N), P (Olsen) and K (Sadzawka et al., 2006), and % P fixation were also measured in the soils (Soil Survey Staff, 1992).
2.3. Tree and pasture biomass
An inventory of theP. ponderosaplantation and theN. pumilio
forest was performed and consisted of five circular plots of 200 m2 that were randomly established in each treatment, measuring the variables DBH and HT (total height) of all the trees using a diametric tape and clinometer. The measured variables were then used to calculate aboveground and subterranean biomass, using existing biomass functions for the climatic zone, that were specifically developed for pine plantations (Gayoso et al., 2002) and second-growthN. pumilioforest (Loguercio and Defosse´, 2001; Weber, 1999). Partitioning of the aboveground biomass compart-ments was as follows: (1)P. ponderosa, 47% of consisted of stems, 25% of branches and 28% of foliage;N. pumilio, 87% consisted of stems, 12% of branches and 1% of foliage.
We assumed that approximately 50% of the biomass consists of carbon (IPCC, 2001) to calculate the carbon content of the vegetation.
2.4. Soil microbial respiration
Soil microbial respiration was determined in the laboratory from soil samples (three replicates, 0–5, 5–10, 10–20, 20–40 cm depths) obtained from the pits of each treatment. The incubation method was used to measure the CO2 evolved by the microbial biomass (Rowell, 1994). Sieved 25 g moist soil samples were placed in 1-l incubation jars (water-filled pore space (WFPS) = 60%), together with glass essay tubes containing 7.5 ml of NaOH. The same procedure was used for the controls to measure the ambient CO2 concentrations in the jars, but without the presence of soil. The incubation jars were sealed with Parafilm and kept in an incubation chamber at 228C for 3 days, after which the essay tubes were retrieved from the jars, from which 1 ml of NaOH in duplicate was extracted and added to 2 ml of BaCl2in separate essay tubes. The solutions were titrated with HCl (0.1 M), adding first a few drops of phenolphthalein. Evolved CO2was calculated as the difference between controls and samples and expressed per gram of dry soil.
2.5. Microbial biomass C
Soil microbial biomass C was determined through the chloro-form fumigation-extraction method (Vance et al., 1987) and subsequent quantification of ninhydrin-N according toJoergensen and Brookes (1990). Sieved moist soil samples (25 g) (60% WFPS) were placed in desiccators together with a beaker containing 25 ml ethanol-free chloroform for incubation. Sieved moist soil samples were also incubated without fumigation (controls). According to the Rothamsted method (Ocio and Brookes, 1990), microbial biomass C was calculated as follows: biomass C = 31 (ninhydrin-N). The efficiency factor is used to transform to 100% the value obtained by fumigation, since there is only partial cell destruction using the fumigation-extraction method (Jenkinson, 1988).
2.6. Physical fractionation
Physical fractionation of soil organic matter was performed in soil of the upper 40 cm of each treatment following the method described by Feller et al. (1991)to obtain three aggregate-size classes. Samples of 50 g of dry soil were weighed and placed in 250 cc polyethylene bottles, to which 180 ml of distilled water and
10 glass beads (6 mm diameter) were added. The bottles were then placed in a rotary shaker (Reax 2, Heidolph) with a frequency of 50 rpm for 16 h, after which the samples were wet sieved using stainless steel sieves with 212- and 53-
m
m apertures. The following aggregate-size classes of organic matter were obtained: macroaggregates,>212m
m (separated by flotation of roots and residues); mesoaggregates, 212–53m
m; and microaggregates, <53m
m (organic matter associated to silt and clay). All the fractions were dried at 508C for 48 h and weighed afterwards, and the C and N contents were then measured by dry combustion (Wright and Bailey, 2001).2.7. Statistical analyses
The General Lineal Model procedure of SAS v.8.0 (SAS Institute Inc., 2002) for completely randomized designs was used to test the effect of treatment on soil microbial respiration and microbial biomass C. Statistical significance (p<0.05) between treatments was tested using Student’sttest and significant differences within treatments at different depths were tested using Tukey’s HSD multiple comparison test. Correlation analyses (Pearson’s coeffi-cient) were used to evaluate possible relationships among microbial biomass C, soil microbial respiration and soil organic carbon. In the case of physical fractionation of soil organic matter, Student’sttest was used to verify statistical significance between treatments at different depths and in different soil fractions. Finally, Tukey’s HSD multiple comparison test was used to check for significant interactions between depths and fractions in every treatment.
3. Results
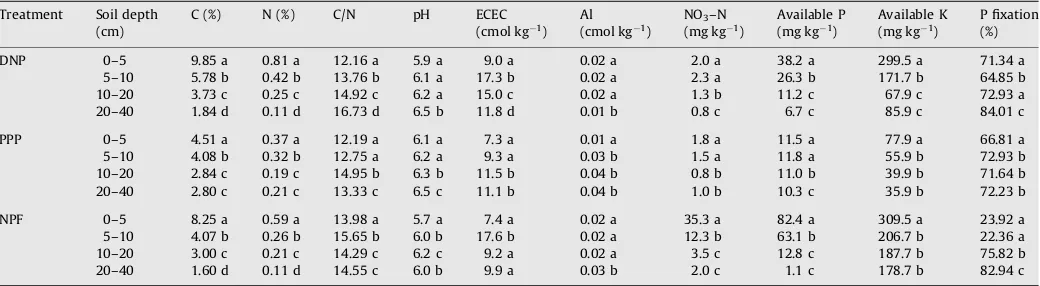
The soil morphology was relatively uniform among the land-use sites, as expected, considering the soil parent material is aerially deposited volcanic ash, the proximity and uniformity of the topography among the sites, and the original shared vegetation of native forest. The soil texture (0–100 cm) was loamy fine sand in all sites that varied slightly to fine sandy loam in the subsoil (>20 cm depth) of PPP. The soil structure was moderate fine granular in the surface (0–30 cm), which graded to weak fine granular in the subsoil, with no structure (massive) in the lowest horizon, and the bulk density was 0.9 g cm 3 or lower in all horizons. However, the chemical properties showed differences among treatments and are summarized inTable 1. In general, in the upper 20 cm of soil the contents of organic C and N were highest in DNP, but available N (NO3–N), P and K were highest in NPF. Fixation of P was also lowest in the upper 10 cm of soil of NPF.
Table 1
Chemical properties (organic C and N, effective cation exchange capacity, and contents of aluminum, nitrate, phosphorus and potassium) of the volcanic soil (medial, amorphic, mesic Typic Hapludands) (0–40 cm) under three temperate land uses. Measurements were taken in the Chilean Patagonia in March 2006.
Treatment Soil depth (cm)
C (%) N (%) C/N pH ECEC
(cmol kg1)
Al (cmol kg1)
NO3–N
(mg kg1)
Available P (mg kg 1)
Available K (mg kg 1)
P fixation (%)
DNP 0–5 9.85 a 0.81 a 12.16 a 5.9 a 9.0 a 0.02 a 2.0 a 38.2 a 299.5 a 71.34 a
5–10 5.78 b 0.42 b 13.76 b 6.1 a 17.3 b 0.02 a 2.3 a 26.3 b 171.7 b 64.85 b
10–20 3.73 c 0.25 c 14.92 c 6.2 a 15.0 c 0.02 a 1.3 b 11.2 c 67.9 c 72.93 a
20–40 1.84 d 0.11 d 16.73 d 6.5 b 11.8 d 0.01 b 0.8 c 6.7 c 85.9 c 84.01 c
PPP 0–5 4.51 a 0.37 a 12.19 a 6.1 a 7.3 a 0.01 a 1.8 a 11.5 a 77.9 a 66.81 a
5–10 4.08 b 0.32 b 12.75 a 6.2 a 9.3 a 0.03 b 1.5 a 11.8 a 55.9 b 72.93 b
10–20 2.84 c 0.19 c 14.95 b 6.3 b 11.5 b 0.04 b 0.8 b 11.0 b 39.9 b 71.64 b
20–40 2.80 c 0.21 c 13.33 c 6.5 c 11.1 b 0.04 b 1.0 b 10.3 c 35.9 b 72.23 b
NPF 0–5 8.25 a 0.59 a 13.98 a 5.7 a 7.4 a 0.02 a 35.3 a 82.4 a 309.5 a 23.92 a
5–10 4.07 b 0.26 b 15.65 b 6.0 b 17.6 b 0.02 a 12.3 b 63.1 b 206.7 b 22.36 a
10–20 3.00 c 0.21 c 14.29 c 6.2 c 9.2 a 0.02 a 3.5 c 12.8 c 187.7 b 75.82 b
20–40 1.60 d 0.11 d 14.55 c 6.0 b 9.9 a 0.03 b 2.0 c 1.1 c 178.7 b 82.94 c
The Al saturation was slightly higher in PPP (<0.4%). The chemical characteristics at 40–100 cm depth were similar to 20–40 cm and are therefore not presented here. In general, with increasing soil depth there were decreasing contents of C, N, available P and K, and increasing soil pH and C/N ratios. In all treatments, both organic C and N contents were significantly higher at 0–5 cm than 5–10 cm depths, at 5–10 cm than 10–20 cm depths, and at 10–20 cm than 20–40 cm depths, except in PPP where the C and N contents did not decrease between 10 and 40 cm depths. The C/N ratios also generally increased with soil depths. In DNP, the C/N ratio and ECEC were lower, and available P and K and P fixation were significantly higher in the upper 5 cm of soil, while Al was significantly lower at 20–40 cm and NO3at 10–40 cm depths. In PPP, the C/N ratio, pH, ECEC, NO3and available P had similar values among the 0–5 and 5–10 cm depths but were significantly different below the 10 cm depth, and Al was lower and available K higher at 0–5 cm depth only. In NPF, the C/N ratio, pH, NO3and available P were significantly different between the 0–5 and 5– 10 cm depths but generally similar between the other depths. Al and available K were higher at 20–40 cm and 0–5 cm depths, respectively, and fixation of P significantly higher starting 10 cm depth. Also, it is interesting to note that ECEC at 5–10 cm depth largely exceeds ECEC at other depths in DNP and NPF, that available P was higher in the upper 5 cm in these two treatments, and that available K was much higher at 0–5 cm depth in every land use.
3.1. Carbon content in soil and vegetation
Determination of soil C at 0–40 cm depth in DNP, PPP and NPF shows that DNP had the highest C contents, but was significantly higher than NPF only (Tables 2 and 3).
Aboveground and root biomass in NPF was significantly higher than PPP, but the latter contained much more leaf biomass than NPF (Table 2). Total root biomass per hectare in DNP was more than
1.5 times higher than in PPP. Total C content in DNP aboveground biomass was also significantly lower than in the other systems. However, C content in DNP root biomass was 63.5% higher than in PPP but less than half in NPF. Most C in NPF biomass was found in stems, followed by roots, branches and leaves. NPF contained almost seventeen times more C in stems than PPP, five times more C in branches, and four times more C in roots. Ponderosa pine needles contained five times more C than NPF leaves. There was more C in NPF biomass than the soil underneath, but the opposite was observed in the other ecosystems. Total C content was similar in DNP and PPP but both were less than half of that in NPF.
3.2. Distribution of soil organic carbon
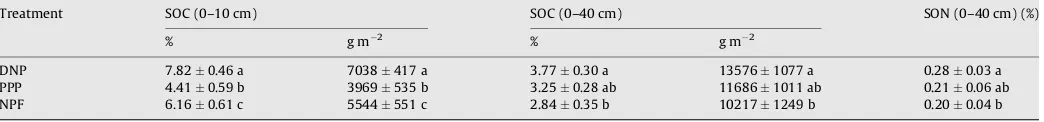
Total SOC at 0–40 cm depth of each ecosystem decreased in the order DNP>PPP>NPF (Table 3). There was a 33% increase in SOC that resulted from the conversion of NPF to DNP and a 14% decrease from DNP to PPP. SOC was significantly lower in NPF than DNP at 0–40 cm depth while no significant difference was found between other land-use practices. On the other hand, total SOC at 0–10 cm depth decreased in the order DNP>NPF>PPP. Averaged over the two soil layers, land-use practices affected significantly SOC stocks. There was a 27% increase from NPF to DNP, but a 44% decrease resulting from the conversion of DNP to PPP. It is interesting to note that SOC content in DNP was almost double the SOC content in PPP. SOC was also significantly higher in DNP and lower in PPP.
Total SOC at 0–10 cm depth was slightly more than half the total SOC at 0–40 cm depth in both DNP and NPF. However, SOC at 0– 10 cm depth in PPP was nearly three times lower than the total SOC at 0–40 cm depth. Both SOC and soil organic nitrogen (SON) concentrations were significantly higher in DNP than NPF at 0– 40 cm depth. In all ecosystems, SOC concentrations (%) were highest in the upper 10 cm. Finally, beyond 40 cm depth, C contents among distinct ecosystems were low and similar (data not shown).
Table 2
Biomass and carbon content (Mg ha 1) (mean
standard deviation) in soil at 0–40 cm depth and different plant components (trees and pasture) from three temperate land uses. Measurements were taken in the Chilean Patagonia in March 2006.
Treatment Total plant biomass (Mg DM ha 1)
Compartment
Stems Branches Leaves Total aboveground Total roots Total plant
DNP NA NA NA 3.80.5 a 41.18.0 a 44.9 a
PPP 23.70.3 a 12.40.1 a 14.40.2 a 50.50.5 b 25.10.4 b 75.6 b
NPF 399.25.4 b 56.60.5 b 2.740.02 b 458.55.9 c 97.40.9 c 555.9 c
Carbon content (Mg ha 1)
Stems Branches Leaves Roots Soil Total
DNP NA NA 1.90.3 a 20.64.0 a 135.810.8 a 158.3 a
PPP 11.90.2 a 6.20.1 a 7.20.1 b 12.60.2 b 116.910.1 ab 154.8 a
NPF 199.62.7 b 28.30.3 b 1.370.01 c 48.70.5 c 102.212.5 b 380.2 b
DNP: more than 50-year-old degraded natural pasture; PPP: 16-year-oldPinus ponderosaexotic plantation; NPF: 150-year-oldNothofagus pumiliosecond-growth forest. Values with the same lower case letter within a column (total plant biomass or carbon content) are not significantly different (Student’sttest, *P<0.05).
Table 3
Average soil organic carbon (SOC) and nitrogen (SON) concentrations (%) and C contents (g C m2) at 0–10 cm and 0–40 cm depths of different temperate land-use practices.
Measurements were taken in the Chilean Patagonia in March 2006 (averagestandard deviation).
Treatment SOC (0–10 cm) SOC (0–40 cm) SON (0–40 cm) (%)
% g m 2 % g m 2
DNP 7.820.46 a 7038417 a 3.770.30 a 135761077 a 0.280.03 a
PPP 4.410.59 b 3969535 b 3.250.28 ab 116861011 ab 0.210.06 ab
NPF 6.160.61 c 5544551 c 2.840.35 b 102171249 b 0.200.04 b
3.3. Soil microbial respiration
Soil microbial respiration did not vary significantly among treatments at 0–40 cm depth, nor at 0–5 and 5–10 cm depths (Table 4). However, PPP had the highest soil microbial respiration at 10–20 and 20–40 cm depths. At 10–20 cm depth, it was more than double than in DNP and NPF. At 20–40 cm depth, it was 45% higher than in DNP but only 17% higher than in NPF.
In all treatments, soil microbial respiration decreased with an increase of pH until a value of 6.2 (Tables 1 and 4). Above this value, soil microbial respiration remained fairly stable in DNP, but increased slightly and then decreased in PPP, until reaching a similar value to DNP at 20–40 cm depth. Soil microbial respiration in NPF followed the same trend, but decreased with a pH reduction from 6.2 to 6.0 beyond 20 cm depth. The increase of pH at further depths in DNP, PPP and NPF (Table 1) was associated with lower and stable values of soil microbial respiration (data not shown).
In all treatments, soil microbial respiration was significantly higher in the upper 5 cm then at any other depths (Table 4). In DNP, soil microbial respiration at 5–10 cm was also higher than at 20– 40 cm depth, but no significant difference was observed at 10– 20 cm depth. The same trends were encountered in NPF, the only exception being at 5–10 cm where microbial respiration was higher than at 10–40 cm depth. In PPP, soil microbial respiration tended to be of a more similar magnitude between 5 and 20 cm depth.
3.4. Microbial biomass C
Soil microbial biomass C was affected significantly by land-use treatments and decreased in the order DNP>NPF>PPP at 0–40 and 0–5 cm depths (Table 4). It was highest in DNP at all depths. At 0–40 cm depth, there was a 33% difference between DNP and NPF and a 36% difference between NPF and PPP. Additionally, microbial biomass in DNP was more than double than in PPP at depths of 0– 40, 0–5 and 5–10 cm. At 10–20 cm, microbial biomass was significantly higher in DNP than NPF, but no difference was observed with PPP. No further differences were encountered beyond 20 cm depth.
In general, the greater microbial biomass C in DNP at 0–5 and 5– 10 cm depths corresponded also to the higher SOC values found at these depths (Tables 1 and 3). The 0–5 and 5–10 cm depths are also those where the largest amount of live fine root biomass was encountered, especially in DNP from our field measurements (Table 2).
Soil microbial respiration values were positively correlated with microbial biomass C for all treatments together (R2= 0.86,
n= 36) (Fig. 1A). Additionally, microbial biomass C was strongly correlated with SOC (R2= 0.87,n= 12) (Fig. 1B).
In all treatments, microbial biomass C was significantly higher in the upper 5 cm then at any other depths (Table 2). In DNP, microbial C at 5–10 cm was also higher than at 10–40 cm depth, but no significant difference was observed between the 10–20 and 20–40 cm depths. The same trends were encountered in PPP and NPF. In PPP however, the microbial biomass C at 10–20 cm depth was not significantly different of the values observed at 5–10 and 20–40 cm depths.
The soil microbial respiration to microbial biomass C ratio was negatively correlated with SOC for all treatments together (R2= 0.49,
n= 36) (Fig. 2). As SOC decreased with depth, both microbial respiration and microbial biomass C also decreased because less substrate is available for the microorganisms to feed on.
Table 4
Mean soil microbial respiration (mg C–CO2g 1) and microbial biomass C (mg C g1) at different depths (0–40, 0–5, 5–10, 10–20 and 20–40 cm) under three temperate land-use practices. Measurements were taken in the Chilean Patagonia in March 2006 (averagestandard deviation).
Treatment Depth
0–40 cm 0–5 cm 5–10 cm 10–20 cm 20–40 cm
Soil microbial respiration (mg C–CO2g 1dry soil)
DNP 123.612.8 a 556.514.4 a A 123.048.7 a B 59.18.2 a BC 47.75.7 a C
PPP 134.224.4 a 408.3109.9 a A 113.116.5 a B 137.440.6 b B 69.45.1 b B
NPF 137.615.9 a 582.740.6 a A 163.427.8 a B 59.110.9 a C 59.19.3 ab C
Microbial biomass C (mg C g1dry soil)
DNP 978.1122.5 a 5289.5396.5 a A 1168.8227.9 a B 449.390.0 a C 117.043.9 a C
PPP 422.623.5 b 2001.385.0 b A 483.756.4 b B 284.0117.3 ab BC 82.023.8 a C
NPF 656.524.3 c 3705.0243.4 c A 1011.8329.6 a B 138.62.5 b C 64.425.9 a C
DNP: degraded natural pasture; PPP:Pinus ponderosaexotic plantation; NPF:Nothofagus pumiliosecond-growth forest. Values with the same lower case letter within a column (soil microbial respiration or microbial biomass C) are not significantly different (Student’sttest, *P<0.05). Values with the same higher case letter within the 0–5, 5–
10, 10–20 and 20–40 cm depths and one land use are not significantly different (Tukey’s HSD test, *P<0.05).
3.5. Aggregate-size distribution
Even with the large difference in SOC content (0–10 cm depth) between DNP and PPP (Table 3), there was no significant difference of aggregate-size distribution between these two ecosystems (Fig. 3). However there was a significant difference of macro-aggregates (>212
m
m) between NPF and the two other systems. The percentage of macroaggregates (containing the light fraction of organic matter) increased from 8% in DNP to 10 and 15% in PPP and NPF, respectively. On the other hand, a small but significant difference in 212–53m
m-sized mesoaggregates (containing the intermediate fraction of organic matter) was also observed between NPF and the two other systems. The percentage of mesoaggregates decreased from 38% in DNP and PPP to 35% in NPF. No significant differences in percentage of<53m
m-sized micro-aggregates (containing the heavy fraction of organic matter) were observed between ecosystems, although the values tended to decrease from 50 to 47 to 45% in DNP to PPP and to NPF, respectively. In all ecosystems, the soil fractions were dominated by microaggregates (<53m
m), followed by mesoaggregates (212– 53m
m) and ultimately by macroaggregates (>212m
m).The organic C concentrations (%) within the macroaggregates at 0–10 cm depth were not statistically different among the land-use
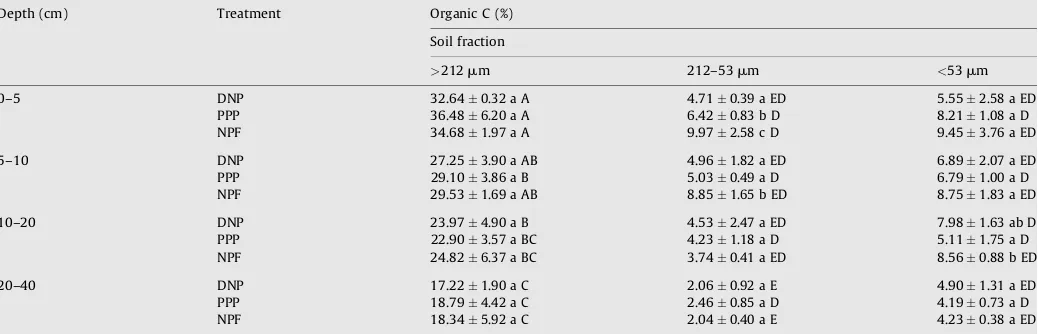
practices but were significantly higher than within the other fractions (Table 5) probably because of the presence of small root fragments. In PPP only, SOC was slightly higher in the macro-aggregate fraction in the upper 5 cm, where there is a constant input of needles and cones throughout the year, which contributes to the light fraction of SOM in this treatment. In all ecosystems, SOC in macroaggregates was also significantly higher at 0–5 cm depth than at 10–20 and 20–40 cm depths. Within every ecosystem however, the organic C concentrations did not differ statistically between the mesoaggregate and microaggregate fractions at 0–5, 5–10, 10–20 and 20–40 cm depths.
In general, the C contents in the mesoaggregate and micro-aggregate fractions were similar in both PPP and NPF, but statistically different in DNP at 0–40 cm depth. Within the mesoaggregates, the C concentration (0–10 cm depth) was significantly higher in NPF compared with DNP and PPP at 0– 10 cm depth (Table 5), showing that the greatest difference between ecosystems was found in that fraction. The mesoaggre-gate C concentration in NPF was 64% higher than in PPP and 94% higher than in DNP. Organic C content at 0–5 cm depth in
Fig. 2.Correlation matrix showing the relationship between the ratio of microbial respiration to microbial biomass and soil organic carbon (SOC) content (n= 36) over all treatments (degraded natural pasture, Pinus ponderosa exotic plantation,
Nothofagus pumiliosecond-growth forest. Measurements were taken in the Chilean Patagonia in March 2006.
Fig. 3.Proportion of dry soil weight at 0–10 cm depth in different soil fractions (macroaggregates (>212mm), mesoaggregates (212–53mm) and microaggregates (<53mm)) in different temperate land uses in the Chilean Patagonia, March 2006. DNP: degraded natural pasture, PPP: Pinus ponderosaexotic plantation, NPF:
Nothofagus pumiliosecond-growth forest. Vertical bars denote standard error of the mean. Values with the same lower case letter within a soil fraction are not significantly different (Student’sttest, *P<0.05).
Table 5
Mean organic carbon concentrations (%) at 0–5, 5–10, 10–20 and 20–40 cm depths in different soil fractions (macroaggregates (>212mm), mesoaggregates (212–53mm) and microaggregates (<53mm)) under three temperate land-use practices. Measurements were taken in the Chilean Patagonia in March 2006 (averagestandard deviation).
Depth (cm) Treatment Organic C (%)
Soil fraction
>212mm 212–53mm <53mm
0–5 DNP 32.640.32 a A 4.710.39 a ED 5.552.58 a ED
PPP 36.486.20 a A 6.420.83 b D 8.211.08 a D
NPF 34.681.97 a A 9.972.58 c D 9.453.76 a ED
5–10 DNP 27.253.90 a AB 4.961.82 a ED 6.892.07 a ED
PPP 29.103.86 a B 5.030.49 a D 6.791.00 a D
NPF 29.531.69 a AB 8.851.65 b ED 8.751.83 a ED
10–20 DNP 23.974.90 a B 4.532.47 a ED 7.981.63 ab D
PPP 22.903.57 a BC 4.231.18 a D 5.111.75 a D
NPF 24.826.37 a BC 3.740.41 a ED 8.560.88 b ED
20–40 DNP 17.221.90 a C 2.060.92 a E 4.901.31 a ED
PPP 18.794.42 a C 2.460.85 a D 4.190.73 a D
NPF 18.345.92 a C 2.040.40 a E 4.230.38 a ED
mesoaggregates decreased in the order NPF>PPP>DNP and were significantly different. There was a 36% decrease going from NPF to PPP and a 27% decrease from PPP to DNP. SOC in NPF was more than double than in DNP. At 5–10 cm depth, the organic C content follows the same trend as before, with the exception that it is significantly higher in NPF only. No differences are observed between C contents at further depths. In the microaggregate fractions, SOC contents were similar within ecosystems at different depths, except at 10–20 cm where it was statistically higher in NPF than in PPP.
4. Discussion
4.1. Soil microbial respiration
In the long term, trees in second-growth deciduous forests, just as trees in old agroforestry systems (Lee and Jose, 2003a) cause continual addition of litter and root turnover, thus maintaining or increasing soil organic matter (Kimmins, 2004), thereby influencing soil microbial respiration. In an incubation study byMallik and Hu (1997), the authors reported that soil organic matter is strongly related to soil microbial respiration and is one of the important factors controlling it. The significantly higher soil microbial respiration in PPP beyond 10 cm depth may be due to the presence of mycorrhizae in the root biomass that passed through the 2-mm mesh sieve, a fungi that also respire, and which symbiotic associations under pine trees is well known worldwide (Kimmins, 2004; Marx, 1991; Read, 1991). Most mycorrhizae may be encountered at 10–20 cm depth, thus explaining why the largest difference in soil microbial respiration is found at that depth.
On the other hand, our results show that C–CO2production had a tendency to be lower under PPP than DNP at 0–10 cm depth, but invariably not at 10–40 cm, in agreement with data obtained by
Ross et al. (2002) and Saggar et al. (2001)working with Pinus
radiatain New Zealand. In the upper 10 cm under DNP, there could be enrichment of the soil with labile C from fine roots and aboveground litter, which may explain the difference observed (Ross et al., 2002).
With respect to pH, continuous addition of above and below-ground litter for the past 150 years under NPF has altered soil characteristics, making it more acidic than under the 16-year-old ponderosa pine plantation. Surprisingly, despite the addition of aboveground litter from PPP throughout the rotation, the pH values at 0–40 cm depth make the soil under the plantation slightly less acidic than under DNP, an indication of the low buffering capacity of pasture litter. Our results are the opposite of those obtained byLee
and Jose (2003b)forPinus taedawho reported a positive correlation,
but in agreement forPopulus deltoides, where the soil respiration was negatively correlated with soil pH. However, one must consider that these authors measured total soil respiration, which includes microbial and root respiration. Also in all soils, pH increased with the increase of depth, showing the influence of precipitation and vegetation in superficial soil. Soil pH in itself may not be affecting the microbial respiration, but rather lack of substrate for microbial biomass with increasing depth.
The highest microbial respiration observed at 0–5 cm depth could result from the larger amount of soil organic matter and associated SOC (Table 1), larger microbial biomass C encountered in superficial soil layers (Table 4).Kelting et al. (1998)reported that respiration by root systems and their microbial biomass compo-nents represent a significant portion of soil respiration in most ecosystems.
On the other hand, similar values of microbial biomass C in PPP at 5–10, 10–20 and 20–40 cm depths as well as similar SOC contents could explain why soil microbial respiration did not vary significantly at these depths. In NPF higher microbial respiration at
5–10 cm depth could be attributed to the large associated amount of microbial biomass at the same depth, which is significantly higher than at lower depths (Table 4). Finally, the different amounts of microbial biomass C found at 5–10 and 20–40 cm depths in DNP may also explain the trends of soil microbial respiration that were observed at the same depths.
4.2. Microbial biomass C
Generally, the C/N ratio (Table 1) increased with an increase of soil depth in all ecosystems, which denotes that superficial organic matter was less resistant to microbial decomposition than organic matter in the subsoil. On the other hand, our data show that all ecosystems at 0–40 cm depth were poor to very poor in available N as NO3, with an intermediate level only at 0–5 cm depth in NPF. In any case however, this is a condition for temporal competition between plants and microorganisms for the nutrient, with prevalence that some net immobilization in favor of the microbes may occur. There is an efficient use of nitrogen if N being mineralized is absorbed by plants as NH4(nutrient uptake). Other nutrients as P were medium to high in all land uses and should not be a limiting factor for the metabolism and development of microbial biomass. Neither should the low levels of available K found at all depths in PPP and at 10–40 cm depth in DNP be a limiting factor given the low amounts needed by the microbes. Considering these three nutrients, PPP is the land use that shows the lowest available amounts available followed by DNP, NPF having the highest levels. This condition observed in PPP could perhaps constitute another reason for the higher soil microbial activity encountered at 10–20 and 20–40 cm depths, since stressed microbes generally respond by increasing CO2evolution per unit of biomass (Chander and Brookes, 1991a,b).
Our results for microbial biomass C at 0–10 cm depth in all ecosystems (3229.1, 1242.5 and 2358.4
m
g C g 1dry soil for DNP, PPP and NPF, respectively) are higher than those by Ross et al.(2002)who reported concentrations of microbial biomass C at 0–
10 cm depth of 750 mg C kg 1 in non-volcanic soil (Oxyaquic Drystrudept) underP. radiataand 1500 mg C kg 1in non-volcanic soil (Acric Fragiaqualf) under pasture in New Zealand. The differences observed could be explained by the unique properties of volcanic soils (Buol et al., 1997) in our study, which are generally characterized by low bulk density, the presence of allophanes, high phosphate retention and higher C contents in surface soils. Also in New Zealand in a volcanic soil (Typic Udivitrands), Ross et al.
(1999)reported lower values of 1600, 858 and 1600 mg C kg 1in a
pasture, pine plantation and indigenous forest, respectively, at 0– 10 cm depth, but higher values of 482, 473 and 819 mg C kg 1at 10–20 cm depth.
The significantly lower microbial biomass C at 0–10 cm depth in PPP, as compared with DNP and NPF, may be attributed to the distinct quality and distribution of available substrates in the three ecosystems (Zagal and Co´rdova, 2005; Ross et al., 1999; Scott and
Binkley, 1997). According to Ross et al. (2002) who obtained
similar results forP. radiataand pasture, readily metabolizable C may be lower in the pine than pasture and deciduous tree mineral soils, resulting in the lower values of microbial biomass C. Other studies have shown reductions of microbial C and N and changes in soil organic matter quality following afforestation of pastures with first-rotationP. radiataplantations (Beets et al., 2002; Ross et al., 1999; Giddens et al., 1997).
Lee and Jose (2003a)reported a positive correlation between
soil respiration rates and microbial biomass C for old and young pecan orchards and pecan/cotton alley-cropping systems (R2= 0.52,n= 21, P
as it included root respiration, thus showing a higher variability. On the other hand, the strong correlation observed between microbial biomass C and SOC is in close agreement with another correlation of microbial biomass C and soil organic matter obtained
byLee and Jose (2003b), in which R2= 0.84 andn= 21, and by
Witter et al. (1993), in whichR2= 0.82.
Based on our correlation results, it is clear that soil microbial respiration is highly related to microbial biomass C and soil organic carbon, but it is not possible at this point to determine the extent of each contributing factor on total soil respiration.
For every treatment, microbial biomass C decreased with an increase of pH and depth (Tables 1 and 4), a similar behavior to soil microbial respiration. Again, this is probably more related to soil depth, where there is less SOM and the associated microbial biomass. Our results are the opposite of those obtained byLee and
Jose (2003b)forP. taedawho reported a positive correlation, but in
agreement with their results forP. deltoides, where the microbial biomass C was strongly and negatively correlated with soil pH.
With respect to the negative correlation observed between the soil microbial respiration to microbial biomass C ratio and SOC, it is interesting to note that microbial respiration decreased at a slower rate than microbial biomass, which explains why the ratio increases. On an equivalent mass basis, the ratio could be a good indicator of microbial activity. From our data, it appears that the microbes are more active in soil from PPP, followed by NPF and lastly by DNP.
4.3. Distribution of soil organic carbon
The SOC contents obtained are somewhat of similar magnitude as those reported byHuygens et al. (2005)for an Andisol at 0– 30 cm depth in southern Chile, who observed a 31% increase and 42% decrease of SOC for the conversion from second-growth
Nothofagus obliqua forest to grass and grass to P. radiata, respectively. However, the 14% decrease of SOC at 0–40 cm depth from our investigation is much lower than the 42% decrease reported in that study, but the 44% decrease at 0–10 cm depth and 31% decrease at 0–20 cm depth in this investigation are more similar to their results.
The highest SOC contents in DNP at 0–10 cm depth could be explained by the continuous ground cover and the large root turnover and production at the surface, where aeration in the thick root mat is relatively low and reduces the decomposition rate of organic matter. According to Yakimento (1998), more intense humus formation would occur in such environments.Jobbagy and
Jackson (2000)also reported that the annual turnover of SOC from
dying tree roots is less than from grass roots.
On the other hand, differences of SOC observed between tree species could be due to the distinct quality of plant material from different forest types (Lal et al., 1995), and to the high C input to the soil from NPF, where older deciduous trees provide yearly litterfall and have been in place for a much longer period of time, and where the presence of understorey provides an extra input of organic residues to soil. At 0–10 cm depth, the lower C content in PPP could also be explained by soil disturbances during the establishment causing soil erosion or loss in physical protection of SOC (Guo and Gifford, 2002). Moreover at the moment of the study, the plantation was only 16 years old, out of which the first years after its establishment were characterized by very little biomass and low litterfall rate, thus resulting in low input of SOC (Wilde, 1964). In forest environments, SOC inputs come in part from aboveground litterfall that accumulates on the surface soil. Therefore, fallen leaves decompose partially on the surface before being incorporated into the soil, resulting in a smaller accumula-tion of SOC and a thinner A horizon than grasslands (Paul et al., 2002).
The total soil organic carbon contents at 0–10 cm depth (7038, 3969 and 5544 g C m 2for DNP, PPP and NPF, respectively) were similar to those obtained byHuygens et al. (2005), who reported 6700, 4300 and 5800 g C m 2 at the same depth in an Andisol under pasture,P. radiataplantation andNothofagus obliqua second-growth forest. In their study, the sites were originally covered with theNothofagusforest, which was partly converted to grassland 50– 100 years ago and where pine plantation was established 16 years ago. Our data suggest a large potential for additional SOC sequestration at 0–10 cm depth under PPP and a smaller potential under DNP.
On the other hand,Stolpe et al. (2008)reported substantially lower C contents at 0–40 cm depth in non-volcanic soils (Ultic Palexeralfs) under Acacia cavens forests, known as Espinals in central Chile. They encountered 2697, 2516 and 1746 g C m 2in well-preserved (80–51% cover), typical (50–26% cover) and degraded (25–10% cover) Espinals.
In NPF, macroaggregation (>212
m
m) was significantly higher and mesoaggregation (212–53m
m) lower than in the other two systems (Fig. 3). This is in agreement with the results reported bySix et al. (2002)for forest and afforested systems in non-volcanic
soils. The larger amount of root fragments developed over the last 150 years under the second-growth system could explain why more macroaggregates are present than in the other systems. However, our results for microaggregates (<53
m
m) are the opposite of those by Six et al. (2002), who reported the lowest amount from that fraction (<53m
m) in forest systems.The higher C content in the mesoaggregates at 0–10 cm depth indicates that NPF has the best soil quality, which could be attributed to the very low anthropogenic intervention over the last 100 years. The better quality of organic matter found in NPF is also reflected by the presence of more NO3–N and available P and K. SOM quality is essential for productivity and sustainability of the ecosystem as it helps retain more available nutrients and water, which enhances plant growth and results in larger amounts of C being captured in the vegetation.
Our results did not indicate any significant differences in C concentrations within the microaggregates among the ecosystems, although SOC tended to be higher in NPF. Our results show the importance of stable mesoaggregate fractions as the primary site of long-term carbon sequestration in soils. The largest amount of SOC was stabilized within the mesoaggregate fractions associated with mineral particles of lower size of NPF, which was the less disturbed ecosystem. In such environments, there is a macroaggregate turnover that permits the formation of stable mesoaggregates within macroaggregates, which protect SOC during extended periods of time (Six et al., 1998, 2000). Other studies (Six et al., 2002; Balesdent et al., 2000; Christensen, 2001) have illustrated that enrichment of stable mesoaggregates can act as a carbon sink in the long term.
4.4. Carbon content in soil and vegetation
The deep thick root mat encountered in DNP easily explains why there is still more C contained therein than PPP, but this may not be always the case as the plantation gets older and develops bigger taproots and coarse roots (Kimmins, 2004), as already observed in the 150-year-old NPF. On the other hand, the large difference in C contents in leaves between PPP and NPF would tend to decrease as the pines age and reduce the proportion of their crowns and therefore, the amount of C allocated to that part of the tree (Litton et al., 2007).
in superficial soil, which are therefore easily decomposed. On the other hand, trees provide organic matter from leaves that fall on the ground but do not get incorporated to the soil in the short term. The DNP soil has more total C than the other systems, although it is more degraded, as evidenced by the lower C concentrations in the macroaggregate and mesoaggregate fractions (Table 5). Non-degraded pasture soil would have even larger total C, especially in these soil fractions. On the other hand, the decreasing C and N concentrations from 0 to 40 cm depth in every treatment were expected as SOM contents decreased with increasing depths, with the highest values in the upper 5 cm (Table 1). Also, the greater C/N ratios with depth indicated that the stability of SOM increased with soil depth in every treatment.
5. Conclusions
A basic assumption in this comparative study is that the soils were all similar in their biological, chemical and physical proper-ties initially in each ecosystem. Although we cannot test this assumption, it is likely that the soils were similar to at least 40 cm depth of mineral soil, since they all originated from the same volcanic source.
In summary, soil microbial respiration was slightly greater in NPF in almost all depths. In all ecosystems, it was always greater at 0–5 cm depth than at any other depths. Soil microbial respiration beyond 10 cm depth in PPP was significantly higher than in the other systems, which could be attributed to the presence of mycorrhizae that have their own additional respiration. Microbial biomass C was significantly greater in DNP and lower in PPP. The different quality of available substrates and distribution of C inputs in the three ecosystems may explain why. Soil microbial respiration was also correlated positively with microbial biomass C and SOC, but we cannot at this point determine the contribution of each factor on soil respiration. The different land uses affect the formation of organic matter, SOC and microbial biomass C, which in turn will affect soil microbial respiration.
Conversion of DNP to PPP resulted in a 44% decrease of SOC stocks in 0–10 cm mineral soil, emphasizing the decline in soil organic matter in the short term, and also associated with disturbance of the site when PPP was established. But changes were less pronounced and non significant at 0–40 cm depth. However, the data suggest a larger potential for additional SOC sequestration under PPP at 0–10 cm depth, due to the unique properties of volcanic soils, which are characterized by the presence of allophanic clays and higher C contents in surface soils. Long-term SOC sequestration can also be enhanced by physical protection of SOC through aggregation. The largest amount of SOC was stabilized within the mesoaggregate fraction of the less disturbed system, NPF, followed by PPP. In the long term, formation of stable mesoaggregates in soils protected from erosion can behave as carbon sinks. Soil disturbance through wind and water erosion, just like tillage, accelerates the destruction of soil organic matter and results in increased loss of SOC.
The organic matter content was higher in DNP but of better quality in NPF, which is reflected by the presence of more NO3–N and available P and K, a higher proportion of>212
m
m organic matter, and intermediate contents of microbial biomass C. Soil organic matter quality is essential for productivity and long-term sustainability of the ecosystem as it helps retain more available water and nutrients that can be used by plants, therefore enhancing their growth, which ultimately results in more C being sequestered in the vegetation.There was more C in NPF biomass than the soil underneath, but the opposite was observed in the other ecosystems. Total C content was slightly higher in DNP than PPP. However, total C content in NPF was more than twice the content in PPP and DNP.
The introduction of silvopastoral practices in pine plantations by thinning trees could optimize soil organic matter and SOC formation, microbial biomass C and soil microbial respiration because of the interaction of trees and pasture in the same unit of land, and sequester larger amounts of C in both the aboveground and belowground biomass. The establishment of leguminous pasture, such as clover, can increase soil fertility through N fixation, thus benefiting tree growth. Also, trees growing in pasture may protect the soil against erosion, constitute efficient wind-breaks and provide extra incomes to the landowners throughout the forest rotation, including C credits, as outlined in the Kyoto Protocol.
Acknowledgements
We wish to acknowledge and express our sincere thanks to Mr. Victor Mata for giving us access to his property for data collection, and to Susana Mun˜oz, Soledad Espinoza and INIA-Quilamapu for assistance in the laboratory. This study was funded by a grant (Project N8205.123.007-ISP) from the Direction of Investigations of the University of Concepcio´n and the Centro de Investigaciones en Ecosistemas de la Patagonia (CIEP).
References
Balesdent, J., Chenu, C., Balabane, M., 2000. Relationship of soil organic matter dynamics to physical protection and tillage. Soil Tillage Research 53, 215–230. Beets, P.N., Oliver, G.R., Clinton, P.W., 2002. Soil carbon protection in podocarp/ hardwood forest, and effects of conversion to pasture and exotic pine forest. Environmental Pollution 116, S63–S73.
Buol, S.W., Hole, F.D., McCracken, R.J., Southard, R.J., 1997. Soil Genesis and Classification, 4th ed. Iowa State University Press, Ames, Iowa, 527 pp. Carter, M., 2002. Soil quality for sustainable management: organic matter and
aggregation indicators that maintain soil functions. Agronomy Journal 94, 38– 47.
Chander, K., Brookes, P.C., 1991a. Microbial biomass dynamics during the decom-position of glucose and maize in metal-contaminated and non-contaminated soils. Soil Biology and Biochemistry 23, 917–925.
Chander, K., Brookes, P.C., 1991b. Effects of heavy metals from past application of sewage sludge on microbial biomass and organic matter accumulation in a sandy loam and silty loam U.K. soil. Soil Biology and Biochemistry 23, 927–932. Christensen, B.T., 2001. Physical fractionation of soil and structural and functional complexity in organic matter turnover. European Journal of Soil Sciences 52, 345–353.
Day, P.R., 1965. Particle fractionation and particle size analysis. In: Black, C.A. (Ed.), Methods of Soil Analysis, Physical and Mineralogical Properties. Amer-ican Society of Agronomy, Madison, WI, pp. 545–567.
Feller, C., Burtin, G., Ge´rard, B., Balesdent, J., 1991. Utilisation des re´sines sodiques et des ultrasons dans le fractionnement granulome´trique de la matie`re organique des sols: inte´reˆts et limites. Sciences du Sol 29 (2), 77–94.
Gayoso, J., Guerra, J., Alarco´n, D., 2002. Contenido de carbono y funciones de biomasa en especies natives y exo´ticas. In: Medicio´n de la capacidad de captura de carbono en bosques de Chile y promocio´n en el Mercado mundial. Proyecto FONDEF D98I1076, Informe Te´cnico, Univ. Austral de Chile, Valdivia, 157 pp. Giddens, K.M., Parfitt, R.L., Percival, H.J., 1997. Comparison of some soil properties underPinus radiataand improved pasture. New Zealand Journal of Agricultural Research 40, 409–416.
Gobierno Regional de Ayse´n, 2002. Plan Regional, Ordenamiento Territorial, Regio´n de Ayse´n. Gobierno Regional de Ayse´n, Chile.
Guo, L.B., Gifford, R.M., 2002. Soil carbon stocks and land use change: a metaana-lysis. Global Change Biology 8, 345–360.
Huygens, D., Boeckx, P., Van Cleemput, O., Oyarzun, C., Godoy, R., 2005. Aggregate and soil organic carbon dynamics in South Chilean Andisols. Biogeosciences 2, 159–174.
IPCC, 2001. Climate change 2001: the scientific basis. In: Houghton, J.T., Ding, Y. (Eds.), Noguer, M., van der Linden, P.J., Dai, X., Mashell, K. (Eds.), Contribution of Working Group I to the Third Assessment Report of the Intergovernmental Panel on Climate Change. Cambridge University Press, Cambridge, UK, 881 pp. Jenkinson, D.S., 1988. Determination of microbial biomass carbon and nitrogen in soil. In: Wilson, J.R. (Ed.), Advances in Nitrogen Cycling in Agricultural Ecosys-tems. CAB International, Wallingford, pp. 368–386.
Jobbagy, E.G., Jackson, R.B., 2000. The vertical distribution of soil organic carbon and its relation to climate and vegetation. Ecological Applications 10, 423–436. Joergensen, R.G., Brookes, P.C., 1990. Ninhydrin-reactive nitrogen measurements of
microbial biomass in 0.5 M K2SO4soil extracts. Soil Biology and Biochemistry
22, 1023–1027.
Kimmins, J.P., 2004. Forest Ecology: A Foundation for Sustainable Forest Manage-ment and EnvironManage-mental Ethics in Forestry, 3rd ed. Prentice Hall, Upper Saddle River, NJ, 611 pp.
Lal, R., Kimble, J.M., Levine, E., Stewart, B.A., 1995. World soils and greenhouse effect: an overview. In: Lal, R., Kimble, J.M., Levine, E., Stewart, B.A. (Eds.), Soils and Global Change. CRC Lewis Publishers, Boca Raton, pp. 1–7.
Lee, K.H., Jose, S., 2003a. Soil respiration and microbial biomass in a pecan – cotton alley cropping system in Southern USA. Agroforestry Systems 58, 45–54. Lee, K.H., Jose, S., 2003b. Soil respiration, fine root production, and microbial
biomass in cottonwood and loblolly pine plantations along a fertilizer gradient. Forest Ecology and Management 185, 263–273.
Litton, C.M., Raich, J.W., Ryan, M.G., 2007. Carbon allocation in forest ecosystems. Global Change Biology 13, 2089–2109.
Loguercio, G.A., Defosse´, G., 2001. Ecuaciones de biomasa ae´rea, factores de expan-sio´n y de reduccio´n de la lenga Nothofagus pumilio (Poepp. et Endl.) Krasser en el SO del Chubut, Argentina. In: Proceedings of the Simposio internacional de medicio´n y monitoreo de captura de carbono en ecosistemas forestales, 18–20 October 2001, Valdivia, Chile, pp. 1–11.
Mallik, A.U., Hu, D., 1997. Soil respiration following site preparation treatments in boreal mixedwood forest. Forest Ecology and Management 97, 265–275. Marx, D.H., 1991. The practical significance of ectomycorrhizae in forest
establish-ment. In: Ecophysiology of Ectomycorrhizae of Forest Trees, The Marcus Wal-lenberg Foundation, Symposia Proceedings 7, Falun, Sweden, pp. 54–90. McLean, E.O., 1982. Soil pH and lime requirement. In: Page, A.L. (Ed.), Methods of
Soil Analysis, 2nd ed., Part 2. Chemical and Microbiological Properties. Madison, WI, pp. 199–224.
Ocio, J.A., Brookes, P.C., 1990. An evaluation of methods for measuring the microbial biomass in soils following recent additions of wheat straw and the character-ization of the biomass that develops. Soil Biology and Biochemistry 22, 685– 694.
Paul, K.I., Polglase, P.J., Nyakuengama, J.G., Khanna, P.K., 2002. Change in soil carbon following afforestation. Forest Ecology and Management 168, 241–257. Peichl, M., Thevathasan, N.V., Gordon, A.M., Huss, J., Abohassan, R., 2006. Carbon
sequestration potentials in temperate tree-based intercropping systems, south-ern Ontario, Canada. Agroforestry Systems 66, 243–257.
Post, W.M., Kwon, K.C., 2000. Soil carbon sequestration and land-use change: processes and potentials. Global Change Biology 6, 317–328.
Read, D.J., 1991. Mycorrhizal fungi in natural and semi-natural plant communities. In: Ecophysiology of Ectomycorrhizae of Forest Trees, The Marcus Wallenberg Foundation, Symposia Proceedings 7, Falun, Sweden, pp. 27–53.
Ross, D.J., Tate, K.R., Scott, N.A., Wilde, R.H., Rodda, N.J., Townsend, J.A., 2002. Afforestation of pastures withPinus radiatainfluences soil carbon and nitrogen pools and mineralisation and microbial properties. Australian Journal of Soil Research 40, 1303–1318.
Ross, D.J., Tate, K.R., Scott, N.A., Feltham, C.W., 1999. Land-use change: effects on soil carbon, nitrogen and phosphorus pools and fluxes in three adjacent ecosystems. Soil Biology and Biochemistry 31, 803–813.
Rowell, D.L., 1994. Soil Science, Methods and Applications. Longman Scientific and Technical, Essex, England, 350 pp.
Sadzawka, A., Carrasco, M., Grez, R., Mora, M., Flores, H., Neaman, A., 2006. Recommended Analytical Methods for Chilean Soils. Ministry of Agriculture-INIA, Santiago, Chile.
Saggar, S., Hedley, C.B., Salt, G.J., 2001. Soil microbial biomass, metabolic quotient, and carbon and nitrogen mineralisation in a 25-year-oldPinus radiata Agrofor-estry regime. Australian Journal of Soil Research 39, 491–504.
SAG-Gobierno Regional de Ayse´n, 1999. Informe Final Proyecto FNDR ‘‘Levanta-miento para el Ordena‘‘Levanta-miento de los Ecosistemas de Ayse´n’’. SAG, Ministerio de Agricultura, Gobierno Regional de Ayse´n, Chile.
SAS Institute Inc., 2002. SAS user’s guide: Statistics. SAS Institute Inc., Cary, NC, USA. Scott, N.A., Binkley, D., 1997. Litter quality and annual net N mineralization:
comparison across North American forest sites. Oecologia 111, 151–159. Silva, F., Ahumada, M., Cerda, J., 1999. Guide for pasture condition in the
Inter-mediate Temperate ecological region of Ayse´n. Regional Government of Ayse´n, Chile. Ministry of Agriculture-SAG, Santiago, Chile.
Six, J., Elliott, E.T., Paustian, K., Doran, J.W., 1998. Aggregation and soil organic matter accumulation in cultivated and native grassland soils. Soil Science Society of America Journal 62, 1367–1377.
Six, J., Elliott, E.T., Paustian, K., 2000. Soil macroaggregate turnover and microag-gregate formation: a mechanism for C sequestration under no-tillage agricul-ture. Soil Biology and Biochemistry 32, 2099–2103.
Six, J., Callewaert, P., Lenders, S., De Gryze, S., Morris, S.J., Gregorich, E.G., Paul, E.A., Paustian, K., 2002. Measuring and understanding carbon storage in afforested soils by physical fractionation. Division S-7 Forest and Range Soils. Soil Science Society of America Journal 66, 1981–1987.
Soil Survey Staff, 1992. Soil Survey Laboratory Methods Manual. Soil Conservation Service, USDA, Washington, DC.
Soil Survey Staff, 2006. Keys to Soil Taxonomy. Natural Resources Conservation Service, USDA, Washington, DC.
Stolpe, N., Mun˜ oz, C., Zagal, E., Ovalle, C., 2008. Modeling soil carbon storage in the ‘‘Espinal’’ agroecosystem of Central Chile. Arid Land Resource Management 22, 148–158.
Tate, R.L., 1987. Organic matter transformation: ecosystem examples. In: Soil Organic Matter, Biological and Ecological Effects, Wiley, New York, pp. 26–53. Thomas, G.W., 1982. Exchangeable cations. In: Page, A.L. (Ed.), Methods of soil analysis, 2nd ed., Part 2, Chemical and Microbiological Properties. Madison, WI, pp. 159–165.
Vance, E.D., Brookes, P.C., Jenkinson, D.S., 1987. An extraction method for measuring microbial biomass C. Soil Biology and Biochemistry 19, 703–707.
Wada, K., 1985. The distinctive properties of Andosols. In: Stewart, B.A. (Ed.), Advances in Soil Sciences, vol. 2. Springer Verlag, New York, pp. 174–229. Weber, M., 1999. Kohlenstoffvorra¨te einesNothofagus-Prima¨rwaldes auf Feuerland.
Forstwissenschaftliches Centralblatt 118, 156–166.
Wilde, S.A., 1964. Changes in soil productivity induced by pine plantations. Soil Sci. 97, 276–278.
Witter, E., Martensson, A.M., Garcia, F.V., 1993. Size of the soil microbial biomass in a long-term experiment as affected by different N-fertilizers and organic manure. Soil Biology and Biochemistry 25, 659–669.
Wright, A.F., Bailey, J.S., 2001. Organic carbon, total carbon, and total nitrogen determinations in soils of variable calcium carbonate contents using a Leco CN-2000 dry combustion analyzer. Communications in Soil Science and Plant Analysis 32, 3243–3258.
Yakimento, E.Y., 1998. Soil comparative evolution under grasslands and woodlands in the forest zone of Russia. In: Lal, R., Kimble, J.M., Follet, R.F., Stewart, B.A. (Eds.), Management of Carbon Sequestration in Soil. CRC Press, Boca Raton, pp. 391–404.
Zagal, E., Co´rdova, C., 2003. Fraccionamiento fı´sico de la materia orga´nica en un Andisol cultivado. In: Vidal, I. (Ed.), Manejo Sustentable de Suelos Chilenos. University of Concepcio´n, Chilla´n, Chile, pp. 282–290.