IDENTIFICATION OF HIGH POTENTIAL BAYS FOR HABs OCCURRENCE IN
PENINSULAR MALYSIA USING PALSAR REMOTE SENSING DATA
Amin Beiranvand Pour*, Mazlan Hashim Geoscience and Digital Earth Centre (Geo-DEC) Research Institute for Sustainability and Environment (RISE)
Universiti Teknologi Malaysia (UTM) 81310 UTM Skudai, Johor Bahru, Malaysia
*Corresponding author: [email protected]
Commission VI, WG VI/4
KEY WORDS: PALSAR Remote sensing data; Coastal geology mapping, HABs, Malaysian bays
ABSTRACT:
Increasing frequency, intensity, and geographic distribution of Harmful algal blooms (HABs) poses a serious threat to the coastal fish/shellfish aquaculture and fisheries in Malaysian bays. Rising in sea level, shoreline erosion, stresses on fisheries, population pressure, interference of land-use and lack of institutional capabilities for integrated management make major challenges. Recent investigations and satellite observations indicate HABs originated from specific coast that have favourable geographic, geomorphic and coastal geology conditions to bring the green macro algae from the coast offshore. Therefore, the identification of high HABs frequented bays using remote sensing and geology investigations in Malaysian waters is required to reduce future challenges in this unique case. This research implemented comprehensive geomorphic and coastal geology investigations combined with remote sensing digital image processing approach to identify Malaysian bays frequented with HABs occurrence in Malaysian waters territory. The landscape and geomorphological features of the Malaysian bays were constructed from the Phased Array type L-band Synthetic Aperture Radar (PALSAR) remote sensing satellite data combined with field observations and surveying. The samples for laboratory analysis were collected from the sediment stations with different distance across shorelines features and watersheds of the Johor Bahru estuary. This research identified that semi-enclosed bays such as Kuala Lumpur and Johor Bahru bays with connection to estuaries have high potential to be frequented with HABs occurrence.
1. INTRODUCTION
One the most acute and commonly recognized symptom of eutrophication in marine and freshwater environments is harmful algal blooms (HABs). HABs occur in many regions of the world and involve toxic and harmful phytoplankton. Harmful algal blooms can cause fish kills, human illness through shellfish poisoning, and death of marine mammals and shore birds (Anderson, 2002). The most conspicuous effects of HABs on marine wildlife are largescale mortality events associated with toxin producing blooms. Harmful algal blooms are often referred to as “red tides” or “brown tides” because of the appearance of the water when these blooms occur. One red tide event, which occurred near Hong Kong in 1998, wiped out 90 percent of the entire stock of Hong Kong’s fish farms and resulted in an estimated economic loss of $40 million USD (Lu and Hodgkiss, 2004).Malaysian bays are considered vulnerable to the impacts of climate change and anthropogenic activities. In addition to the expected rise in sea level, shoreline erosion, stresses on fisheries, population pressure, and interference of land-use and lack of institutional capabilities for integrated management make major challenges. Remote sensing satellite data monitoring and geological investigations are capable to show definite changes in coastal morphology and landscape of the Malaysian bays. Harmful algal blooms (HABs) occur frequently in the South China Sea, causing enormous economic
2. MATERIALS AND METHODS 2.1 Remote sensing data
In this investigation, mosaic ScanSAR mode dual polarization (level 3.1) PALSAR-2 scenes were obtained from ALOS-2 data distribution consortium online system Remote Sensing Technology Center of Japan (RESTEC) (http://www.restec.or.jp/english/index.html) for comprehensive analysis of major structural features of Peninsular Malaysia bays at regional scale. The data used in this study were acquired on May 23, 2015. The data were processed using the ENVI (Environment for Visualizing Images) version 5.2 and Arc GIS version 10.3 software packages.
2.2 Field observations and surveying
Coastal Geology refers to the origin, structure, and characteristics of the sediments that make up the coastal region, from the uplands to the nearshore region. The sediments and geology that compose a particular coastline is the product of physical and chemical processes that take place over thousands of years. Fieldwork was conducted during a scientific expedition in Johor Bahru bays, Estuaries and surrounding terrains between 20 and 25 May 2015, to collect sample for laboratory analysis from the sediment stations with 10m, 100m and 1000m distance across shorelines features and Estuaries and watersheds. GPS survey was carried out using a Garmin®
MONTERRA® with an average accuracy 5 m in sample collected location points in the study area. Organic materials such as N, P, Fe, Na, Ca, Si and C in sediment samples were analyzed by X-ray fluorescence spectrometers (XRF) technique and compared with recent algal bloom events.
2.3 Data analysis
The presence of speckle in Synthetic Aperture Radar (SAR) images reduce the detectability of ground targets, obscures the spatial patterns of surface features, and decreases the accuracy of automated image classification. Therefore, it is necessary to treat the speckle by filtering the data before it can be used in various applications (Lee and Jurkevich, 1994; Sheng and Xia, 1996). To fulfill the aim of this study, the median spatial convolution filter was used for noise removal and smoothing the PALSAR images. The median filter is a particularly useful statistical filter in the spatial domain, which effectively remove speckle (salt and pepper noise) in radar images without eliminating fine details (Pour and Hashim, 2014, 2015a,b; Schowengert, 2007). The RGB color composites additive primary colors allow the assignment of three different types of information (e.g image channels) to the three primary RGB colors. The color composite facilitates the interpretation of multichannel image data due to the variations in colors based on the values in the single channels (Pour and Hashim, 2011a, b).
3. RESULTS AND DISCUSSION
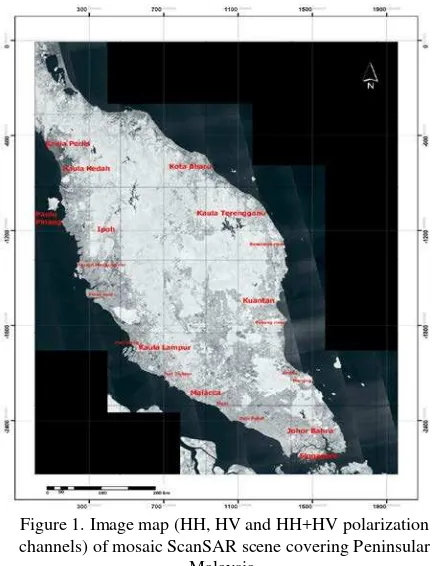
Mosaic ScanSAR was used for comprehensive analysis of major geomorphic and coastal geology of Malaysian bays at regional scale for Peninsular Malaysia. Synthetic Aperture Radar (SAR) has a special feature of being able to observe regardless of time (day and night) and all-weather conditions. Figure 1 shows image map of HH, HV and HH+HV polarization channels for Peninsular Malaysia. It yields an image with great structural details and geomorphological information for Malaysian bays in
Peninsular Malaysia. Geomorphic coastal features such as cuspate foreland, tombolo, spits, bay, lagoon, Barrier Island and estuary are observable in Figure 1.
Figure 1. Image map (HH, HV and HH+HV polarization channels) of mosaic ScanSAR scene covering Peninsular
Malaysia.
main river systems are portrayed purple in the image, which have lowest backscattering radar signal. Blue colour areas in the scene are wetlands, low altitude regions and/or rice paddy in agricultural lands. This map shows that Kuala Lumpur estuary is a river-dominated estuary with Barrier Island and lagoon, which is a low ocean-influenced system. Therefore, this estuary has restricted circulation and high nutrient inputs from watershed and air-shed due to human activity. In this region, the expression of HABs is extensive and the level of human influence is high. Atmospheric nitrogen from automobile and power plant emissions, nitrogen and phosphorus from waste water treatment plants, urban runoff and fertilizer applied to crops and from farm animals are transported to the estuary, where it spurs overgrowth of algae, causing numerous problems.
Figure 2. Image map of Kuala Lumpur estuary extracted from PALSAR HV polarization channel.
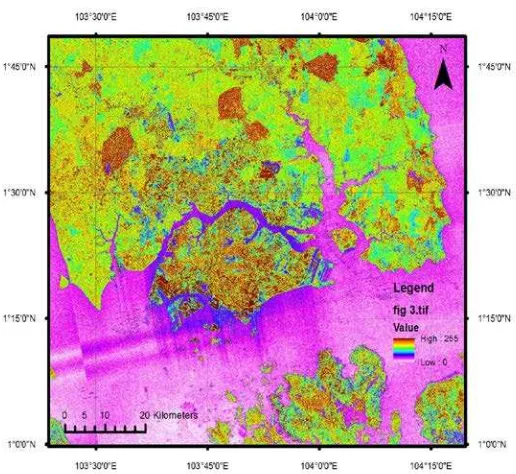
Figure 3 shows Johor Bahru estuary. In this image, urbanization regions appear as brown colour, agricultural lands as yellow to light green colour, Lakes and main river systems as purple colour and wetlands, low altitude regions and/or rice paddy in agricultural lands as blue colour. Johor Bahru estuary is a river-dominated estuary. Cuspate foreland, tombolo, spits, bay, lagoon and Barrier Island are mapped in this region, which are geometric coastal patterns influenced on water flow. Water circulation is restricted here and nutrient inputs are mainly human-related and are due to high coastal population density. Various agricultural practices (e.g., fertilizer application, animal feedlot operation), the burning of fossil fuels, sewage treatment effluents and rapid rates of development pose a great challenge to this estuary. The level of nutrients entering Johor Bahru estuary is very high due to vast watershed and air-shed and geometric spreading of the estuary.
Figure 3. Image map of Johor Bahru estuary extracted from PALSAR HV polarization channel.
Pahang estuary is shown in Figure 4. In this image, brown tone regions are forested region that are governed in Pahang watershed. Yellow to light green colour are Agricultural lands. Urbanization regions are concentrated near Kuantan bay as brown color. Purple hue in the image is main river systems and Lakes. Wetlands, low altitude regions and/or rice paddy in agricultural lands are manifested as blue color. Geomorphic coastal features such as cuspate foreland, tombolo, spits and bay are observable in Figure 4. Image map shows that Pahang estuary is an ocean-influenced system with open water circulation. Nutrient input related to human activity into the estuary is not high in this region. Urbanization and agricultural lands are small sectors in the watershed. High nutrient loads are largely attributed to influence of expanding and dense coastal human populations. Freshwater inflow, tide and estuarine geometry indicate few impacts of nutrient input could be from land sources. Weather patterns and climate change are important physical factors for HABs occurrence in this region.
Results derived from laboratory analysis show that many of sediments samples have high percentages of N, P, Fe, Na, Ca, Si and C. Consequently, heavy monsoon rainfall (wet seasons from September to December and February to May) in Johor Bahru river basin caused excessive loading of nutrients into water bodies.
Autotrophy algae blooming in water normally can be seen after flash flooding in Johor Bahru and Singapore bays, which composes its bioplasm by sunlight energy and inorganic substances through photosynthesis as follows:
106CO2+ 16NO-3 + HPO-2 4 +122H2O+18H+
C106H263O110N16P (bioplasm of algae)+138O2 (1)
According to above equation, it can be concluded that inorganic nitrogen and phosphorus are the major control factors for the propagation of algae, especially phosphorus. Catastrophic losses in seagrass meadows and aquatic ecosystem are occurred, especially in flushed estuaries like Johor Bahru estuary, coastal embayment and lagoons where nutrient loads are both large and frequent.
Water eutrophication is mainly caused by excessive loading of nutrients into water bodies like N and P. Excessive nutrients come from both point pollution such as waste water from industry and municipal sewage, and non-point pollution like irrigation water, surface run water containing fertilizer from farmland, etc. Increased nutrient load to water body is now recognized as a major threat to the structure and functions of near shore coastal ecosystems, and severe eutrophication problems associated with harmful algal bloom is a major manifestation. Although related to nutrient enrichment in general, the basic cause of water eutrophication is more connected to an imbalance in the load of nitrogen and phosphorus with respect to silica (Dauvin et al., 2007). The influencing factors of water eutrophication include: (1) excessive N and P, (2) slow current velocity, (3) adequate temperature and favourable other environmental factors, and (4) microbial activity and biodiversity (Li and Liao, 2002). Water eutrophication may occur rapidly when all of these conditions are favourable.
4. CONCLUSIONS
In this investigation, the landscape and geomorphological features of the Malaysian bays were constructed from the Phased Array type L-band Synthetic Aperture Radar (PALSAR) remote sensing satellite data combined with field observations and surveying. Studying and managing nutrient pollution and eutrophication in tropical coastal environments is a major and immediate challenge for marine ecology in Malaysian bays. Future nutrient pollution and coastal marine eutrophication will vary greatly in different parts of the world, with the greatest increases in Asia. As in the past, nutrient pollution will follow economic expansion and population growth. Southeast Asia is the most threatened, with over 80% at risk, mainly from coastal development and overfishing. Water eutrophication can be greatly accelerated by human activities that increase the rate of nutrient input in a water body, due to rapid urbanization, industrialization and intensifying agricultural production. Kuala Lumpur and Johor Bahru estuaries are a river-dominated estuary with Barrier Island and lagoon, which is a low ocean-influenced system. Pahang estuary is an ocean-ocean-influenced system with open water circulation. Results of this investigation indicate that the many Algal blooms are caused by a major
influx of nutrient rich runoff into a water body in Malaysian bays, programs to treat wastewater, reduce the overuse of fertilizers in agriculture and reducing the bulk flow of runoff can be effective for reducing severe algal blooms at river mouths, estuaries, and the ocean directly in front of the river's mouth.
ACKNOWLEDGEMENTS
This study was conducted as a part of TRGS grant (vote no: R.J130000.7827.4L849), Ministry of Higher Education (MOHE) Malaysia. We are thankful to the Universiti Teknologi Malaysia for providing the facilities for this investigation.
REFERENCES
Anderson, D. M., P. M. Gilbert, and J. M. Burkholder. 2002. “Harmful Algal Blooms and Eutrophication: Nutrient Sources, Composition, and Consequences.” Estuaries25 (4b): 704–726. Andersen, J.H., Conley, D.J., Hedal, S., 2004. Palaeoecology, reference conditions and classification of ecological status: The EU Water Framework Directive in practice. Marine Pollution Bulletin, 49(4), 283-290.
Dauvin, J.C., Ruellet, T., Desroy, N., Janson, A.L., 2007. The ecological quality status of the Bay of Seine and the Seine estuary: Use of biotic indices. Marine Pollution Bulletin, 55(1-6):241-257.
Li, J.X., Liao, W.G., 2002. Discussion on the synthetic adjustive guidelines for the prevention and cure of eutrophication. Protection of Water Resource, 2(5):4-5.
Lu, S., and I. J. Hodgkiss. 2004. “Harmful algal bloom causative collected from Hong Kong waters.” Hydrobiologia.512 (1-3), 231-238.
Wang, S., Tang, D., He, F., Fukuyo, YA., Azanza, R.V., 2008. Occurrence of harmful algal blooms (HABs) associated with ocean environments in the South China Sea. Hydrobiologia 596, 79-93.
Khan, F.A., Ansari, A.A., 2005. Eutrophication: An ecological vision. The Botanical Review, 71(4):449-482.
Lee, J.S., and Jurkevich, I. (1994). Speckle filtering of synthetic aperture radar images: a review. Remote Sensing Review. Vol: 8, pp:313-340.
Liu, D., Keesing, J.K., Wang, Z., Shi, Y., Wang, Y., 2013. The world’s largest macroalgal bloom in Yellow Sea, China: formation and implications. Estuarine, Coastal and Shelf Science 129, 2-10.
Pour, B. A. and Hashim, M. 2011a. Application of Spaceborne Thermal Emission and Reflection Radiometer (ASTER) data in geological mapping. International Journal of the Physical Sciences, 6(33), 7657-7668.
segment of the Central Iranian Volcanic Belt, Iran. International Journal of the Physical Sciences, 6(33), 7638-7650.
Pour, A.B., Hashim, M., 2014. Structural geology mapping using PALSAR data in the Bau gold mining district, Sarawak, Malaysia, Adv. Space Research, vol.54 (4), pp. 644-654, Pour, A.B., Hashim, M., 2015a. Structural mapping using PALSAR data in the Central Gold Belt Peninsular Malaysia, Ore Geology Reviews, vol.64, pp. 13-22.
Pour, B.A., Hashim, M., 2015b. Integrating PALSAR and ASTER data for mineral deposits exploration in tropical environments: a case study from Central Belt, Peninsular Malaysia. International Journal of Image and Data Fusion, 6 (2), 170-188.
Schowengert, R.A.m, 2007. Remote sensing: models and
methods for image processing,” 3rd ed, Burlington, M.A,
Academic Press, Elsevier. pp. 229-243.
Sheng, Y., and Xia, Z.G. (1996). A comprehensive evaluation of filters for radar speckle suppression. Geoscience and Remote Sensing Symposium, IGARSS.96, Remote sensing for sustainable future.vol: 3, p: 1559-1561.
Siswanto, E., Ishizaka, j., Tripathy, S.C., Miyamura, K. (2013). Detection of harmful algal blooms of Karenia mikimotoi using MODIS measurements: A case study of Seto-Inland Sea, Japan. Remote Sensing of Environment 129, 185– 196.