AUGUSTO’S SUNDIAL: IMAGE
-BASED MODELING FOR REVERSE ENGENEERING
PURPOSES
V. Baiocchi a, M. Barbarella b, S. Del Pizzo c, F. Giannone d, S. Troisi c, C. Piccaro a, D. Marcantonio e
a
Sapienza University of Rome, DICEA, Via Eudossiana 18, 00184 Rome (Italy) - [email protected] b
University of Bologna, DICAM, Viale Risorgimento 2, 40136 Bologna (Italy) - [email protected] c
Parthenope University of Naples, Centro Direzionale Isola C4, Naples, Italy - (silvio.delpizzo, salvatore.troisi,)@uniparthenope.it Niccolò Cusano University Via Don Carlo Gnocchi 3, 00166 Rome (Italy) - [email protected]
e Spektra S.r.l.- a Timble Company Via Pellizzari 23/A, 20871 Vimercate (MB), Italy - [email protected]
Commission II
KEY WORDS: Photogrammetry, Cultural Heritage, 3D modeling, Horologium Augusti, Campo Marzio, Rome
A photogrammetric survey of a unique archaeological site is reported in this paper. The survey was performed using both a panoramic image-based solution and by classical procedure. The panoramic image-based solution was carried out employing a commercial solution: the Trimble V10 Imaging Rover (IR). Such instrument is an integrated cameras system that captures 360 degrees digital panoramas, composed of 12 images, with a single push. The direct comparison of the point clouds obtained with traditional photogrammetric procedure and V10 stations, using the same GCP coordinates has been carried out in Cloud Compare, open source software that can provide the comparison between two point clouds supplied by all the main statistical data.
The site is a portion of the dial plate of the “Horologium Augusti” inaugurated in 9 B.C.E. in the area of Campo Marzio and still present intact in the same position, in a cellar of a building in Rome, around 7 meter below the present ground level.
1. INTRODUCTION
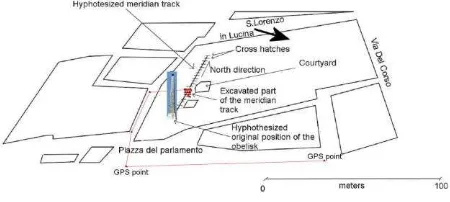
In 46 B.C. Julius Caesar reformed the Roman calendar establishing the Julian calendar and a leap year that occurred every three years. About forty years later, probably due to an error of interpretation in considering a leap year every three year instead of four, the calendar was again misaligned with the actual length of the year. For this reason, Emperor Augusto changed again introducing a leap year every four years, furthermore, in order to reduce the collected calendar gap, he interrupted the leap year usage for a period. In the same period, he ordered to build a scientific instrument, probably to validate the new version of the calendar. Therefore, a sundial was designed with the purpose to correctly measure the length of the year and to indicate the date; the sundial was inaugurated in 9 B.C.E. in the area of Campo Marzio that, in those days, was a large square on the Tevere river bank. Presently a debate on this instrument is ongoing and it has centred on the very function of the Horologium, in particular whether it was a true functioning solar clock or simply a sundial. Obviously to function as clock a wide network of lines on the square pavement, spanning from east to west, had to be present. If, on the other hand, it worked only as a sundial showing the length of the year and the day of the calendar, only a reference line from south to north was needed (Fig. 1).
Basically a sundial is an ancient instrument employed to measure the time, the working principle is based on the relative movement of the sun respect to the earth. A classical sundial is composed by two fundamental parts: the gnomon and the dial plate where the former casts its own shadow. The Egyptian obelisk, built by pharaoh Psammetico II (VI century B.C) about 30 meters high, was the gnomon of the “Horologium Augusti”. The same obelisk is presently located in “Piazza Montecitorio”, close to the original position. The dial plate was built using
several slabs of white marble, on which both a meridian line and the trace of date lines are marked out using bronze strips. Furthermore, the dial plane is marked by a set of bronze Greek letters, that specify the corresponding day of the year for specific datelines (Fig. 2).
Figure 1. Approximate position of the “Horologium”: present ground level is approximately 6 meters higher than Augustus age ground (From Baiocchi et al. 2016, updated and modified)
Throughout the ages, the dial plane probably has been hidden by sediment left by the floods of Tevere river. On the other hand, the obelisk collapsed probably between the 9th and 10th centuries; the disaster causes are not certain yet: the most credible hypothesis include an earthquake or fire, otherwise a war. In 16th century, several pieces of the obelisk have been found but only in 18th century, they have been reassembled, into the present position, in front of “Palazzo Montecitorio”. Parts of the pavement have been found during excavations in the area in the following centuries. In particular one of the first historic evidence date back to 1484 when excavating under the church of San Lorenzo in Lucina, which position is shown by
the arrow in fig.1, some bronze signs representing the winds were found. Later, around 1876, other evidences of “celestial signs” found under the same area are reported (Del Lungo, 2017). But it’s only during the excavation begun in 1979, that an intact portion of dial plate was discovered. This portion is in its original position that presently correspond to a cellar of a building located in “Via Campo Marzio”, seven meters underneath the present street level. The dial plate was found under a layer of “cocciopesto” that is a flooring material made of a compound based on hydraulic lime and crushed bricks. Probably the “cocciopesto” layer belongs to a later use of the monument as fountain or drinking trough and maybe this covering helped to preserve almost perfectly the original pavement (Fig.2). Instead of complete sundial plate, there was found only a portion of the meridian line, but on this part ticks presumably relative to different days are clearly visible and a wider tick in the middle, almost surely represents the passages between following zodiac constellations, suggesting the relative period of the year.
Figure 2. Part of the pavement of the meridian line located in “Via Campo Marzio”
The main aim of this work is to realize an accurate 3d modeling of the discovered meridian line (figure 2 and figure 6), in order to carry out all possible measurement to determine the shape of the meridian itself and the original position of the obelisk. Two kinds of survey were integrated: the photogrammetric and the topographic one. The latter was employed to geo-locate the photogrammetric model provided by the former methodology.
2. SURVEYS
The photogrammetric survey was performed using both a panoramic image-based solution and by classical procedure. The first one was performed using several panoramic images. This former methodology was carried out employing a commercial solution: the Trimble V10 Imaging Rover (IR), based on the Trimble VISION™ technology. Such instrument is an integrated cameras system that captures 360 degrees digital panoramas with a single push. The IR is composed of 12 calibrated cameras that can operate simultaneously, arranged on two horizontal planes whose 7 upper-level cameras provide a
360° panoramic view, while the 5 lower cameras are pointed 5° downward and provide a 200° field of vision that avoids shooting the operator during the acquisition of the data (Trimble, 2017a) (Figure 3).
The multi-camera system, in addition to capturing panoramic images, also acquires the position of the centre of the instrument with a double-frequency GNSS receiver for outdoor shoots.
In our case, it was impossible to use GNSS receivers in the cellar so on the same centre of the instrument a prism was mounted and a Total Station survey for every visible station was performed.
The survey guidelines specified by the manufacturer only specify that a ratio of 4:1 has to be observed which is to say a base line of 1 meter between each station for every 4 meters of distance from the object to survey. As an example if we are surveying an object from 40 meters of distance, we have to make stations every ten meters each other. These guidelines were considered during the present survey.
The core of Trimble V10 is composed by a tablet controller and by a housing equipped with the mentioned 12 calibrated cameras (calibration includes optical distortion, interior orientation and external one as well), that provide complete site documentation suitable to make photogrammetric measurements. The controller is able to control both the camera systems and the GNSS receiver. Therefore, such instrument is able to capture a 60 MegaPixel panorama image, geo-located through GNSS or total station observations. Most of times, the system works when the housing (therefore the antenna and the prism as well) is placed vertically, for this reason the housing is mounted on a specific topographic rod equipped with a tilt sensor.
Figure 3. On the left the fields of view of the system, in yellow those relative to the upper-level cameras, that hold all 360°, in blue the 5 lower cameras that provide a 200° field of vision; on the right the Trimble V10 Imaging Rover equipped with a with a 360 degrees prism.
The survey with the Trimble V10 system was planned in order to cover the entire job site assuring high redundancy, indeed eleven stations were performed by placing the head of the instrument on a graduated rod (Fig. 4), but just four of them have been positioned by using a total station.
The adjusting procedure based on automatic photogrammetric tools, implemented in Trimble Business Center (TBC version 3.81), was carried out using several targets marked as manual tie-points and some distances manually measured among target as constrain in order to contain the deformations model. The bundle adjustment process, with 454 equation and 165 unknowns, produced a correction of the station coordinates of
small quantities but in a case where it reached 33 mm; such corrections are reported in Table 1.
The obtained RMS (Root Mean Square) re-projection error for automatic Tie point was of 0.6 pixel, while the maximum re-projection error of 2.69 pixel.
Figure 4. Trimble V10 Imaging Rover equipped with a 360 degrees prism on a topographic rod
ID Station
Correction of V10 coordinate stations in meters
East North Up
1 0,002 -0,010 0,006
2 0,006 0,001 0,008
3 -0,019 -0,018 -0,020
4 0,008 0,021 0,007
Table 1. Correction of the Trimble V10 station coordinates resulting from TBC Bundle Adjustment
The procedure of image matching produced a dense point cloud of almost 39 million point represented in figure 6 (a).
The traditional photogrammetric procedure was carried out to check results obtained by the previous one. A full frame calibrated camera (NIKON D800E) equipped with a lens of 20 mm nominal focal length was employed (figure 5). The camera was calibrated using a specific test-field prepared with circular coded targets. The calibration procedure was realized ad-hoc for this project, by locking the focal length to a calibrated value during the survey operations. The photogrammetric model, was scaled using a 800 mm (± 0.05 mm) calibrated scale bar, located on the scene during the survey. The mean obtained GSD (Ground Sample Distance) is 0.3 mm/pixel. The final project is composed by 161 images all correctly oriented using the software PIX4D version 3.1.18 obtaining a RMS re-projection error of 0.16 pixel, while the maximum re-re-projection error is 1.09 pixel. The scale-bar allows to scaling the survey,
but it does not provide every check about potential deformation of the photogrammetric model; in order to contain such deformations and to geo-locate the 3D model four GCPs (Ground Control Points) and two CP (Check Point) were measured and added on the processing. The maximum error on GCP and CP has been 4 mm and 12 mm respectively. Once the photogrammetric model was correctly scaled and referred, the image matching procedure was performed obtaining a dense cloud point of around 8-million points reported in figure 6 (b).
Figure 5. NIKON D800E used for the classical photogrammetric survey
(http://www.kenrockwell.com/nikon/d800.htm)
(a)
(b)
Figure 6. Dense Point clouds: (a) V10, (b) classical photogrammetry
At the beginning, all Ground control points coordinates employed in both photogrammetric surveys were expressed in a local reference system. At later time the total station survey has been aligned to ETRF 2000-RDN reference system, by means This should be our case because the GCP coordinates used for traditional photogrammetric procedure and V10 stations initial coordinates have been determined by the same total station survey.
All procedures concerning the comparison of the two models were carried out in Cloud Compare, open source software that can provide all the statistical data needed for an analysis of the characteristics of three-dimensional models, both in the case of surfaces and point clouds.
In particular the tool M3C2 (Barnhart, et al, 2013), allows the direct comparison of two point cloud by mean the determination of the normal in the core points (Troisi, et al, 2015). In our case the photogrammetric model was chosen as a reference, the M3C2 algorithm has provided the deviation of the points of the V10 model in the direction of the barycenter of the entire point cloud.
No filtering procedure was applied to both the point clouds in order to highlight the effect of the noise in results of dense image matching procedures.
Figure 7 shows the histogram of the point distances, a negative distance has to be intended that the inspected point is positioned in the opposite direction of the barycenter compared to the nearest point of reference point could.
The distribution is not Gaussian and the median value is 6 mm; this leads to suspect the existence of a systematic deviation between the two point clouds.
Figure 7. Histogram of distance (m) between the points of the two models obtained by M3C2 tool
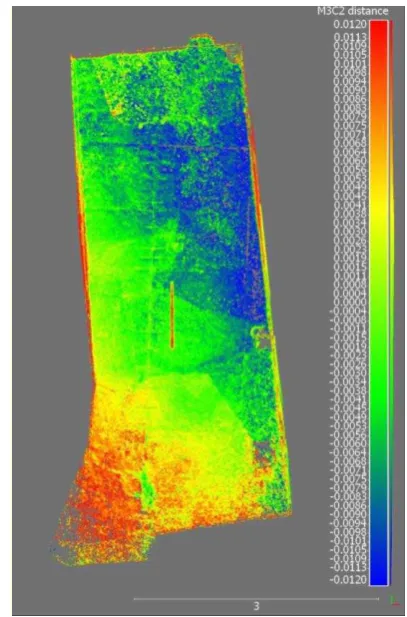
Furthermore, by a suitable choice of the colour scale another trend can be highlighted.
In figure 8 we can note that the North-East part of the floor point cloud obtained by Trimble V10 is more raised than the analogous one determined by the classical photogrammetry, instead the opposite behaviour can be detected in its southwestern; there is, probably, a roto-translation between the two point clouds.
Such hypothesis is confirmed by both the direction of the normal to the fitting plane obtained by the part of the point
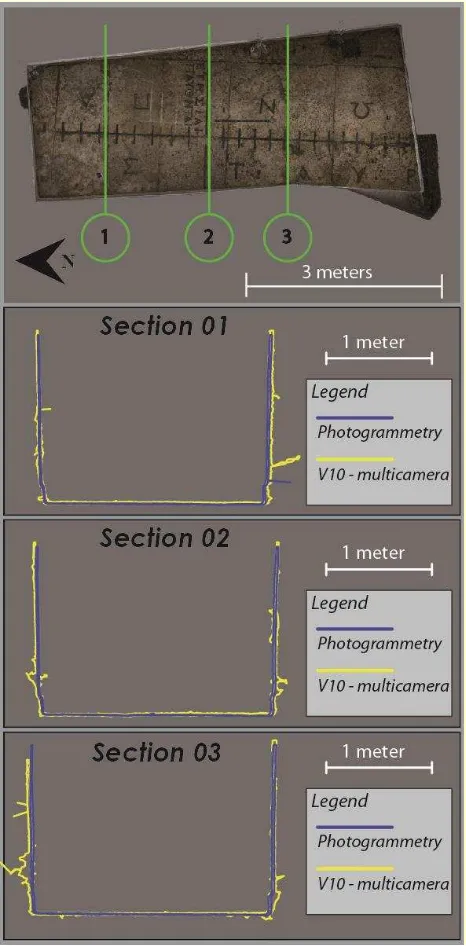
cloud relative to the floor and by the section lines performed on the two point clouds (figure 9).
In fact, the inspection of the sections in figure 9, shows that the left part of the yellow sections, concerning the V10 point cloud, appear external with respect to the blue ones, that are relative to the photogrammetric point cloud.
Table 2 shows the RMS in meter of the two fitting planes and the direction cosines of the normal unit vector.
RMS (m) Normal Component Table 2. Statistical of the floor fitting plane
The cause for the different orientation and scale of the V10 model should be sought in the result of Bundle Adjustment procedure implemented in Trimble Business Center software. While the coordinates of the V10 stations undergo a change that in some cases reaches 30 mm compared to the initial coordinates, the maximum change in the GCP coordinates of classical photogrammetric bundle was limited to only 4 mm. Consequently, the V10 3D model changes orientation (and scale) more evidently than the classical one.
Figure 8. Colour map of the distance (m) between the models on the floor
The coordinates of three points located on the meridian were determined by the measurements carried out by the total station, their coordinates have been picked also on the two models.
In the first column of Table 3 the local coordinates obtained by total station are reported, in the other two their change in mm on the respective 3D Model. The last row shows the Local azimuthal angle of the meridian line that can be determined on the models. Local azimuthal angle 25° 35’.493 25°40’.031
Table 3. Local coordinates expressed in meters and their variation in mm
The misalignment of the meridian line on the V10 3D model therefore amounts to nearly five minutes of arc.
The analysis of RMS of the floor fitting plane in table 2, and of the sections in figure 9 shows also the presence of a higher noise for the V10 3D model.
Since it has been confirmed that there is a mismatch between the two models it is necessary to carry out a fine registration of V10 point cloud taking as reference the photogrammetric one. Cloud Compare allows the alignment of two point clouds by a manual point pairs picking of homologous points in each cloud in order to register them but, in our case, this procedure is not very efficient because the misalignment is very small and a wrong choice of the homologous points could provide an incorrect alignment. A more efficient alignment can be obtained by means of the tool Fine registration that implement the well-known Iterative Closest Point (ICP) algorithm (Besl & McKay, 1992). The algorithm iteratively revises the 7 parameters transformation (three translations, three rotations and a scale factor) needed to minimize the distance between sample points of the target model from the closest of the reference.
The application of this procedure for our two models generated a final RMS of 3 mm computed on a sample of 3800000 points chosen to minimize the above-said distances. The removal of farthest point was activated, this allows to obtain a reliable result even when the noise on one entity is high, as in our case. The scale factor of the transformation is equal to 0.989, which confirms the suspicion suggested by previous analysis of sections of figure 9.
The comparison between the two registered model can now be performed using the procedure M3C2 previously described. Figure 10 shows the histogram of the point distances, it can be noted that the distribution is almost Gaussian with mean and median equal to zero.
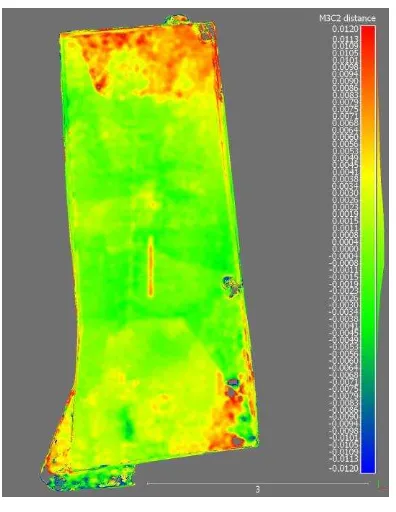
In figure 11 the colour map of the distances between the two models shows well overlap on the floor; the same can also be said for the two long side walls reported in figure 12.
A detail can be noted in figure 11, the calibrated scale bar used as constrain during the photogrammetric survey appears as a red segment at the center of the floor, in fact this bar was used only for the photogrammetric survey and was removed during that one carried out with the V10 system.
Figure 9. Sections of the two models, the yellow for the V10 model, the blue for photogrammetry
Figure 10. Histogram of distance (m) between the points of the two models obtained by M3C2 tool after ICP registration
Figure 11. Colour map of the distance (m) between the models on the floor
Figure 12. Colour map of the distance (m) between the models on the two long side walls
Finally from the 3D model more a very useful product can be obtained, such as the orthophoto on which is possible perform measures that allow the determination of the location and height of the obelisk gnomon. Of course it is essential to integrate these measures with the astronomical information necessary to provide the coordinates of the sun when it crosses the local meridian in the days corresponding to the ticks on the meridian line. The orthophoto shown in figure 2 was obtained using the photogrammetric 3D model.
4. CONCLUSION
The results achieved from the comparison between Trimble V10 model and the photogrammetric one reveal that also in a severe environment, like a cellar of a building, the multi-camera system can be usefully employed.
Both methodologies were inspected and compared: Trimble V10 allows to obtain a result minimizing the effort and reducing number of acquisition (11 against 161); on the other hand the classical photogrammetric survey is more flexible and the model is less noisy.
ACKNOWLEDGEMENTS
Authors want to thanks Dr. Marta Baumgarten of “Soprintendenza Speciale per il Colosseo, il MNR e l’Area Archeologica di Roma” for her support to the survey.
Furthermore, authors want to thanks CGT s.r.l. company for the kind availability of V10 imaging rover.
This work was partially financed by a grant in the framework of the MIUR (Ministry Instruction, University and Ressearch) PRIN project n. 20107XJHCC_004 “Tecniche geomatiche innovative ed emergenti di rilievo, telerilevamento (da aereo, satellite, uav) e webgis per la mappatura del rischio in tempo reale e la prevenzione del danno ambientale”, coordinated by Professor Raffaele Santamaria of “Parthenope” University, Naples, Italy.
REFERENCES
Ackermann, S., Angrisano, A., Del Pizzo, S., Gaglione, S., Gioia, C., Troisi, S., 2014: Digital surface models for GNSS mission planning in critical environments. Journal of Surveying Engineering Volume 140, Issue 2, 2014, DOI: 10.1061/(ASCE)SU.1943-5428.0000119
Albèri Auber, P., 2014: Reconstructing Augustus’ Montecitorio obelisk: a gnomonist’s point of view. In: Haselberger L (ed), The Horologium of Augustus: debate and context, “JRA” supplementary series number 99, Portsmouth U.S.A.
Baiocchi, V., Barbarella, M., D’Alessio, M.T., Lelo, K., Troisi, S., 2016: The sundial of Augustus and its survey: unresolved issues and possible solutions. Acta Geodaetica et Geophysica 51 (3), pp. 527-540 DOI: 10.1007/s40328-015-0142-4
Barnhart, T.B., Crosby, B.T., 2013: Comparing two methods of surface change detection on an evolving thermokarst using high-temporal-frequency terrestrial laser scanning. Selawik River, Alaska. Remote Sensing, Volume 5, Issue 6, June 2013, pp.2813-2837; DOI:10.3390/rs5062813
Besl, Paul J.; N.D. McKay, 1992: A Method for Registration of 3-D Shapes. IEEE Trans. on Pattern Analysis and Machine Intelligence Los Alamitos, CA, USA: IEEE Computer Society 14 (2): 239–256. doi:10.1109/34.121791.
Del Lungo S., 2017: Topografia di Roma e dell'Italia antica,
l'orologio di Augusto (Regio IX),
http://www.bta.it/txt/a0/00/bta00035.txt, last seen on line 18/01/17 (original edition of 1994)
Trimble, 2017a: V10 reference guide.
http://www.trimble.com/Survey/Trimble-V10-Imaging-Rover.aspx , last seen online January 18th 2017
Trimble, 2017b: TBC reference guide.
http://www.trimble.com/Survey/trimble-business-center.aspx
Troisi, S., Del Pizzo, S., Gaglione, S., Miccio, A., Testa, R.L., 2015: 3D models comparison of complex shell in underwater and dry environments. International Archives of the Photogrammetry, Remote Sensing and Spatial Information Sciences - ISPRS Archives, 40 (5W5), pp. 215-222; DOI: 10.5194/isprsarchives-XL-5-W5-215-2015.