MODELLING BIOPHYSICAL PARAMETERS OF MAIZE
USING LANDSAT 8 TIME SERIES
Commission II, WG II/3
KEY WORDS: variable importance, random forests, conditional inference trees, biophysical parameters, maize ABSTRACT:
Open and free access to multi-frequent high-resolution data (e.g. Sentinel – 2) will fortify agricultural applications based on satellite data. The temporal and spatial resolution of these remote sensing datasets directly affects the applicability of remote sensing methods, for instance a robust retrieving of biophysical parameters over the entire growing season with very high geometric resolution.
In this study we use machine learning methods to predict biophysical parameters, namely the fraction of absorbed photosynthetic radiation (FPAR), the leaf area index (LAI) and the chlorophyll content, from high resolution remote sensing. 30 Landsat 8 OLI scenes were available in our study region in Mecklenburg-Western Pomerania, Germany. In-situ data were weekly to bi-weekly collected on 18 maize plots throughout the summer season 2015.
The study aims at an optimized prediction of biophysical parameters and the identification of the best explaining spectral bands and vegetation indices. For this purpose, we used the entire in-situ dataset from 24.03.2015 to 15.10.2015. Random forest and conditional inference forests were used because of their explicit strong exploratory and predictive character. Variable importance measures allowed for analysing the relation between the biophysical parameters with respect to the spectral response, and the performance of the two approaches over the plant stock evolvement.
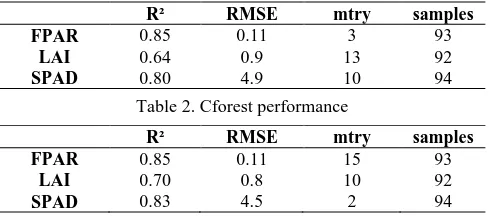
Classical random forest regression outreached the performance of conditional inference forests, in particular when modelling the biophysical parameters over the entire growing period. For example, modelling biophysical parameters of maize for the entire vegetation period using random forests yielded: FPAR: R² = 0.85; RMSE = 0.11; LAI: R² = 0.64; RMSE = 0.9 and chlorophyll content (SPAD): R² = 0.80; RMSE=4.9.
Our results demonstrate the great potential in using machine-learning methods for the interpretation of long-term multi-frequent remote sensing datasets to model biophysical parameters.
1. INTRODUCTION
Agricultural applications using remote sensing data and methods will be fortified by the increase of high-resolution multifrequent remote satellite data. New satellite constellations like the Sentinels will increasingly allow in combination with other systems for high frequent high-resolution observations of the crop lifecycle.
Applications of remote sensing mainly focus on the biophysical reality of the crop expressed by crop specific biophysical parameters such as the leaf area index (LAI), fraction of absorbed photosynthetically active radiation (FPAR), or chlorophyll content. One appropriate method that demands reduced amounts of auxiliary data (such as climate or soil data) is to directly derive statistical relationships between the respective biophysical parameter observed in the field and the reflectance signal measured by the sensor of the satellite (Bronge, 2004)
Often, univariate statistics are applied to one spectral index, e.g. the NDVI, to create maps of crop biophysical parameters (Fritsch et al. 2012). Such linking of one spectral index with one biophysical parameter implies a direct and permanent relationship between the biophysical reality and the reflectance values (Myneni and Williams, 1994). But the plants change their height, mass and shape, which alters their perception through remotely sensed data as well. For instance, Lex et al. (2015) or Vina et al. (2011) demonstrated that such simple crop-specific statistical relations may vary during a cropping season (Koppe et al. 2012). Comparisons of univariate statistical models revealed that some vegetation indices outreach others in model performance. Such thoughts also
guided the study by Tillack et al. (2014) who modelled biophysical parameters for different phenological stages using multivariate statistics that included several vegetation Verrelst et al. (2012) applied machine learning methods to the entire spectra of remote sensing information and underlined their great potential in combination with high resolution remote sensing data. However, despite this promising property of machine learning algorithms such as random forest, systematic applications and comparison of machine learning methods for deriving biophysical parameters in agriculture using high resolution remote sensing data are still rare.
The aim of this study is to compare two machine learning methods, namely the traditional random forest (rforest) and the conditional inference forest (cforest) for modelling biophysical parameters of maize in terms of prediction accuracy and variable importance. This comparison is done for the complete phenological lifecycle of maize using the Landsat 8 OLI. The analysis is done completely in R and is based on field observation data gathered on maize fields within the test and calibration site DEMMIN in Northeast-Germany. During an extensive field survey in 2015, FPAR, LAI, and chlorophyll content were measured on a weekly basis throughout the growing season of maize.
2. STUDY SITE 2.1 DEMMIN
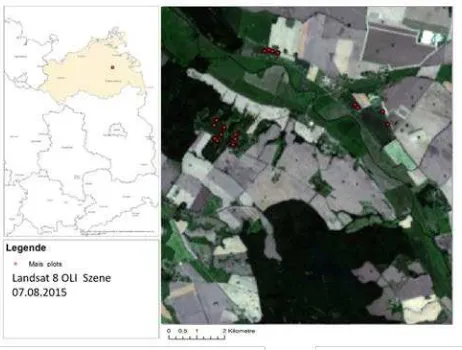
The study area was located near the city Demmin in Western-Pomerania (Mecklenburg), Northeast-Germany. (Figure 1). Glaciers and melting waters formed the landscape during
Thorsten Dahms 1, Sylvia Seissiger 1, Christopher Conrad 1, Erik Borg 2 1 University of Wuerzburg, Germany
Weichsel glaciation (approximately 10.000 years ago). The climate zone can be described as moderate, with an average annual temperature of 8–8.5 °C and an average annual rainfall of 550–600 mm (Borg et al. 2009).
Figure 1: Study site and location of ESUs on maize fields
The investigated fields were within the test site DEMMIN (Durable Environ-mental Multidisciplinary Monitoring In-formation Network), one of four test areas of the TERENO NE Lowland observatory (http://demminweb.dlr.de/). The test site is an intensively used agricultural ecosystem dominated by extensive fields (80 ha) where mainly wheat and maize are cultivated. The northern part of the study area is characterized by low topographical variations between 5 - 84.5 m a.s.l.. The south can be described as hilly to undulating. Due to significant differences in parent substrate material and topography, soils are primarily loamy sands and sandy loams alternating with pure sand patches or clayey areas (Gerighausen et al. 2007).
(http://teodoor.icg.kfa-juelich.de/observatories- de/norddeutsches-tiefland-observatorium/german-lowland-observatory-de).
3. DATA AND METHODS 3.1 Remote Sensing Data and prepossessing
The Landsat legacy dates back to 1965. Landsat 8 OLI is the latest optical sensor of this series deployed in orbit. The sensor has a revisit time of 16 days and a spatial resolution of 30m. The spectral bands used in this study are: Costal (C) (0,43-0,45 µm), Blue (B) (0,45-0,51 µm), Green (G) (0,53-0,59 µm), Red (R) (0,64-0,67 µm), near infrared (NIR) (0,85-0,88 µm), wave infrared (SWIR 1) (1,57-1,65 µm) and the second short-wave infrared band (SWIR 2) (2,11-2,29 µm).
The Landsat 8 OLI data was atmospherically corrected using ATCOR2 (Richter et al., 2012). In an additional step, all cloud affected areas were excluded using the cloud masks calculated in ATOCR.
Index or
band name Spectra
Name in the ensemble
Costal 0.43 – 0.45µm Band 1
Blue 0.45-0.51 µm Band 2
Green 0.53-0.59 µm Band 3
Red 0.64-0.67 µm Band 4
near infrared
(NIR)
0.85-0.88 µm Band 5
short-wave infrared
(swir1)
1.57-1.65 µm Band 6
short-wave infrared
(swir2)
2.11-2.29 µm Band 7
Index Formula Reference
Brightness
0.3029*blue+0.2786*green+0.47 33*red+0.5599*NIR+0.508*swir
1+swir2*0.1872
Liu et al. 2014 Greenness
0.2941*blue+0.243*green+0.542 4*red+0.7276*NIR+0.0713*swir
1+swir2*0.1608
Wetness
0.1511*blue+0.1973*green+0.32 83*red+0.3407*NIR+0.7117*swi
r1+swir2*0.4559
TCT_4
0.8239*blue+0.0849*green+0.43 96*red+0.058*NIR+0.2013*swir
1+swir2*0.2773
TCT_5
0.3294*blue+0.0557*green+0.10 56*red+0.1855*NIR+0.4349*swi
r1+swir2*0.8085
TCT_6
0.1079*blue+0.9023*green+0.41 19*red+0.0575*NIR+0.0259*swi
r1+swir2*0.0252
SR NIR/red Jordan, (1969),
NDVI (NIR-Red)/(NIR+Red) Rouse et al. (1974)
SAVI
(1+0.5)*(NIR-Red)/(NIR+Red+0.5) Huete (1988)
RDVI NIR-red/sqrt(NIR+Red) Roujean (1995)
EVI
2.5*((NIR-Red)/(1+NIR+6*Red-7.5*Blue)) Huete et al. (2002)
Table 1: spectral bands and indices
3.2 In-situ-data description
Field observations of three biophysical parameters, LAI, FPAR, and chlorophyll content (expressed by SPAD measurements) were taken in the study region every week to bi weekly. FPAR and LAI were recorded using a SunScan instrument (Delta-T Devies Ltd., Cambridge, England) and the SPAD values were measured with a handheld chlorophyll meter (SPAD-502, Minola Osaka Company, Ltd., Osaka, Japan).
3.3 Linking in situ data with remote sensing data
The maximal temporal offset between the field observations and the day of acquisition of the remote sensing data amounted four days. The spectral data was averaged inside a 20m buffer around the ESU centre. The averaged spectral information was used to calculate the vegetation indices.
Several vegetation indices were calculated from Landsat data comprising simple ratio (SR), NDVI, SAVI, RDVI and EVI. The tasselled cap transformation indices which allow for monitoring greenness, brightness, and wetness, and which are another important source of information for remote sensing applications in agriculture (Liu et al. 2014), were also included in the analysis.
3.4 Random Forest
Machine learning applications have resided a lot of attention in the last decades. These approaches can handle nonlinear statistical relations and complex interactions between variables and have been successful applied for vegetation monitoring (Bekenschäfer et al. 2014). Moreover, they have the ability to identify variables that are most important for explaining the predicted variable (Van der Laan, 2006).
The random forest technique initially introduced by Breiman (2001) belongs to these kind of algorithm and is subject of this study. This initial formulation of the random forest in the following referred to as ‘rforest’ has a strong prediction power. The conditional random forest (‘cforest’) introduced by Strobl et al. (2008) is based on the same technology but includes elements that can better deal with highly correlated predictors and that are supposed to strengthen the analytical and explorative character of the algorithm. Both algorithms consist of ensembles of recursive partitioning and regression trees (RPART) which only differ in the way they search for features and threshold values for optimally analysing a set of training data. In the rforest and cforest approaches, RPARTS are implemented according to Breiman et al. (1984) and Strobl et al. (2008), respectively.
The ensemble of tress, e.g. the selection of variables for tree construction, can subsequently be analysed using so-called variable importance algorithms. Irrespectively of the type of random forest main approaches investigate the reduction of accuracy of the random forest when randomly modifying each variable (Ishwaran et al. 2007, Strobl et al. 2007, 2008).
In this study, the R software (Liaw & Wiener, 2002) was used for implementing both approaches. The rforest of the R package ‘h performance of one model and on the variable importance (Díaz-Uriarte & Alvarez de Andrés 2006). With mtry = 1, the splitting variable would be completely random and mtry = p would exclude the randomness from the random forest model.
Using the caret package 10 different mtry values were tested (2,3,5,7,9,10,12,14,16,18 with p=18) for the Landsat 8 OLI band index ensemble. The metric for comparing and assessing the performance of cforest and rforest was the coefficient of determination (R²). This way ensured finding the best tuning parameter for the model and so for the prediction of the biophysical parameters.
The variable importance assessments were applied to the optimal performing model only, determined by caret. This procedure was repeated 100 times for all datasets. The distribution of the variable importance shows on the one hand the importance of an index or band for predicting a biophysical
parameter and on the other hand the stability of its selection over 100 model runs
4. RESULTS AND DISCUSSION 4.1 Prediction accuracy
Due to the relative small dataset and the problem of geo and temporal correlation effects, this study used a 10 times repeated five-fold cross validation to determine the performance of the respective random forests. Each model was tuned to yield the highest coefficient of determination value (R²) by altering the mtry parameter. The performance results were averaged over 100 runs. The root mean square error (RMSE) was derived as second quality information
The rforest slightly outperforms the cforest models in terms of prediction accuracy modelling the LAI and SPAD values (see tables 2 and 3). The FPAR parameter was modelled at equal quality levels (R² = 0.85, RMSE = 0.11).
R² RMSE mtry samples
FPAR 0.85 0.11 3 93
LAI 0.64 0.9 13 92
SPAD 0.80 4.9 10 94
Table 2. Cforest performance
R² RMSE mtry samples
FPAR 0.85 0.11 15 93
LAI 0.70 0.8 10 92
SPAD 0.83 4.5 2 94
Table 3. rforest performance
Wiegand et al. (1990) modelled FPAR of corn and reported a strong relationship between the FPAR and single remote sensing indices (max: R² = 0.95). Gitelson et al. (2014) stated also a strong connection between the maize FPAR and the NDVI (R² = 0.95) which outreaches the performance of this study by far concerning coarse remote sensing data (MODIS). Gao et al modelled LAI on maize fields in 2013 with an R² of 0.69 which is comparable to the performance of the random forest model in this study.
Schlemmer et al. (2013) showed a strong relation between EVI and chlorophyll content (R² = 0.67) and a higher relation with the NDVI (R² = 0.75).
4.2 Variable importance
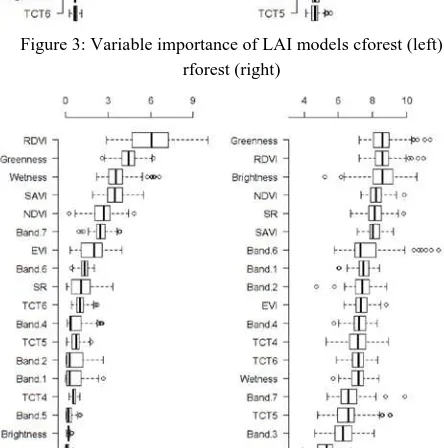
Figure 2: Variable importance of FPAR models cforest (left) rforest (right)
Figure 3: Variable importance of LAI models cforest (left) rforest (right)
Figure 4: Variable importance of SPAD model cforest (left) rforest (right)
For FPAR estimations, both methods (cforest and rforest) exhibited a completely different distribution of variable importance. The variable importance distribution of FPAR indicates EVI to be the most important variable for the cforest, and band 6 (swir1) to be of highest importance when modelling with rforest.
The LAI models show a narrow distribution of the single variable over the 100 runs, for rforest and cforest. Again for the cforest EVI is the most important variable while the boxplot of the rforest model shows the second band (Blue) to be most important.
For modelling the chlorophyll content (SPAD value) both variable importance assessments (cforest and rforest) agree on the important role of greenness and RDVI. Again the variable importance distribution of the cforest is more exact.
The statement of variable importance relates only to the respective band vegetation index set described in table 1. Adding more vegetation indices could change the appearance of the variable importance completely. The same is very likely to be valid for the model accuracy and the tuning parameter. The comparison between the variable importance results of this study and the results of Beckschäfer et al (2014) showed that, there are only few variables necessary to explain biophysical parameters. The selection of these important variables depends on the individual band- index input ensemble.
5. CONCLUSION
The comparison between the two machine learning methods cforest and rforest showed, that the rforest outperforms the cforest in terms of prediction accuracy, whereas the cforest often resulted in a clearer picture of the variable importance distribution. The cforest variable importance boxplots often show a group of indices and bands sated off against the majority of the band index ensemble. The distribution of variables relevant for the generation of the rforests was found to be more homogeneous.
In terms of tuning parameters, the major difference of the two models is the choice of the best tuning parameters mtry.
In the end, machine learning methods seem to perform very well modelling biophysical parameters of maize. Other studies, like Wiegand et al. (1990) and Gitelson et al. (2014) showed even better relationship between biophysical parameters and remote sensing data, but not for Landsat resolution and not for the entire vegetation period. The machine learning models can use the entire ensemble of multispectral information. The presented results relate to the entire vegetation period and include effects like the change of fractional cover and browning of the plant. It is very likely that optimization can be achieved by focusing on different growing stages.
ACKNOWLEDGEMENTS
We express our gratitude to the team of the Calibration and Validation Facility DEMMIN of the German Aerospace Center (DLR) who commonly conducted the field observations throughout the vegetation period accompanied by students of the University of Würzburg.
REFERENCES
Beckschäfer, Philip, et al. "Mapping Leaf Area Index in subtropical upland ecosystems using RapidEye imagery and the randomForest algorithm." iForest-Biogeosciences and Forestry 7.1 (2014): 1.
Borg, E., et al. "DEMMIN–Teststandort zur Kalibrierung und Validierung von Fernerkundungsmissionen." Rebenstorf, RW (Hrsg.) 15 (2009): 16-17.
Breiman, Leo, et al. Classification and regression trees. CRC
press, 1984.
Breiman, Leo. "Random forests." Machine learning 45.1 (2001): 5-32.
Bronge, Laine Boresjö. 2004 Satellite remote sensing for estimating leaf area index, FPAR and primary production.
Report to Swed Power AB, 2004.
Chen, Jing M., and Josef Cihlar. "Retrieving leaf area index of boreal conifer forests using Landsat TM images." Remote
sensing of Environment 55.2 (1996): 153-162.
Conrad, C., et al. "Potenziale des ‘Red Edge’Kanals von RapidEye zur Unterscheidung und zum Monitoring landwirtschaftlicher Anbaufrüchte am Beispiel des usbekischen Bewässerungssystems Khorezm." RapidEye science archive
(RESA). Vom Algorithmus zum Produkt (2012): 203-217.
Díaz-Uriarte, Ramón, and Sara Alvarez De Andres. "Gene selection and classification of microarray data using random forest." BMC bioinformatics 7.1 (2006): 1.
Fritsch, Sebastian, et al. "Validation of the collection 5 MODIS FPAR product in a heterogeneous agricultural landscape in arid Uzbekistan using multitemporal RapidEye imagery."
International journal of remote sensing 33.21 (2012):
6818-6837.
Gao, Shuai, et al. "Estimating the Leaf Area Index, height and biomass of maize using HJ-1 and RADARSAT-2."
International Journal of Applied Earth Observation and Geoinformation 24 (2013): 1-8.
Gerighausen, Heike, et al. "DEMMIN–a test site for the validation of Remote Sensing data products. General description and application during AgriSAR 2006." Proc. on
AGRISAR and EAGLE Campaigns Final Workshop. 2007.
Gitelson, Anatoly A., et al. "Relationships between gross primary production, green LAI, and canopy chlorophyll content in maize: Implications for remote sensing of primary production." Remote Sensing of Environment 144 (2014): 65-72.
Hothorn, Torsten, et al. "Model-Based Boosting." (2015).
Huete, Alfredo R. "A soil-adjusted vegetation index (SAVI)."
Remote sensing of environment 25.3 (1988): 295-309.
Huete, Alfredo, et al. "Overview of the radiometric and biophysical performance of the MODIS vegetation indices."
Remote sensing of environment 83.1 (2002): 195-213.
Ishwaran, Hemant. "Variable importance in binary regression trees and forests." Electronic Journal of Statistics 1 (2007): 519-537.
Koppe, Wolfgang, et al. "Multi-temporal hyperspectral and radar remote sensing for estimating winter wheat biomass in the North China Plain."
Photogrammetrie-Fernerkundung-Geoinformation 2012.3 (2012): 281-298.
Lex, Sylvia, et al. "Comparison of two Statistical Methods for the Derivation of the Fraction of Absorbed Photosynthetic Active Radiation for Cotton."
Photogrammetrie-Fernerkundung-Geoinformation 2015.1 (2015): 55-67.
Liaw, Andy, and Matthew Wiener. "Classification and regression by randomForest." R news 2.3 (2002): 18-22.
Liu, Qingsheng, et al. "A tasseled cap transformation for Landsat 8 OLI TOA reflectance images." Geoscience and Remote Sensing Symposium (IGARSS), 2014 IEEE
International. IEEE, 2014.
Moreno, A., et al. "Assessment of MODIS imagery to track light-use efficiency in a water-limited Mediterranean pine forest." Remote Sensing of Environment 123 (2012): 359-367.
Myneni, R. B., and D. L. Williams. "On the relationship between FAPAR and NDVI." Remote Sensing of Environment 49.3 (1994): 200-211.
Richter, R., and D. Schlapfer. "Atmospheric/topographic correction for airborne imagery: ATCOR-4 User Guide." DLR
IB (2012): 565-02.
Schlemmer, Michael, et al. "Remote estimation of nitrogen and chlorophyll contents in maize at leaf and canopy levels."
International Journal of Applied Earth Observation and Geoinformation 25 (2013): 47-54.
Strobl, Carolin, et al. "Bias in random forest variable importance measures: Illustrations, sources and a solution."
BMC bioinformatics 8.1 (2007): 1.
Strobl, Carolin, et al. "Conditional variable importance for random forests." BMC bioinformatics 9.1 (2008): 1.
Tillack, Adina, et al. "Estimation of the seasonal leaf area index in an alluvial forest using high-resolution satellite-based vegetation indices." Remote Sensing of Environment 141 (2014): 52-63.
Van der Laan, Mark J., Eric C. Polley, and Alan E. Hubbard. "Super learner." Statistical applications in genetics and molecular biology 6.1 (2007).
Verrelst, Jochem, et al. "Machine learning regression algorithms for biophysical parameter retrieval: Opportunities for Sentinel-2 and-3." Remote Sensing of Environment 118 (2012): 127-139.