EARTHQUAKE VULNERABILITY ASSESSMENT FOR HOSPITAL BUILDINGS USING
A GIS-BASED GROUP MULTI CRITERIA DECISION MAKING APPROACH: A CASE
STUDY OF TEHRAN, IRAN
M. R. Delavar a , M. Moradi b*, B. Moshiri c
a
Center of Excellence in Geomatic Engineering in Disaster Management, School of Surveying and Geospatial Engineering, College of Engineering, University of Tehran, Iran – [email protected]
b
School of Surveying and Geospatial Engineering, College of Engineering, University of Tehran, Iran – [email protected] c
Control and Intelligent Processing, Centre of Excellence, School of ECE, University of Tehran, Tehran, Iran – [email protected]
KEY WORDS: Group Multi Criteria Decision Making, GIS, Disaster Management, Earthquake Vulnerability Assessment
ABSTRACT:
Nowadays, urban areas are threatened by a number of natural hazards such as flood, landslide and earthquake. They can cause huge damages to buildings and human beings which necessitates disaster mitigation and preparation. One of the most important steps in disaster management is to understand all impacts and effects of disaster on urban facilities. Given that hospitals take care of vulnerable people reaction of hospital buildings against earthquake is vital. In this research, the vulnerability of hospital buildings against earthquake is analysed. The vulnerability of buildings is related to a number of criteria including age of building, number of floors, the quality of materials and intensity of the earthquake. Therefore, the problem of seismic vulnerability assessment is a multi-criteria assessment problem and multi multi-criteria decision making methods can be used to address the problem. In this paper a group multi criteria decision making model is applied because using only one expert’s judgments can cause biased vulnerability maps. Sugeno integral which is able to take into account the interaction among criteria is employed to assess the vulnerability degree of buildings. Fuzzy capacities which are similar to layer weights in weighted linear averaging operator are calculated using particle swarm optimization. Then, calculated fuzzy capacities are included into the model to compute a vulnerability degree for each hospital.
* Corresponding author
1. INTRODUCTION
Tehran is situated in a seismically active region in Middle East and it is dramatically threatened by earthquake (M Moradi, Delavar, Moshiri, & Khamespanah, 2014). In recent years, Tehran became a centre for many financial, educational and recreational activities. Rapid urban growth lack of urban planning and urban sprawl render the city extremely vulnerable to earthquake. Among all facilities in Tehran metropolitan area, hospitals have a remarkable value because they are related to a vulnerable category of people. A number of researches have been undertaken in order to assess the vulnerability of habitats and to estimate the number of deaths and casualties in the future earthquake (Mansouri, Kiani, & Amini-Hosseini, 2014; SHAYANNEJAD & ABEDINI ANGERABI, 2014; Sinha, Priyanka, & Joshi, 2014). Considering the fact that many factors are affecting seismic vulnerability of hospital buildings, this problem is a multi-criteria problem (Rashed & Weeks, 2003). This paper applies a multi-criteria method in order to assess the vulnerability of hospital buildings against earthquake. In addition, given that multi-criteria algorithms are ill-structured (Chakraborty & Joshi, 2014) which means that different multi-criteria models may produce different results, in this paper a model based on Sugeno integral is applied to analyse the vulnerability of hospital buildings. Moreover, more than one expert’s judgments are included into the model to reduce the uncertainty of single expert systems. Firstly, a vulnerability degree is calculated based on every expert’s judgments. Following that, a group multi criteria decision making model is
used to aggregate different experts’ vulnerability degrees and produce one overall answer. Sugeno integral which is able to aggregate attribute values with respect to the interaction among them is employed in this research. In fact, Sugeno integral is employed to serve two purposes in the current research. First of all, to aggregate attribute values and produce a vulnerability map based on each expert’s point of view and for group decision making. In this paper 5 experts are asked to evaluate the vulnerability of hospital buildings. Then, PSO is used to extract the optimum value of fuzzy capacities which are the unknowns of the Sugeno model. Finally, these fuzzy capacities which are obtained through training process are used for computing a vulnerability degree for each hospital building.
1.1 Related works
Seismic vulnerability assessment is a core process in disaster management and frequent efforts have been undertaken to address this problem. A number of these researches were related to physical vulnerability which indicates the vulnerability of buildings and structures against earthquake (Milad Moradi, Delavar, & Moshiri, 2015). Milad Moradi et al. (2015) proposed a GIS-based model using ordered weighted averaging operator that is able to analyse different seismic vulnerability maps based on optimistic and pessimistic scenarios. A group multi criteria decision making model was proposed by Peng (2012) for seismic vulnerability assessment. They assessed seismic vulnerability using a number of different MCDM methods in order to compare the results. A number of
researches addressed the problem of social vulnerability which indicates the degree to which human of a specific urban area are vulnerable against earthquake. Ge et al. (2013) analysed social vulnerability of urban areas against natural disasters with a multi criteria approach. Rashed and Weeks (2003) proposed an integrated multi criteria decision making model which is able to evaluate both social and physical vulnerabilities. They employed a fuzzy model to manage fuzzy uncertainties associated with input data. Earthquake vulnerability of urban facilities is assessed in some other researches. Considering the fact that children are a vulnerable part of any society, Panahi, Rezaie, and Meshkani (2014) designed and developed a seismic vulnerability assessment model for schools based on fuzzy analytical hierarchy process. They evaluated the impact of peak ground acceleration on schools buildings in Tehran. Rezaie and Panahi (2015) developed a model for including geotechnical parameters in a seismic vulnerability model based on multi criteria analysis. Although previous researches have investigated a wide range of aspects of this problem, vulnerability of hospital buildings have not been assessed before.
2. METHODOLOGY
2.1 Multi criteria decision making
Multi criteria decision making is a powerful tool that provides a variety of analyses in order to assess alternatives according to some aspects (Malczewski & Liu, 2014; Rinner, Keßler, & Andrulis, 2008). MCDM enables the decision makers to store, analyse and visualize the data, while GIS facilitates an environment to analyse the desirability of alternatives. In order to define the desirability relationships, expert’s judgment is obligatory. Given that usually there is uncertainty among expert’s judgments, in a number of decision making problems more than one expert is employed which is called group decision making (Jankowski & Nyerges, 2001; Ouma, Kipkorir, & Tateishi, 2011). Decision making is a framework in which useful information regarding with selecting an alternative from a set of alternatives is driven from row data layers. In spatial decision making, alternatives are points, lines and polygons which have a number of attribute values (Meng & Malczewski, 2015).
2.2 Sugeno integral
Sugeno integral is an aggregation operator which is able to compute an overall fitness measure regarding the interaction among criteria. The Sugeno integral applies fuzzy measures instead of simple weights. Fuzzy measure is a set function that assigns a value to each member of the power set of criteria. in fact, Sugeno integral need a measure indicating the importance of each set of criteria instead of the importance of each criteria which is indicated by traditional layer weights. Therefore, fuzzy capacities can produce a lattice for any problem which shows
Considering the fact that importance of a larger set is more than the importance of any of its subsets, following equation should always be satisfied (Grabisch, 1995):
In this notation sugeno integral is as follows (Grabisch, 1995):
1 2 ( ) measures. In order to calculate them, experts’ opinion should be employed (Grabisch & Labreuche, 2010). These fuzzy capacities indirectly implies the importance of each criterion in the decision making process. But they cannot provide explicit explanation because criterion i has an element of the fuzzy capacity lattice and the coalition of i and j also has another element, accordingly, it is impossible to understand the role of each criterion from the lattice itself. By defining other measures such as interaction index and Shapley index the role of each criterion in decision making can be expressed.
2.2.1 Interaction Index
In real world situation, the criteria are rarely independent and there is interaction among criteria which can be positive or negative. When there is positive interaction among the criteria, the importance of the coalition is greater than the importance of each criterion separately (Smrek, 2015). In terms of negative interaction, the fuzzy capacity associated to each criterion can be larger than the fuzzy capacity of the coalition. The
I = computed interaction of criterion i and j.
Positive values of interaction indicate complementary criteria, whereas negative values indicate redundant criteria. It is also possible to calculate the interaction among any given set of criteria using the following equation (Grabisch, Sugeno, & Murofushi, 2000):
On the other hand, it is possible to calculate the fuzzy measures from a set of training data. In this method, optimum fuzzy capacities can be calculated through an optimization algorithm. Moreover, given that Equation 2 should always be satisfied, the problem of finding fuzzy capacities is a constrained optimization problem. Successful models based on PSO and GA have been proposed for finding fuzzy capacities (Wang, He, Dong, & Zhao, 2011).
2.3 Particle Swarm Optimization
Particle Swarm Optimization is a swarm optimization algorithm. The first step is to initialize a set of particles. Then, the location of these particles should be updated using the following equation (Wang et al., 2011):
1 1
(i)
X (i) v
( )
t t t
X
i
(6)
where X = the position of the i th particle in t th iteration
v = the velocity of i th particle.
The velocity of each particle tends to move the particle towards the best position in the search space. The velocity is updated using the following equation (Wang et al., 2011):
1
1
2
( ) * ( ) *
(Pbest X (i)) c *(Gbest X (i))
t t
t t
v i w v i c
(7)
where Pbest = the location of the best particle in the ith iteration
Gbest = the best location ever searched.
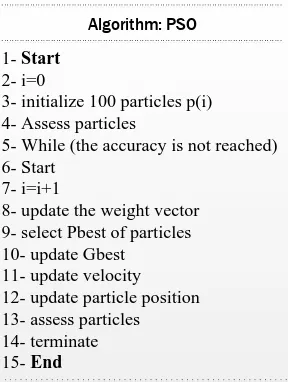
1- Start 2- i=0
3- initialize 100 particles p(i) 4- Assess particles
5- While (the accuracy is not reached) 6- Start
7- i=i+1
8- update the weight vector 9- select Pbest of particles 10- update Gbest 11- update velocity 12- update particle position 13- assess particles 14- terminate 15- End
Algorithm: PSO
Figure 1. The Pseudo code of PSO
Figure 1 indicates the steps which have been done to extract fuzzy capacities from sample data. In this paper, each element in the lattice of fuzzy capacities is simulated as a particle. Following that, by doing the steps shown in Figure 1, particles move toward the position that has minimum inconsistency with the objective function and the best set of fuzzy measures can be found.
3. IMPLEMENTATION
In this research, a multi criteria evaluation model is developed in Matlab which is an easy programing language. In this model, firstly, five experts are asked to give a score to 20 randomly selected hospitals and health care centres for their vulnerability against earthquake. Then, particle swarm optimization is employed as mentioned in section 2.3 to extract fuzzy capacities from experts’ data. Following that, Equation (3) is applied to calculate vulnerability degree of other hospital buildings. Finally, these vulnerability degrees are used to produce seismic vulnerability for hospital buildings.
3.1 Study area
The study area of this research is Tehran metropolitan area which is located in the central part of Iran. Its area is about 600 km2 and is located between 51º15’ and 51º 35’Eand 35º 33’ and 35º 50’N. Tehran is situated on the southern part of Alborz Mountains which are surrounded by a number of known and unknown faults. Therefore, Tehran is in a seismically active region and its habitants are threatened by earthquake risk. Moreover, the recurrence of earthquake is about 100 years and no large earthquake has stroked the city for more than 100 years. Consequently, an earthquake may be imminent in Tehran based on evidence. A number of hospitals are constructed on or near the faults which can cause a huge damage in case of any possible seismic threat. All the aforementioned situations necessitate researches on seismic hazard mitigation and disaster management.
3.2 Contributing criteria
Due to the fact that seismic damage is associated with a number of different criteria such as age and number of stories of the buildings, seismic vulnerability assessment can be considered as multi criteria problem. Accordingly, this problem should be addressed using multi criteria evaluating methods. Different criteria are included in previous researches on seismic vulnerability assessment including peak ground acceleration, distance to hazardous facilities, soil liquefaction and seismic resonance but because of the fact that authors have limited access to up-to-date data these factors are not included into the model. Six criteria are included in this research including the number of floors of the hospitals, the quality of hospital building’s materials, age of the buildings, the capacity of the hospitals, the distance of each hospital to the nearest fault and he average slope of earth’s surface in the neighbourhood of the hospitals which are discussed in Table 1.
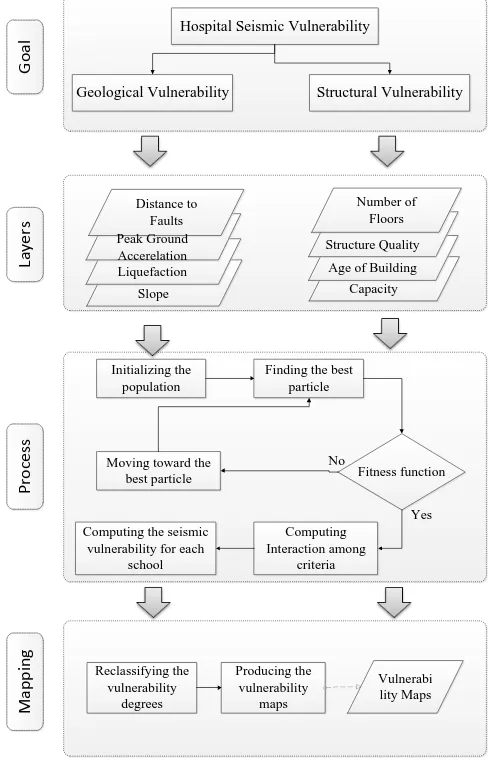
3.3 Model implementation
The steps shown in Figure are done in this research in order to find the vulnerability degree of hospitals. The resulted vulnerability degrees are then classified into 5 categories and illustrated in ArcGIS software. These steps are for a single expert and in this paper these steps are done for all experts separately.
ID Criteria Symbol Reference 1 number of floors Flr (Debnath, 2013; Milad
Moradi et al., 2015) 2 Building quality Bql (Milad Moradi et al.,
2015; Rashed & Weeks, 2003) 3 Age of building Abl (Huang, Zhou, & Wang,
2014; Rashed & Weeks, 2003)
4 Capacity Cap (Rashed & Weeks, 2003) 5 Distance to
faults
Dfl (M Moradi, Delavar, & Moshiri, 2013; Nath, Adhikari, Devaraj, &
Maiti, 2014; SHAYANNEJAD & ABEDINI ANGERABI,
2014)
6 Slope Slp (Barbat et al., 2010; Nath, Adhikari, Devaraj, &
Maiti, 2015) Table 1. Contributing criteria
Capacity Age of Building Hospital Seismic Vulnerability
Geological Vulnerability Structural Vulnerability
Number of Floors Structure Quality
Slope Liquefaction
Distance to Faults Peak Ground Accerelation
Initializing the population
Fitness function Finding the best
particle
Moving toward the best particle
No
Yes Computing
Interaction among criteria Computing the seismic
vulnerability for each school
Reclassifying the vulnerability
degrees
Producing the vulnerability
maps
Vulnerabi lity Maps
G
o
al
Lay
e
rs
P
ro
ce
ss
Map
p
in
g
Figure 2. The steps of the proposed model
4. RESULTS AND DISCUSSION
Figure 3 depicts the spatial distribution of the vulnerability of hospitals in Tehran based on the opinion of all experts. In fact, this map is based on the consensus of the five experts’ opinions. Overall, 12%, 29%, 34% and 25% of hospital buildings are categorized in least vulnerable, less vulnerable, vulnerable and very vulnerable classes, respectively.
Figure 3. Vulnerability map of hospital buildings
This data can provide us an insight into the vulnerability conditions of the hospitals buildings. There is considerable number of vulnerable and very vulnerable hospitals in Tehran, according to which the modification and reconstruction of these buildings are obligatory. Results indicate that most of the vulnerable hospitals are located in the central parts of the city where most of the buildings are aged and roads are narrow. Thus, the results necessitate maintenance operations for healthcare centres inside Tehran metropolitan area.
5. CONCOLUSION
A new group MCDM model is proposed in this paper. The proposed model is able to aggregate attribute values with respect to the interaction among criteria. Sugeno integral is able to take the interaction among the criteria into account. In this paper, five experts are asked to specify the degree to which hospitals are vulnerable. Using more than one expert’s opinion, the model reduces the uncertainty associated with experts’ judgments. The results depict that most hospitals in central and southern part of Tehran are extremely vulnerable and may cause huge damages in case of earthquake. This research also specifies the hospitals that need immediate attention. The multi criteria decision making model proposed in this research can be employed in other disaster management studies with minor modifications.
REFERENCES
Barbat, A. H., Carreño, M. L., Pujades, L. G., Lantada, N., Cardona, O. D., & Marulanda, M. C. (2010). Seismic vulnerability and risk evaluation methods for urban areas. A review with application to a pilot area. Structure and Infrastructure Engineering, 6(1-2), 17-38.
Chakraborty, A., & Joshi, P. (2014). Mapping disaster vulnerability in India using analytical hierarchy process. Geomatics, Natural Hazards and Risk(ahead-of-print), 1-19.
Debnath, R. (2013). An assessment of spatio-temporal pattern of urban earthquake vulnerability using GIS: a study on Dhaka City. Annals of GIS, 19(2), 63-78.
Ge, Y., Dou, W., Gu, Z., Qian, X., Wang, J., Xu, W., . . . Chen, Y. (2013). Assessment of social vulnerability to natural hazards in the Yangtze River Delta, China. Stochastic Environmental Research and Risk Assessment, 27(8), 1899-1908.
Grabisch, M. (1995). Fuzzy integral in multicriteria decision making. Fuzzy sets and Systems, 69(3), 279-298.
Grabisch, M. (1996). The application of fuzzy integrals in multicriteria decision making. European journal of operational research, 89(3), 445-456.
Grabisch, M., & Labreuche, C. (2010). A decade of application of the Choquet and Sugeno integrals in multi-criteria decision aid. Annals of Operations Research, 175(1), 247-286.
Grabisch, M., Sugeno, M., & Murofushi, T. (2000). Fuzzy measures and integrals: theory and applications: Springer-Verlag New York, Inc.
Huang, J., Zhou, Q., & Wang, F. (2014). Mapping the landslide susceptibility in Lantau Island, Hong Kong, by frequency ratio and logistic regression model. Annals of GIS(ahead-of-print), 1-18.
Jankowski, P., & Nyerges, T. (2001). GIS for group decision making: CRC Press.
Malczewski, J., & Liu, X. (2014). Local ordered weighted averaging in GIS-based multicriteria analysis. Annals of GIS, 20(2), 117-129.
Mansouri, B., Kiani, A., & Amini-Hosseini, K. (2014). A Platform for Earthquake Risk Assessment in Iran Case Studies: Tehran Scenarios and Ahar-Varzeghan Earthquake. Journal of Seismology and Earthquake Engineering, 16(1), 51-69.
Meng, Y., & Malczewski, J. (2015). A GIS-based multicriteria decision making approach for evaluating accessibility to public parks in Calgary, Alberta. Human Geographies-Journal of Studies and Research in Human Geographies, 9(1), 29-41.
Moradi, M., Delavar, M., & Moshiri, B. (2013). Sensitivity analysis of ordered weighted averaging operator in earthquake vulnerability assessment. ISPRS-International Archives of the Photogrammetry, Remote Sensing and Spatial Information Sciences, 1(3), 277-282.
Moradi, M., Delavar, M., Moshiri, B., & Khamespanah, F. (2014). a Novel Approach to Support Majority Voting in Spatial Group MCDM Using Density Induced Owa Operator for Seismic Vulnerability Assessment. ISPRS-International Archives of the Photogrammetry, Remote Sensing and Spatial Information Sciences, 1, 209-214.
Moradi, M., Delavar, M. R., & Moshiri, B. (2015). A GIS-based multi-criteria decision-making approach for seismic vulnerability assessment using quantifier-guided OWA operator: a case study of Tehran, Iran. Annals of GIS, 21(3),
Murofushi, T., & Sugeno, M. (1989). An interpretation of fuzzy measures and the Choquet integral as an integral with respect to a fuzzy measure. Fuzzy sets and Systems, 29(2), 201-227.
Nath, S., Adhikari, M., Devaraj, N., & Maiti, S. (2014). Seismic vulnerability and risk assessment of Kolkata City, India. Natural Hazards and Earth System Sciences Discussions, 2, 3015-3063.
Nath, S., Adhikari, M., Devaraj, N., & Maiti, S. (2015). Seismic vulnerability and risk assessment of Kolkata City, India. Natural Hazards & Earth System Sciences Discussions, 15(6).
Ouma, Y. O., Kipkorir, E. C., & Tateishi, R. (2011). MCDA-GIS integrated approach for optimized landfill site selection for growing urban regions: an application of neighborhood-proximity analysis. Annals of GIS, 17(1), 43-62.
Panahi, M., Rezaie, F., & Meshkani, S. (2014). Seismic vulnerability assessment of school buildings in Tehran city based on AHP and GIS. Natural Hazards and Earth System Science, 14(4), 969-979.
Peng, Y. (2012). Regional earthquake vulnerability assessment using a combination of MCDM methods. Annals of Operations Research, 1-16.
Rashed, T., & Weeks, J. (2003). Assessing vulnerability to earthquake hazards through spatial multicriteria analysis of urban areas. International Journal of Geographical Information Science, 17(6), 547-576.
Rezaie, F., & Panahi, M. (2015). GIS modeling of seismic vulnerability of residential fabrics considering geotechnical, structural, social and physical distance indicators in Tehran using multi-criteria decision-making techniques. Natural Hazards and Earth System Science, 15(3), 461-474.
Rinner, C., Kebler, C., & Andrulis, S. (2008). The use of Web 2.0 concepts to support deliberation in spatial decision-making. Computers, Environment and Urban Systems, 32(5), 386-395.
Shayannejad, A., & Abedini Angerabi, B. (2014). Earthquake Vulnerability Assessment in urban areas using MCDM. International Review for Spatial Planning and Sustainable Development, 2(2), 39-51.
Sinha, N., Priyanka, N., & Joshi, P. (2014). Using Spatial Multi-Criteria Analysis and Ranking Tool (SMART) in earthquake risk assessment: a case study of Delhi region, India. Geomatics, Natural Hazards and Risk(ahead-of-print), 1-22.
Smrek, P. (2015). Sugeno integrals with respect to level dependent capacities. Fuzzy sets and Systems.
Wang, X.-Z., He, Y.-L., Dong, L.-C., & Zhao, H.-Y. (2011). Particle swarm optimization for determining fuzzy measures from data. Information Sciences, 181(19), 4230-4252.