Vol. 1, No. 3, Pp. 138-145 ISSN: 2087-3956 (electronic) November 2009
Kimpul (Xanthosoma spp.) characterization based on morphological
characteristic and isozymic analysis
NURMIYATI1,♥, SUGIYARTO², SAJIDAN1,²
¹Biology Education Program, Department of Mathematics and Natural Sciences Education, Faculty of Teacher Training and Education Science, Sebelas Maret University Surakarta 57 126, Central Java, Indonesia
²Bioscience Program, School of Graduates, Sebelas Maret University, Surakarta 57126, Central Java, Indonesia
Manuscript received: 27 July 2009. Revision accepted: 28 September 2009.
Abstract. Nurmiyati, Sugiyarto, Sajidan. 2009. Kimpul (Xanthosoma spp.) characterization based on morphological characteristic and isozymic analysis. Nusantara Bioscience 1: 138-145. This research is aimed: (i) to know the variety of kimpul (Xanthosoma spp.) based on morphological characteristics and isozymes analysis; (ii) to know the correlation between its genetic space based on morphological characteristics and its genetic resemblance based on isozymes-banding pattern. This research results were analyzed and described by descriptive qualitative methods. Morphological observation was carried out in sub-District of Galur, Lendah and Girimulyo, Kulonprogo District, Yogyakarta. Morphological data of the kimpul plant was explored descriptively and then made dendogram. Data of isozymic banding pattern were analyzed quantitatively based on the appearance of the band on the gel, and qualitatively based on the thickness of the band formed, and then made dendogram. The correlation, between its genetic distance based on morphological characteristics and its genetic resemblance based on isozymes-banding pattern, were then analyzed grounded on coefficient correlation between product-moment and goodness of it criteria based on correlation. The results pointed out that morphologically, on eight observed samples which were consist of four different types (species), each Xanthosoma from different locations did not indicate obvious differences. Esterase was formed four different banding-patterns, Glutamate Oxaloacetate Transaminase indicated eight different banding-patterns, and Peroxidase indicated seven different banding-patterns. Correlation between morphological data and data from EST and GOT isozymic banding pattern were very good (0.967918 and 0.937113), While, the correlations between morphological data and POD isozymes were good (0.892721).
Key words: kimpul, Xanthosoma, morphological characteristic, isozyme.
Abstrak. Nurmiyati, Sugiyarto, Sajidan. 2009. Kimpul (Xanthosoma spp.) characterization based on morphological characteristic and isozymic analysis. Nusantara Bioscience 1: 138-145. Penelitian ini bertujuan untuk mengetahui keragaman tanaman kimpul (Xanthosoma spp.) berdasarkan karakter morfologi dan analisis isozim serta korelasi antara jarak genetik berdasarkan karakter morfologi dan kemiripan genetik berdasarkan pola pita isozim. Penelitian morfologi dilakukan di Kecamatan Galur, Lendah dan Girimulyo, Kabupaten Kulonprogo, Yogyakarta. Data morfologi diuraikan secara deskriptif dan dibuat dendogram hubungan kekerabatan. Data pola pita isozim dianalisis secara kuantitatif berdasarkan muncul tidaknya pita pada gel kemudian dibuat dendogram. Korelasi antara jarak genetik berdasarkan karakter morfologi dan kemiripan genetik berdasarkan pola pita isozim dianalisis berdasarkan koefisien korelasi product-moment dengan kriteria goodness of fit. Hasil penelitian menunjukkan bahwa secara morfologi pada delapan sampel dari empat macam kimpul yang ditemukan di lokasi yang berbeda tidak menunjukkan perbedaan yang nyata. Pola pita isozim Esterase yang terbentuk menunjukkan empat pola pita yang berbeda, isozim Glutamat Oksaloasetat Transaminase menunjukkan delapan pola pita yang berbeda dan isozim Peroksidase menunjukkan tujuh pola pita yang berbeda. Korelasi data morfologi dengan pola pita isozim EST dan GOT sangat baik (0,967918 dan 0,937113), sedangkan dengan isozim POD berkorelasi baik (0,892721).
Kata kunci: kimpul, Xanthosoma, karakter morfologi, isozim.
PENDAHULUAN
Indonesia is a country with abundant natural wealth. Currently, Indonesia is ranked the third in the world in terms of biodiversity. Ironically, with abundant natural wealth, Indonesia is still threatened by food crisis. The natural resource wealth that is owned by Indonesia can not guarantee the welfare of its people. Efforts to diversify the pattern of the creation of food self-sufficiency must be done to reduce the problems of rice. Increasing the food production can be done through the development and utilization of biodiversity that has not been used optimally.
The potential of these commodities is not supported by good data. According Kusumo et al. (2002) the number genotype kimpul(Xanthosoma spp.) in Indonesia has not been recorded. Therefore, to explore the potential plant data collection of kimpul a study needs to be done with the properties of importance to characterize. Characterization was conducted to determine the plant diversity in the field, either in the form diversity of morphological characters, agronomy, physiology, molecular markers or isozyme markers.
MATERIALS AND METHODS
Place and time
The collection and characterization of the plants were done in Kulonprogo District, Yogyakarta, which was in Subdistricts of Galur (0-25 m asl.), Lendah (700-100 m asl.) and Girimulyo (25-500 m asl.). Isozyme compare comparison pattern analysis was conducted in the Laboratory of Plant Breeding, Faculty of Forestry, University of Gajah Mada University, Yogyakarta.
Material
Material that was used for morphological characteri-zation is a specimen kimpul (Xanthosoma spp.) from Kulonprogo. Isozyme analysis used three enzyme systems, namely: esterase (EST), glutamate oxaloacetic transaminase (GOT) and peroxidase (PER, POD) in polyacrylamide gel.
Morphological observation.
The morphological characteristics that were observed were the characters of vegetative and kormel/the tuber based guidebook by Kusumo et al. (2002) and Tjitrosoepomo (2003).
Isozyme diversity (Suranto 1991, 2000, 2001)
Sampling. Young leaves of each sample plant were taken, and then weighed with an analytical balance until it reached 100 mg and placed in the mortar to be extracted.
Samples extraction. Young stems were destroyed by mortar, and then given a solution of 1 mL buffer extract and crushed again until smooth and then it was put into the ependorf tube. Prepare centrifuge to cool (± 0°C), and played with the speed of 700-1500 rpm for ± 20 minutes. Clear supernatant can be immediately used for electrophoresis or cooled at 20°C for later use.
Preparation of polyacrylamide gel. Polyacrylamide gel consists of 2 parts, namely running a gel that lies at the bottom with a concentration of 7.5% and spacer gel located on top of running gel with a concentration of 3.75%.
Making running gel. All the ingredients were mixed in a solution; after it became homogeneous mixture then it was put inside of the electrophoresis glass, where on its right and left edge, and bottom there is a mounted bulkhead (shiled tube). Furthermore, to create a flat surface of the gel it can be added alcohol and water. Then the alcohol and the water sucked out with the aspirator running. The top of the gel can be poured with a gel spacer.
Making gel spacer. After the solution was mixed and homogeneous, this mixture was inserted in the glass just above the running electrophoresis gels. Then the sample comb mounted on the spacer gel electrophoresis and glass heated with neon lights ± 0.5 to 1 hour to condense. After the spacer gel solidified, the sample comb was removed so that there were holes that would condition with supernatant.
Electrophoresis process. Electrophoresis was carried out using a vertical electrophoresis type, complete with its power supply. The first step of the cover was opened and the electrophoresis bath tub was filled with a solution of electrode buffer tanks as high as ± 2 cm. This solution serves as the conductor of electric current during electrophoresis in a face-to-facing. Then it was added a solution of running buffer tank to the inside front plate that had been installed, but not fully. Then the supernatant solution was poured into the hole as much as 5 mL samples with a stepper. The remaining buffer tank was loaded again up to meet the electrophoresis bath tub cover and replacing it. The power supply was turned on to run the electrophoresis process with electricity currents of ± 100 mA for 180-200 min.
Staining process. Staining or coloring process was done after the process of electrophoresis, the dye were EST, GOT, and POD.
Observations gel. After the coloring process was done and the banding pattern image was visible on the gel, and then the process of fixation was made (the gel was placed in a solution of 60% ethanol plus distilled water and closed the glass and then put into refrigerator). The purpose of this fixation process was to help to preserve the gel with a way to stop the chemical reactions that occurred in the gel. Making dendogram. Isozyme banding pattern results were interpreted in zimogram electrophoresis, and then it was converted into binary data, and its dendogram was drawn. Measurement of migration distances (Rf) were measured from a distance of band that looked divided by the longest migration distance.
Data analysis
calculated based on the DICE coefficient. Clustering/grouping is done by UPGMA (Unweigthed Pair Group with Arithmetic Mean) is calculated via tail SHAN on NTSYS program (Felsenstein 1985; Rohlf 1993). Dendogram formed as shown in Figure 1 and 3.
RESULTS AND DISCUSSION
Characterization of morphology
Results are morphologically characterization of
Xanthosoma plants in the region Kulonprogo, from eight
samples taken from three different locations, were found four types of Xanthosoma with characteristics as in Table 1. Based on the results of the morphology characterization of the three study sites, there are four kinds of Xanthosoma
spp. which shows the diversity of characteristics.
Kimpul Gendruk
Gendruk has grown type of acalauscent.
Hastate-shaped leaves are with drooping position at the end of the petiole. Full leaf edge smooth, green and have no indentation. Not glaucous leaf surface, its upper surface is shiny and dark green, while the bottom surface is green. Leaves are not diverse and do not have hair. Sliced crosswise of the mother leaves bone and the lateral bone appears on the upper surface and does not appear on the bottom surface.
Each leaf stalk attached to the midrib of its part, where the 2/3 part is bright green top and third bottom of the green. 1/3-2/3 of the length of the leaf midrib petiole, midrib pink edge.
Bulbs are light brown or medium brown and have a smooth surface on the outside, while on the inside is white. Pink root tip with the tip position is under the ground. Ellipse-shaped tuber is ovate and cylindrical with size varied depending on the location of plant.
Kimpul Ireng
Ireng has grown type acalauscent.
Hastate-shaped leaves with bowl-shaped leaf are on the tip of the leaf stalk. Full leaf edge is smooth, purple and has no indentation. Upper leaf surface is glaucous, not glossy and purplish-green, whereas the lower leaf surface color is green. Leaves are not diverse and do not have hair. Sliced crosswise of mother leaves the bone and the bone lateral leaf appear on the upper surface and does not appear on the bottom surface.
Each leaf stalk attached to the part of the stem, where the whole stalks is purple. 1/3-2/3 of the length of the leaf is midrib petiole, midrib purple edge is like stalks and the stem.
Tuber is dark brown haired and rough on the outside, while on the inside it is white to purple. Pink root tip with the tip position is under the ground. Ellipse-shaped tuber or cylindrical with a wide variety of sizes depending on the location of planting.
Kimpul Puteh
Puteh has grown type of acalauscent.
Sagitate shaped leaves is with lobes <1/8 part of the long leaf-shaped bowl with leaf position at the end of the petiole. Full leaf edge is wavy, pale yellow/beige and have no indentation. Upper leaf surface and bottom is not shiny and bright green. Leaves are not diverse and do not have hair. Sliced crosswise mother leaves the bone and the bone lateral leaf appears on the upper surface and does not appear on the bottom surface.
Petiole is slightly attached to the part of the stem, 2/3 the top of the stem is bright green and 1/3 part bottom is green. 1/3-2/3 of the length of the leaf midrib petiole, midrib green edges such as stalks and the stem.
Kimpul Puteh does not produce tubers.
Kimpul Mothe
This kimpul is very similar to Puteh but petiole color (2/3 top) is green, a third of the remaining is red/purple and yellow in the inside cormel.
Dendrogram morphological characters
The similarity of the observed character of the eight samples consisting of four types of Xanthosoma in this study may indicate the closeness of relationship owned. Therefore testing the closeness of relationship that is owned by eight samples consisting of four types of
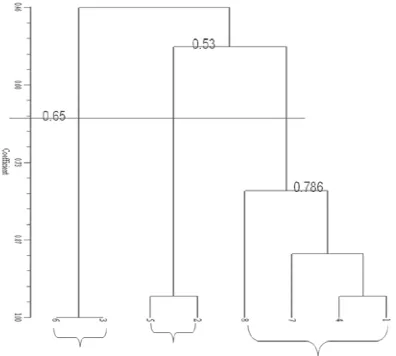
Xanthosoma using the dendogram, as shown in Figure 1.
The dendogram of the eight samples tested, the similarity coefficient of 65% to form three major groups are: the first group consisted of Gendruk (Galur, Lendah and Girimulyo) and the mothe of Girimulyo, the second group consisted of Ireng derived from Galur and Lendah and the third group is Puteh of Galur and Lendah. According to Cahyarini (2004) distance is much similarity can be said when less than 0.60 or 60%. Thus, separate groups at a distance of 0.65 is actually still have a close resemblance. In this dendogram analysis, the number 1 or 100% in the dendogram indicate that group members had a perfect likeness, while getting closer to the number 0 means the similarity distance is going further.
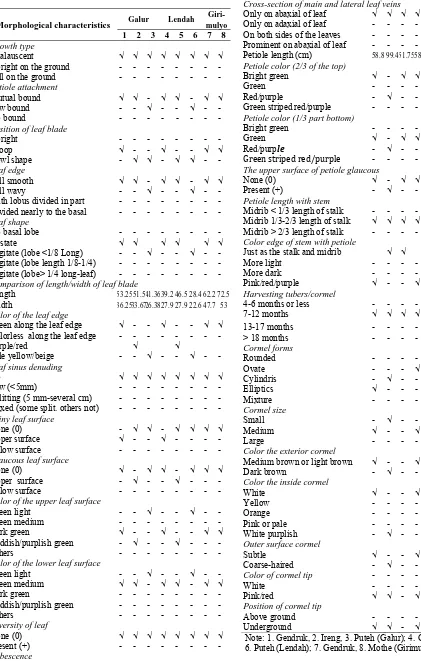
Table 1. Morphological characteristics of Xanthosoma spp. in sub-districts of Galur, Lendah and Girimulyo, Kulonprogo District, Yogyakarta.
Morphological characteristics Galur Lendah Giri-Comparison of length/width of leaf blade
Length 53.2551.5 41.3639.2 46.5 28.4 62.2 72.5 Width 36.2533.6726.3827.9 27.9 22.6 47.7 53 Color of the leaf edge
Green along the leaf edge √ - - √ - - √ √
Color of the upper leaf surface
Green light - - √ - - √ - -
Green medium - - -
Dark green √ - - √ - - √ √
Reddish/purplish green - √ - - √ - - -
Others - - -
Color of the lower leaf surface
Green light - - √ - - √ - -
Cross-section of main and lateral leaf veins
Only on abaxial of leaf √ √ √ √ √ √ √ √ Only on adaxial of leaf - - - - On both sides of the leaves - - - - Prominent on abaxial of leaf - - - - Petiole length (cm) 58.8 99.4 51.7558.8 90.2 54 112.6133.3 Petiole color (2/3 of the top)
Bright green √ - √ √ - √ √ -
Green - - - √
Red/purple - √ - - √ - - -
Green striped red/purple - - - Petiole color (1/3 part bottom)
Bright green - - -
Green √ - √ √ - √ √ -
Red/purple - √ - - √ - - √
Green striped red/purple - - -
The upper surface of petiole glaucous
None (0) √ - √ √ - √ √ √ Color edge of stem with petiole
Just as the stalk and midrib √ √ √ √ - √
Position of cormel tip
Above ground - - -
Underground √ √ - √ √ - √ -
Based on morphological characters observed, Puteh from Galur and Lendah show similar properties. As shown in the dendogram, both exist at the similar coefficient of 100% which means the exactly the same or makes no difference. When compared with other types of
Xanthosoma, this type forms its own group and makes little
resemblance to other types. This species is clustered with other species at 46% similarity level. Ireng has a high similarity coefficient with Gendruk at 53%, while mothe has a high similarity coefficient with Gendruk at 78.6%.
Xanthosoma type that were from different locations did
not show morphological characteristics are that different; in other words differences in location did not affect plant morphology. Morphological differences that appear only on the length of petiole, leaf blade length and width, and size kormel. These traits are related to the growth of each crop. Xanthosoma that usually is found in Girimulyo has a larger plant size, has the petiole and leaf blade size is larger than the two other locations. Cormel generally also has larger size, though with the same age with a second harvest in other areas. These properties appear related to physical factors/environment where Xanthosoma lives. Xanthosoma
from Girimulyo area planted by the community as a plant in a garden under the trees, so Xanthosoma get shade from the plants that are above it. In this region Xanthosoma
deliberately cultivated and cared quite well in the garden-courtyard. Plants constantly adapt to each face of environmental stress. Plants deal with stress, shade will make a strategy for adjustment. Adjustments to such as changes in morphological characters and physiology of plants (Djukri 2006). This character-specific changes in conditions such as shade increased leaf width but much thinner (Taiz and Zeiger 1991). Agronomic characters associated with high production potential is high habitus plants, broad leaves and roots of both (Sulistyono et al. 2002).
In the circumstances of shaded light spectrum that are active in the process of photosynthesis (wavelength
400-700 nm) decreased. Plants will make adjustments to streamline to capture the light energy by increasing the leaf area to meet the needs of light that are active in the process of photosynthesis. Another form of adjustment is the increased plant height and chlorophyll a and b (Lambers et al. 1998). Based on the research by Anggarwulan et al. (2008) that treatment of shade variations have a significant influence on plant height that is 75% shade treatment combination gave the bestplant height, while the treatment without shade produces a low plant height. Light plays an important role in plant physiological processes, especially photosynthesis, respiration and transpiration.
Characterization based on isozyme markers
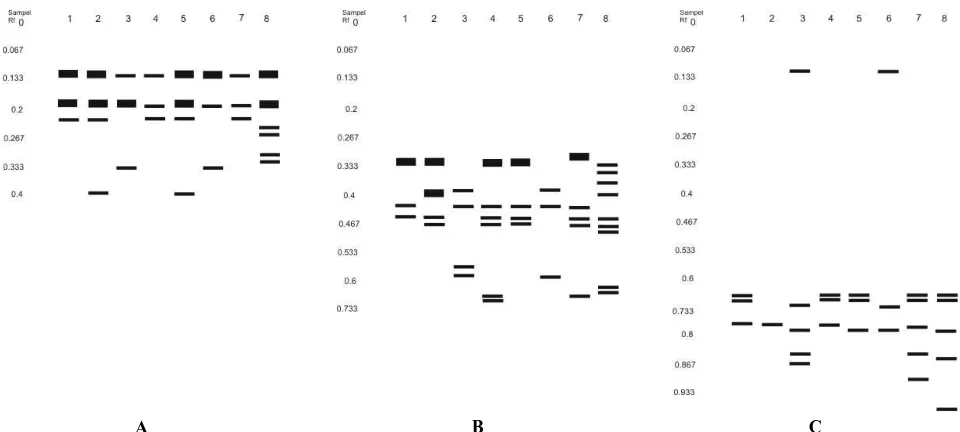
Analysis of the enzyme EST, GOT, and POD of the eight samples Xanthosoma plants shown in Figure 2.
Esterase (EST)
Based on isozyme analysis with dye EST on eight samples tested Xantosoma formed four distinct banding pattern (Figure 2). Four kinds of banding pattern were different in shape and migration distance. Migration distance of each band calculated by the formula Rf (relative Ferguson) by comparing the distance of bands from each of the wells that are formed by the migration of the farthest distance (distance Loding dye) (Hames and Rickwood 1990; Julisaniah et al. 2008). Banding pattern I with the same migration distance but has a different shape, the migration distance 0.129, 0.185 and 0.222 are owned by the sample 1, 3 and 7 (quantitative and qualitative). Banding pattern II with migration distance 0.129, 0.185, 0.222, and 0.389 is owned by the sample 2 and five (quantitatively and qualitatively). Banding pattern III with migration distance 0.129, 0.185 and 0.333 are owned by samples 3 and 6 (quantitative and qualitative). IV banding pattern unique to the sample 8 has a migration distance 0.129, 0.185, 0.241, 0.259, 0.296 and 0.315.
A B C Figure 2. Zimogram of eighth sample of Xanthosoma spp. from three different locations based on the dye: A. EST, B. GOT, C. POD.
Quantitative traits are usually controlled by many genes and strongly influenced by environmental factors, whereas for the qualitative nature is almost not influenced by environmental factors, so that qualitative factors are preferred because they relate to the presence or absence of certain bands on migration distance that reflects the presence or absence of amino acid enzyme which is the gene product itself (Setianto 2001). While the difference in thickness is formed thin bands due to differences in the number of molecules that is migrated, a thick band fixation of several bands. Molecules that have a large ionic strength will migrate further than the low ionic strength (Cahyarini 2004).
Glutamic oxaloacetic transaminase (GOT)
Based on isozyme analysis with dye GOT, eight samples of Xantosoma were tested to form eight distinct banding pattern (Figure 2). Banding pattern I on migration distances 0.32, 0.42 and 0.44 are owned by the sample 1. Banding pattern II on migration distances 0.32, 0.4, 0.44 and 0.46 are owned by the sample 2. Banding pattern III on migration distances 0.38, 0.42, 0.56 and 0.58 are owned by sample 3. Banding pattern IV on migration distance 0.32, 0.42, 0,440,46, 0.66 and 0.68 are owned by the sample 4. Banding pattern V of migration at a distance of 0.32 V, 0.42, 0.44 and 0.46 are owned by sample V. Banding pattern VI on migration distance 0.38, 0.42 and 0.58 are owned by the sample VI. Banding pattern VII on migration distance 0.3, 0.42, 0.44, 0.46, 0.64 and 0.66 are owned by the sample VII. Banding pattern VIII on migration distance 0.32, 0.34, 0.36, 0.4, 0.44, 0.46, 0.48, 0.62 and 0.64 are owned by the sample VIII.
Peroxidase (POD)
Based on the analysis of POD isozyme with the dye on the eight samples of Xantosoma that were tested form seven different banding pattern (Figure 2). Banding pattern I on migration distances 0.654, 0.673 and 0.75 are owned by the sample 1 and 4. The pattern of bands II at a distance of 0.75 migration is owned by sample 2. Banding pattern III on migration distances 0.096, 0.712, 0.769, 0.846 and 0.885 are owned by sample 3. IV banding pattern on migration distance 0.673 and 0.679 are owned by sample 5. Banding pattern of migration at a distance of 0.096 V, 0.712, 0.769 and 0.904 are owned by the sample No. 6. VI banding pattern on migration distance 0.673, 0.75 and 0.846 are owned by the sample 7. VII banding pattern on migration distance 0.673, 0.769, 0.865 and 0.966 are owned by the sample 8.
Genetic similarity based on isozyme markers
Dendogram based on EST
Based on a dendogram in Figure 3 obtained from cluster analysis (group) that is used to determine the similarity of the samples tested, at a distance of 0.65 or 65% showed three major groups. In this dendogram analysis number one on the dendogram showed group members had perfect resemblance, while getting closer to zero means the similarity distance farther. At 65% similarity distance is divided into three major groups i.e.
group I consists of samples 1, 4, 7, 2 and 5. Group II consists of samples 3 and 6, and group III consists of the sample 8. At 86% similarity distance separation occurred in group I. Group I again split into two groups: the group It consists of samples 1, 4 and 7 and group Ib consisted of samples 2 and 5. Thus based on the diversity patterns EST
band formed at a distance of 65% similarity can be separated between group I (Gendruk and Ireng) with group II and group III which is respectively Puteh and mothe. At this distance we can not distinguish between Gendruk and Ireng, both can be distinguished at a distance of 86% similarity. Based on the results of such grouping, we can not distinguish types of the same sample that derived from different locations. Gendruk from three different locations in one group, Ireng from two different locations to form a single group, as well Puteh from two different locations has also formed a group.
Dendogram based on GOT
Based on the results obtained dendogram from cluster analysis (group) that is used to determine the similarity of the samples tested, at a distance of 0.65 or 65% showed five groups. Group I consists of samples 1, 5 and 4, group II consists of sample 2, group III consists of sample 7, group IV consists of samples 8 and group V consisted of samples 3 and 6. Dendogram based on this pattern of GOT
bands can separate Puteh derived from Galur and Lendah from other groups on a relatively small distance similarity as much as 17%. Between Mothe of Girimulyo Gendruk and Ireng are apart at a distance of 42.2%. At a distance of 73.4% similarity of Lendah Gendruk split from the group I, and Gendruk of Galur and Ireng of Lendah separated at a distance of 86% similarity.
Dendogram based on POD
Based on the results obtained dendogram from cluster analysis (group) that is used to determine the similarity of the samples tested, at a distance of 0.65 or 65% showed five groups. Group I consists of samples 1, 4 and 7, group II consists of sample 2, group III consists of sample 3, group IV consists of samples 6 and group V consisted of samples 5 and 8. Dendogram based on banding pattern Gendruk POD can separate from the Galur, Lendah and Girimulyo from other groups at a distance of 65% similarity. In this distance similarity of Ireng from Galur, Galur and Lendah Puteh from separating groups each forming his own group: the group II, III and IV with a single member. But at a distance of 57% similarity, Galur, Lendah, and Puteh joined in a group. At a distance of 65% similarity Lendah Ireng of parting with Ireng of Galur and joined the mothe of Girimulyo.
Relations morphology characterization and isozyme markers
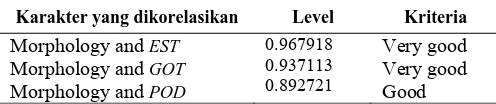
morphological characteristics and genetic similarity based on isozyme banding pattern as in Table 2.
Correlation between morphological data and data isozyme banding pattern EST,GOT and POD in a row at the level of 0.967918, 0.937113 and 0.892721. Thus means that the results of characterization based on morphological characteristics and results of characterization based on EST
and GOT isozyme markers have a very good correlation. While the results of characterization based on morphological characteristics and results of characterization based on
POD isozyme markers have a good correlation.
Characterization of Xanthosoma based on morphological characteristics consistent with the characterization based on isozyme markers.
Table 2. The correlation between genetic distance based on morphological characters and isozyme banding pattern
Karakter yang dikorelasikan Level Kriteria
Morphology and EST
Morphology and GOT
Morphology and POD
0.967918 0.937113 0.892721
Very good Very good Good
Dendogram relationship of Xanthosoma spp. from three different locations based on morphological characters, coloring EST, GOT and POD (Figure 3), indicating that Xanthosoma with the same type but originating from different areas showed no differences in the character pattern of band. At 65% similarity distance is divided into three major groups i.e. group I consists of samples 1, 4, 7 and 8. Group II consists of sample 2 and 5, and group III, i.e. samples 3 and 6. At the distance of separation of similarity of 80% occurred in group I. Group I again split into two groups: the group It consists of samples 1, 4 and 7 and Ib group consisted of samples 8. Thus it is clear that Gendruk of the three locations clustered in one group separate and distinct from other groups. Likewise mothe from Girimulyo, it is clustered in one distinct group and tend to have a closer relationship to
Gendruk. Galur and Lendah Puteh forming their own groups and has distant relationship with other groups. Ireng of Galur and Lendah formed his own group.
Based on characterization, the results indicate that each type of Xanthosoma is the same even if planted in different locations still express the same trait. This can be understood that the three places chosen as sampling sites are still in a region that is in the area of Kulonprogo, so it is possible that each of the Xanthosoma species that is in those three locations is an elder and there is no difference genetically. Stronger genetic factor influencing phenotypic expression when compared with environmental factors, so that even if planted in different locations still express the same trait. This is supported by the results of characterization based on morphologic characteristics which indicate that the same Xanthosoma species are found in different locations still showed the same morphological features.
The diversity of plant species is a manifestation of the genetic capability to respond to the potential of the existing environment. This response can be viewed from two aspects of how the environment needed to realize its potential and how plants respond to environmental values that exist. In this case each plant species Xanthosoma able to respond to any environmental value to survive. In other words each type of Xanthosoma has the capability of adaptation to the environment that is wide enough, can survive in several different environments. Species plant is said to have wide adaptation (adjustment) when completing one life cycle in different environments (Odum and Barrett 2005).
EST enzyme that has a general nature and applies to all types of plants that EST in plants is a hydrolytic enzyme that functions to withhold simple esters in organic acids, inorganic acids and phenols and alcohols have low molecular weight and soluble (Cahyarini 2004). GOT
isozyme banding pattern formed on the testing of eight samples showed eight distinct banding pattern. Each sample has a banding pattern that is different from other samples. POD isozyme banding pattern formed on the
0.65
0.8
A B C D
testing of eight samples shows seven different band patterns. Each sample has a different banding pattern with the other samples except sample 1 and 4 have the same band pattern. Peroxides oxidoreductase is an enzyme that contributes to the oxidation of a substrate while reducing H2O2 to H2O. Rothe (1994) says that the POD isozyme was widespread, especially in plants and present in significant amounts. With the presence of hydrogen peroxide (H2O2) catalyze the oxidation of phenol (AH2) and aromatic amines (AH2) in accordance with the following Enzim-H2O2 + AH2 Æ enzim + A + 2 H2O.
Peroxidase has a broad spectrum and has a very important role in the process of plant physiology. This enzyme can be isolated and scattered in the cell or plant tissue, especially in plant tissues that had been developed (Butt 1980; Hartati 2001). POD in plants is a protein that catalyzes the oxidation of H2O2 with a variety of substrates. Some functions of POD in plants include the formation of wood, auxin metabolism (Gaspar et al. 1991; Groppa 1999), in response to environmental stress (Castillo and Reppin 1986; Esaki et al. 1996) and as a defense against pathogens (Lagrimi and Rothstein 1987; Mohan and Kolattukudy 1990).
CONCLUSION
There is no diversity of morphological characteristics of each type of Xanthosoma that is found at different locations. There is no diversity of EST isozyme banding pattern on each type of Xanthosoma that are found in different locations. There is a diversity of GOT isozyme banding pattern on each type of Xanthosoma found in different locations. Each sample has a banding pattern that is different from other samples. There is a diversity of POD
isozyme banding pattern on each type of Xanthosoma
found in different locations. Each sample has a different banding pattern with the other samples except sample 1 and 4 have the same banding pattern. There is a diversity of relevant between morphological characters and isozyme analysis. Characterization of Xanthosoma based on morphological characteristics consistent with the character-based markers isozyme terisasi EST,GOT and POD.
REFERENCES
Anggarwulan E, Solichatun, W Mudyantini. 2008. Physiology character of kimpul (Xanthosoma sagittifolium (L.) Schott) in the variation of shade and water availability. Biodiversitas 9 (4): 264-268. [Indonesia] Butt VS. 1980. Direct oxidases and related enzymes. In Stumpfand EK,
Conn EE (eds). The biochemistry of plants. Vol. 2. Academic Press. New York.
Cahyarini RD, Yunus A, Purwanto E. 2004. Identification of genetic diversity of some local varieties of soybean in Java based on isozyme analysis.Agrosains 6 (2): 79-83. [Indonesia]
Castillo FJ, Greppin H. 1986. Balance between anionic and cationic extracellular peroxidase activities in Sedum album leaves after ozone exposure. Analysis by high performance liquid chromatography. Physiologia Plantarum 68: 201-208.
Djukri. 2006. Plant character and tuber production of taro as intercropping plants under rubber stands. Biodiversitas 7 (3): 256-259. [Indonesia] Esaki B, Tsugita S, Matsumoto H. 1996. Expression of a moderately
anionic peroxidase is induced by aluminum treatment in tobacco cells: Possible involvement of peroxidase isozymes in aluminum ion stress. Physiologia Plantarum 96: 21-28
Felsenstein J. 1985. Confidence limits on phylogenies: an approach using the bootstrap. Evolution 39: 783-791.
Gaspar T, Penel C, Hagege D, Greppin H. 1991. Peroxidase in plant growth, differentiation, and development processes. In: Lobarzewski J, Greppin H, Penel C, Gaspar T (eds) Biochemical, molecular, and physiological aspects of plant peroxidases. University of Geneva. Geneva.
Groppa MD, Tomaro ML, Fernández ME. 1999. Activity and expression of peroxidases from sunflower: effect of development. Rev Bras Fisiol Vegetal 11(1): 55-59.
Hames BD, Rickwood D. 1990. A practical approach: gel electrophoresis protein. Robert E Krieger. Huntington.
Hartati NS, Mulyaningsih ES, Sudarmonowati E. 2001. Peroxidase in mature plants and seedlings of A. mangium, Paraserianthes falcataria
and Glycine max. Annales Bogorienses 8 (1): 17-23. [Indonesia]
Julisaniah NI, Sulistyowati L, Sugiharto AN. 2008. Relationship analysis of cucumber (Cucumis sativus L.) using RAPD-PCR and isozyme. Biodiversitas 9 (2): 99-102. [Indonesia]
Kusumo S, Khasanah M, Moeljopawiro S. 2002. Guide on characterization and evaluation of taro germplasm. Department of Agriculture, Agricultural Research and Development Agency, National Commission Germplasm. Jakarta. [Indonesia]
Lagrimini LM, Rothstein S. 1987. Tissue specificity of tobacco peroxidase isozymes and their induction by wounding and tobacco mosaic virus infection. Plant Physiol 84: 438-442
Lambers H, Chapin FS, Pons TL. 1998. Plant physiologycal ecology. Springer. New York.
Mohan R, Kolattukudy PE. 1990. Differential activation of expression of a suberization-associated anionic peroxidase gene in near-isogenic resistant and susceptible tomato strain by elicitors of Verticillium
albo-atrum. Plant Physiol 92: 276-280.
Odum E, Barrett GW. 2005. Fundamental of ecology. 5th ed. WB Saunders. Belmont, CA.
Rohlf EJ. 1993. NTSYS-pc: numerical taxonomy and mul- tivariate analysis system, version 1.80. Applied Biostatistics Inc. Setauket, New York.
Rothe GM. 1994. Electrophoresis of enzymes. Springer. Berlin.
Setianto A. 2001. Characterization of pimelo (Citrus grandis (L.) Obsbeck) in Subdistrict of Jepon and Jiken, Blora District based on isozyme and morphological marker fruit. [Thesis S1]. Faculty of Agriculture, Sebelas Maret University. Surakarta. [Indonesia] Sulistyono E, Sopandie D, Chozin MA, Suwarno. 1999. Adaptation to
shade of upland rice: morphological and physiological approach. Komunikasi Pertanian 4 (2): 62-68. [Indonesia]
Suranto. 1991. Studies of population variation in species of Ranunculus. [Thesis]. Departement of Plant Science, University of Tasmania. Hobart. Suranto. 2000. Electrophoresis studies of Ranunculus triplodontus
populations. Biodiversitas 1 (1): 1-7.
Suranto. 2001. Study on Ranunculus population: isozymic pattern. Biodiversitas 2 (1): 85-91.
Taiz L, Zeiger E. 1991. Plant physiology. Benyamin/Cumming. Tokyo. Tjitrosoepomo G. 2002. Plant Taxonomy; Spermatophytes. Gadjah Mada
University Press. Yogyakarta. [Indonesia]