STATISTIK
Minyak dan Gas Bumi
STATISTICS
O i l a n d G a s
Direktorat Jenderal Minyak dan Gas Bumi
Kementerian Energi dan Sumber Daya Mineral
Directorate General of Oil And Gas
Ministry of Energy and Mineral Resources
ST
ATISTIK
Minyak dan Gas Bumi
ST
ATISTIC
S
Oil and Gas2015
Dir
ekt
or
at Jender
al M
in
yak dan G
as Bumi
Kemen
ter
ian Ener
gi dan Sumber Da
ya M
iner
al
D
irector
ate G
ener
al of O
il A
nd G
as
M
inistr
y of Ener
gy and M
iner
al Resour
ces
Buk u Statistik M in yak dan G as Bumi Tahun 2015 merupak
an salah satu instrumen pen
yampaian
data dan inf
or
masi secara ber
kala mengenai per kembangan k eg iatanpengusahaan min yak
dan gas bumi di I
ndonesia. P
ublik
asi ini memuat
gambaran umum t entang k eg iatan pengusahaan migas dar i hulu , hilir , hingga penunjang .
Beberapa data juga ditampilk
an dalam bentuk
peta-peta untuk memper
ka
ya visual dan pemahaman
ter
hadap k
eg
iatan pengusahaan migas
. S eir ing dengan meningk atn ya k ebutuhan k onsumen data, buk u statistik min
yak dan gas bumi ak
an t
erus
mengalami pen
yempur
naan baik struktur maupun
muatann
ya.
Buk
u statistik min
yak dan gas bumi ini diharapk
an dapat member ik an manfaat bag i ban yak pihak untuk ber bagai k eper luan. P ublik
asi ini dapat
ter
wujud ber
kat k
erja sama dan par
tisipasi dar i ber bagai pihak . Dalam k esempatan ini, k ami men yampaik an penghar gaan dan t er ima k asih k
epada semua pihak
yang t elah member ik an k ontr ibusi secara n yata, ser ta member ik an masuk an-masuk an yang berar ti sehingga buk u ini dapat t ersusun. Buk
u ini dapat dilihat dalam w
ebsit e Dir ekt orat Jenderal M in yak dan G as Bumi melalui, http://w w w . migas .esdm.go .id/ . Saran dan k ritik membangun untuk pener bitan selanjutn ya dapat disampaik an melalui e-mail: h ttp://mail .migas .esdm.go .id . O il a nd G as St at ist ics 2 01 5 b oo k s erv es a s a n in str um en t to co nv ey d at a a nd in fo rm at io n o n a re gu la r b as is a bo ut ye arl y p ro gre ss o f o il a nd g as ex plo ita tio n i n I nd on es ia . T his p ub lic at io n c on sis ts of ge ne ra l o ve rv iew o n o il a nd g as ex plo ita tio n ac tiv itie s, f ro m u ps tre am , d ow ns tre am , to su pp or tin g s ec to r. So m e d at a a re d isp la ye d i n m ap s fo rm to en ric h vis ua ls a nd u nd ers ta nd in g o n o il a nd g as ex plo ita tio n a cti vit ies. A lo ng w ith in cre m en ta l n ee ds of da ta u se rs, th is b oo k o f O il & G as St at ist ics w ill b e co nt in uo us ly i m pro ve d b ot h i n s tru ctu re , c on te nt an d a lso p re se nt at io n. Th ro ug h t his p ub lic at io n, w e a im to p ro vid e be ne fits fo r v ari ou s p ar tie s in b ro ad es t p os sib le ut iliz at io n. T his p ub lic at io n c an b e r ea liz ed th an ks to co op era tio n a nd p ar tic ip at io n o f v ari ou s p ar tie s. H ere by , w e’d lik e t o e xp re ss o ur hig he st a pp re cia tio n an d g ra tit ud e t o a ll p ar tie s w ho h av e c on trib ut ed sin ce th e b eg in nin g o f th e p ro jec t, a s w ell as pro vid in g v alu ab le i np ut s fo r c om po sin g t his b oo k. Th is b oo k is a lso a va ila ble fo r d ow nlo ad o n w eb sit e o f G en era l D ire cto ra te o f O il a nd G as htt p: / /w w w .m ig as. es dm .g o.i d/ . Su gg es tio n a nd in pu ts f or up co m in g p ub lic at io n c an b e a dd re sse d to http: //mail .migas .esdm.go .id .
KATA PENGANTAR |
Introduction PENGARAH | Sup er visor Sek retar is Dir ekt orat J enderal M in yak dan G as Bumi Secr etar y of D irector ate G ener al of O il and G as PENANGGUNG JAWAB Edit or In Chief Kepala Bag ian Rencana dan Laporan
Head of P
lanning and Repor
t D ivision EDITOR | Edit or
Kepala Sub Bag
ian E valuasi dan Laporan Sub -D ivision Head of E valuation and Repor t TIM PENYUSUN | W rit er r4JOUB" HVTUJOBr 8 VMBO4JUBSBINJ r. PDIBNBE* NS POr"OHH J." ES JB XBO r& EXBS E( PSBTJOBUSBr4BOUJ 8 JEJBTBS J r3 J[L Z"NBMJB 8 JTNBTIBOUJr/VSVM. VIBNNBE r)FSV 8 JOEJBS UPr* SGBO/ JSWBOEB r* SB XBO& LP1 SBTFU ZBOU Pr 8 JOEB :VOJUB r# FOO Z 5BNCVTFr' BINJ. VLUBñr 8 JZ POP r# FOJ)FOES JZBOU P4VQS JZBEJr4 ZBISVM1 SBUBNB r/BEJB-BJMBr :FOJ1 VTQJUBTBS Jr3 JB, JTXBOEJOJ r. BHIñSBOJr" HVOH/VH SPIP r.#IBSBUB1 VS OBNB1 VUSBr 5JP"OHHFS1 SBUBNB r3 JEIP1 SBEBOB. BIBQVUSB PENTERJEMAH | Tra nsla tor Sularsih Jak ar ta, 2016 D irektur Jender al M igas IGN W ira tmaja Dir ekt orat J enderal M in yak dan G as Bumi Kement er ian Ener gi dan Sumber Da ya M ineral 4
ST
ATISTIK
Minyak dan Gas Bumi
2015 2015
ST
ATISTICS
Oil and Gas 5 Dir ec torat e General of Oil And G
as M inistr y of Ener gy and M ineral R esour ces
K
AT
A PENGANT
AR
|
INTR
ODUCTION
RINGK
ASAN D
AT
A
|
DA
TA SUMMAR
Y
IKHTISAR
|
O
VER
VIE
W
HUL
U
|
UPSTREAM
PENAND AT ANGANAN WILA YAH KERJA K ONVENSIONAL MIGAS 2011-2015 Signing of O il and G as C onv entional W ork ing A reas 2011-2015 PENAND AT ANGANAN WILAYAH KERJA NON K
ONVENSIONAL MIGAS 2011-2015 Signing of O il and G as Unc onv entional W ork ing A rea 2011-2015 INVEST ASI HUL U MIGAS 2011-2015 O il and G as Upstr eam Inv estment 2011-2015 CAD ANGAN MIN
YAK BUMI INDONESIA
2011-2015
Indonesian Crude O
il Reser
ve 2011-2015
CAD
ANGAN GAS BUMI INDONESIA 2011-2015
ndonesian G as Reser ve 2011-2015 GR AFIK SUR VEI SEISMIK 2D (k m) 2011-2015 Char t of 2D (k m) S eismic Sur ve y 2011-2015 GR AFIK SUR VEI SEISMIK 3D (k m 2 ) 2011-2015 Char t of 3D (k m 2 ) S eismic Sur ve y 2011-2015 GR AFIK PEMBOR AN SUMUR EKSPL OR ASI 2011-2015 Char t of D rilling of Explor ator y W ells 2011-2015 PR ODUKSI D AN PEM ANF AA TAN GAS BUMI 2015
Production and Utiliz
ation of Natur al G as 2015 GR AFIK PR ODUKSI D AN PEM ANF AA TAN GAS BUMI 2011-2015 Char t of P
roduction and Utiliz
ation of Natur al G as 2011-2015
3
5
6
11
12 13 14 15 16 17 17 19 20 24 PR ODUKSI MIN YAK MENT AH D AN KONDENSA T 2015 Production of Crude O il and C ondensate 2015 GR AFIK PR ODUKSI MIN YAK MENT AH D AN K ONDENSA T 2011-2015 Char t of P roduction of Crude O il and C ondensate 2011-2015 HAR GA MIN YAK MENT AH INDONESIA 2015 Indonesian Crude O il P ric e 2015 PERKEMBANGAN HAR GA MINYAK INDONESIA & MIN
YAK UT A M A DUNIA ( JANU
ARI 2015 – DESEMBER 2015/ HARIAN)
Pric
e D
ev
elopments of Indonesian Crude O
il & W
orld Major Crude
O il (D ec ember 2015 - D ec ember 2015 / D aily)
HILIR
|
DO
WNSTREAM
INVESTASI HILIR MIGAS 2011-2015
O il and G as D ownstr eam Inv estment 2011-2015 GR AFIK INVEST
ASI HILIR MIGAS 2011-2015
Char t of O il and G as D ownstr eam Inv estment 2011-2015 PENGOLAHAN MIN YAK MENT AH INDONESIA 2011-2015 Indonesian Crude O il P roc essing 2011-2015 GR
AFIK PENGOLAHAN MIN
YAK MENT AH INDONESIA 2011-2015 Char t of Indonesian Crude O il P roc essing 2011-2015
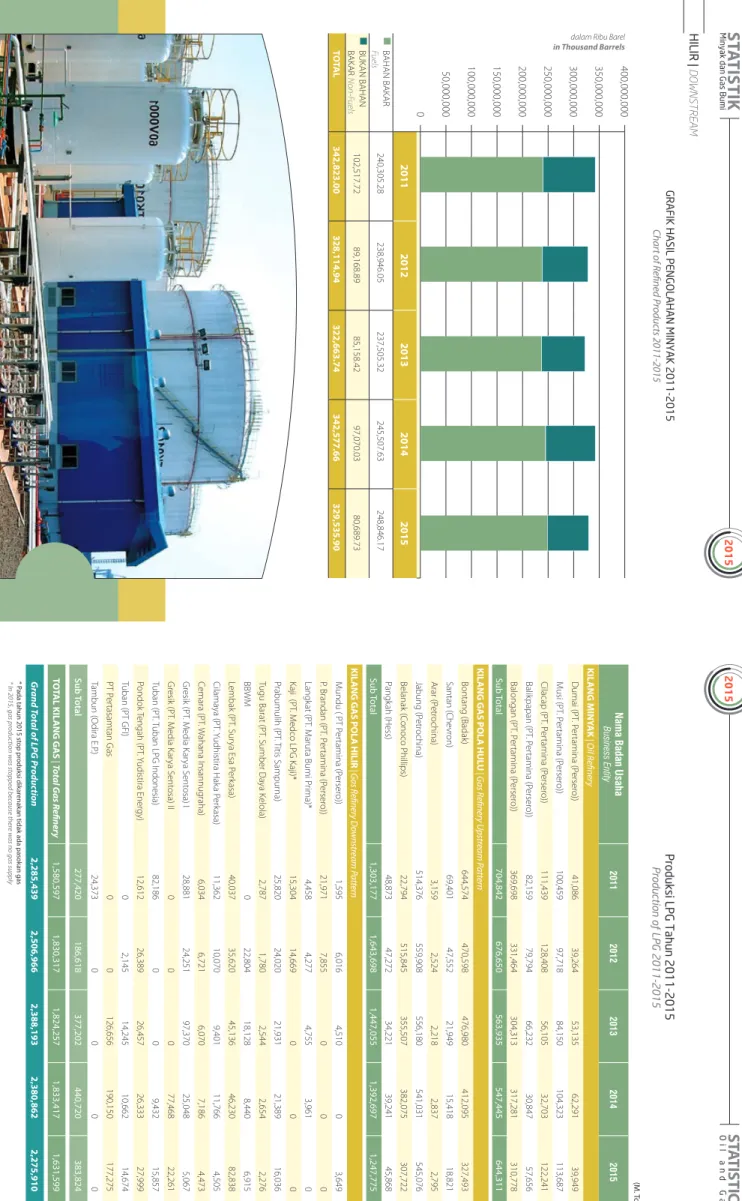
HASIL PENGOLAHAN MIN
YAK INDONESIA 2011-2015
Indonesian Refined P
roducts 2011-2015
GR
AFIK HASIL PENGOLAHAN MIN
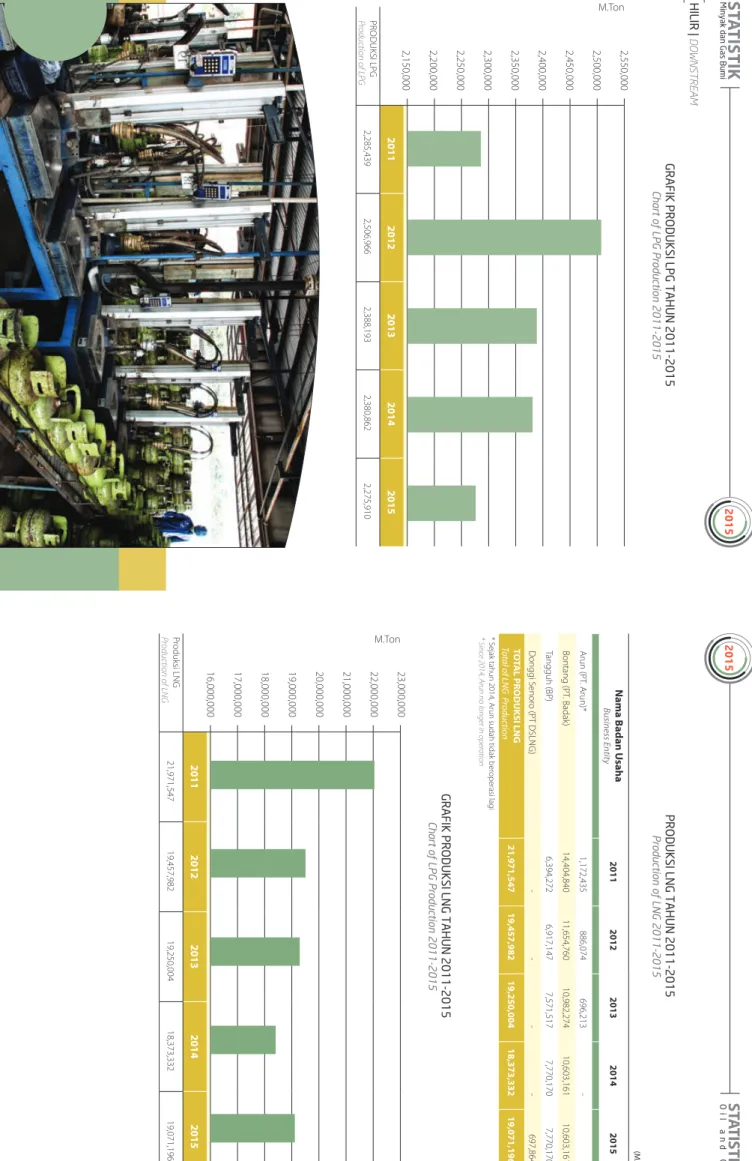
YAK 2011-2015 Char t of Refined P roducts 2011-2015 PR ODUKSI LPG TAHUN 2011-2015 Production of LPG 2011-2015 GR AFIK PR ODUKSI LPG TAHUN 2011-2015 Char t of LPG P roduction 2011-2015 26 27 28 30
32
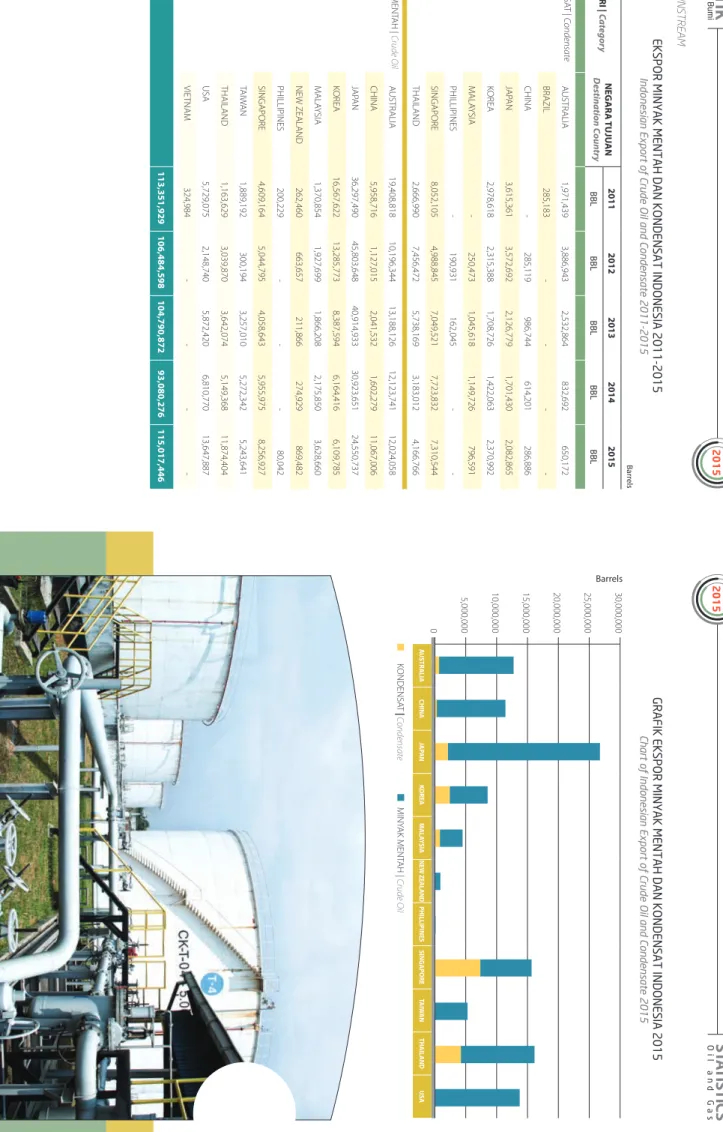
33 33 34 34 35 38 39 40 PR ODUKSI LNG TAHUN 2011-2015 Pr od uc tio n o f L N G 20 11 -2 01 5 GR AFIK PR ODUKSI LNG TAHUN 2011-2015 Char t of LPG P roduction 2011-2015 EKSPOR MIN YAK MENT AH D AN K ONDENSA T INDONESIA 2011-2015 Indonesian Expor t of Crude O il and C ondensate 2011-2015 G RA FIK EK SP O R M IN YA K M EN TA H D A N K O N D EN SA T INDONESIA 2015 Char t of Indonesian Expor t of Crude O il and C ondensate 2015 IMPOR MIN YAK MENT AH PER NEGAR A ASAL 2011-2015 Crude O il Impor ts b y C ountr y 2011-2015 EK SP O R B A H A N B A KA R M IN YA K IN D O N ES IA 2 01 1-2 01 5 Indonesian Expor t of F uel 2011-2015 IM PO R B A H A N B A KA R M IN YA K IN D O N ES IA 2011-2015 Indonesian Impor t of F uels 2011-2015 IMPOR LPG INDONESIA 2011-2015 Indonesian Impor t of LPG 2011-2015 EKSPOR LPG INDONESIA 2011-2015 Indonesian Expor t of LPG 2011-2015 EKSPOR PR ODUK KILANG 2011-2015 Indonesian Expor ts of Refiner y P roducts 2011-2015 EK SP O R L N G P ER N EG A RA TU JU A N 2011-2015 Expor t of LNG b y D estination C ountr y 2011-2015 REALISASI PENJU ALAN BBM DI SEL URUH INDONESIA 2011-2015 Indonesian S ales of F uel Realiz ation 2011-2015 PENJU ALAN LPG INDONESIA 2011-2015 PENJU AL AN LPG INDONESIA 2011-2015 Indonesian S ales of LPG 2011-2015 41 41 42 43 44 45 45 46 46 46 47 48 48PENUNJANG
|
SUPPOR
TING
CA PA IA N TK D N PA D A K EG IA TA N U SA H A H U LU M IG A S 2010-2015 Char t of L oc al Content Usage in Upstr
eam O il and G as A ctivities 2010-2015 DA TA ST AT IST IK SU RA T K ET ER A N G A N TE RDA FT A R 2 01 1-2 01 5 Statistic O f Register ed C er tific ate 2011-2015 DA TA TU M PA H A N M IN YA K 2 01 1-2 01 5 Statistic of O il Spill 2011-2015 D AT A K EC EL A KA A N K ER JA K EG IA TA N HUL U MIGAS 2011-2015 Statistic of A ccident in Upstr eam O il and G as A ctivities 2011-2015 DA TA K EC EL A KA A N K ER JA K EG IA TA N H ILIR M IG A S 2 01 1-2 01 5 Statistic of A ccident in D ownstr eam O il A nd G as A ctivities 2011-2015 RA N CA N G A N ST A N D A R K O M PE TE N SI K ER JA N A SIO N A L INDONESIA BID ANG MIGAS TA H U N 2 01 5 Dr aft o f In do ne sia n N ati on al W ork C om pe ten cy St an da rd 20 15 RA N CA N G A N ST A N D A R N A SIO N A L IN D O N ES IA B ID A N G MIGAS TAHUN 2015 Dr aft o f In do ne sia n N ati on al S ta nd ard 20 15
PE
TA
TEM
ATIK
|
THEMA
TIC MAP
PE TA C A D A N G A N M IN YA K B U M I IN D O N ES IA (ST ATUS 1 JANU ARI 2015)Map of Indonesia Crude O
il Reser ve (Status in 1 Januari 2015) PE TA C A D A N G A N G A S B U M I IN D O N ES IA (ST ATUS 1 JANU ARI 2015) Map of Indonesia G as Reser
ves (Status in 1 Januari 2015)
PE TA PO TENSI GAS ME THANA BA TUBAR A CBM Resour
ces & Shale G
as P otential PE TA C EK U N G A N H ID RO KA RB O N IN D O N ES IA Map of H ydr oc
arbons Basin Indonesia
PE
TA INFR
ASTRUK
TUR GAS BUMI 2015-2030
Map of G as Infr astructur e 2015-2030 PE TA KILANG MIN YAK DI INDONESIA Map of O il Refiner y in Indonesia PE TA KILANG LPG D AN LNG DI INDONESIA
Map of LPG and LNG Refiner
y in Indonesia
D
AFT
AR ISTIL
AH D
AN L
AMPIR
AN
GL
OSSARIUM AND APPENDICES
49
50 51 52 53 54 55 2657
58 59 60 61 62 64 6566
Dir ekt orat J enderal M in yak dan G as Bumi Kement er ian Ener gi dan Sumber Da ya M ineral 6ST
ATISTIK
Minyak dan Gas Bumi
2015 2015
ST
ATISTICS
Oil and Gas 7 Dir ec torat e General of Oil And G
as M inistr y of Ener gy and M ineral R esour ces
Ringkasan Data |
Data Summary
Ikhtisar |
Overview
No . Ka tegori | Cat egor y N ilai | Amount Sa tuan | Unit 1 In vestasi Hulu M igas | Upstr eam O il and G as Inv estments 15,312.68 Juta US$ 2 Cadangan M in yak Bumi | Crude O il Reser ve 7,305.02 MMSTB 3 Cadangan G as Bumi | G as Reser ve 151.33 54$' 4 Sur vei S eismik 2D (k m) | 2D S eismic Sur ve y (k m) 3,934.00 km 5 Sur vei S eismik 3D (k m 2 ) | 3D S eismic Sur ve y (k m 2 ) 3,347.00 km 2 6 Pemboran Sumur E ksplorasi | D rilling of Explor ator y W ells 67 sumur 7 Produksi G as Bumi | Natur al G as P roduction 8,077.71 ..4$'% 8 Pemanfaatan G as Bumi | Utiliz ation of Natur al G as 7,329.14 ..4$'% 9 Produksi M in yak dan K ondensat | P roduction of Crude O il and Condensate 785,792 BOPD 10 ICP R ata-rata ( Januar i '15 s/d D esember '15) | Av erage of Indonesian Crude O
il P ric e ( Januar y 2015 until D ec ember 2015) 49.21 US$/Bar el 11 *O WFTUBTJ) JMJS. JHBT] O il and G as D ownstr eam Inv estment 2,617.77 Juta US$ 12 )BTJM1 FOHPMBIBO. JO ZBL. FOUBI ##./PO##. Crude O il P roc
essing Results (fuel + Non-F
uel) 329,535.90 Ribu Bar el 13 Produksi LPG | Production of LPG 2,275,910 M.T on 14 1SPEVLTJ-/(] Production of LNG 19,071,196 M.T on 15 Ekspor M in yak M entah | Expor t of Crude O il 115,017,446 Bar el 16 Impor M in yak M entah | Impor t of Crude O il 136,665,881 Bar el 17 Ekspor BBM | Expor t of F uel 317,480 Kilolit er 18 Impor BBM | Impor t of F uel 27,898,244 Kilolit er 19 Penjualan BBM | Sales of F uel 67,509,826 Kilolit er 20 Ekspor LPG | Expor t of LPG 392 M.T on 21 Impor LPG | Impor t of LPG 4,025,600 M.T on 22 Penjualan LPG | Sales of LPG 6,376,990 M.T on 23 Ekspor P roduk K ilang | Expor ts of Refiner y P roducts 3,459,642 Kilolit er 24 <QPS-/(] Expor t of LNG 811,043,009 MMB TU 25 Data Tumpahan M in yak | Statistic of O il Spill 875 Bar el 26 %BUB, FDFMBL BBO)VMV] Statistic of A ccident in Upstr eam O il and G as A ctivities 273 Kejadian 27 %BUB, FDFMBL BBO) JMJS] Sta tis tic o f A cc id en t in D ow ns tre am Oi l a nd Ga s A ctiv itie s 11 Kejadian
Tahun 2015 menjadi tahun k
ebimbangan bag i industr i NJHBTOBTJPOBM )BS HBNJO ZBLEVOJBTFCBHBJJTVVUBNB yang menunjuk
kan gejala penurunan di ak
hir tahun 2014, ber dampak t er hadap tr end per gerak an har ga min yak I ndonesia pada k urun waktu J anuar i hingga D
esember 2015, yang pada ak
hir
nya ber
dampak
pula t
er
hadap hampir seluruh k
eg
iatan pengusahaan
min
yak dan gas bumi di I
ndonesia. Per gerak an ICP ( Indonesia Crude P ric e ) selama k urun waktu J anuar i-D esember 2015 menunjuk kan fl uktuasi yang tidak t er
duga. ICP sempat menunjuk
kan tr end positif pada k urun waktu J anuar i s .d . M ei hingga men yentuh angk
a rata-rata ICP US$ 61,86 per bar
el
,
namun pada ak
hir
nya menurun secara per
lahan dan
ter
puruk pada D
esember 2015 dengan angk
a rata-rata
ICP sebesar US$ 35,47 per bar
el . Th e m ov em en t o f IC P ( In do ne sia C ru de P ric e) i n Ja nu ar y t o D ec em be r 2 01 5 p eri od sh ow ed u ne xp ec te d flu ctu at io ns. IC P h ad sh ow n a p os itiv e t re nd in fro m Ja nu ar y t o M ay p eri od a nd re ac he d o f th e a ve ra ge IC P fig ure o f U S$ 61 .8 6 p er b arr el. H ow ev er, at th e e nd h as be en st ea dil y d ec lin in g a nd in D ec em be r 2 01 5 d ro pp ed at a ve ra ge IC P a t U S$ 35 .4 7 p er b arr el. Th e y ea r 2 01 5 w as kn ow n a s y ea r fu ll o f u nc ert ain tie s fo r n at io na l o il a nd g as in du str y. T he d ow nw ard tre nd of w orl d o il p ric es in th e e nd o f 2 01 4 b ec am e o ne o f th e m ain is su es th at h ad a n i m pa ct o n o il p ric e m ov em en t in In do ne sia b etw ee n J an ua ry to D ec em be r 2 01 5. A t th e e nd , th e t re nd im pa cte d a lm os t a ll o f o il a nd g as
exploitation activities in Indonesia.
Dir ekt orat J enderal M in yak dan G as Bumi Kement er ian Ener gi dan Sumber Da ya M ineral 8
ST
ATISTIK
Minyak dan Gas Bumi
2015 2015
ST
ATISTICS
Oil and Gas 9 Dir ec torat e General of Oil And G
as M inistr y of Ener gy and M ineral R esour ces
Trend penurunan har
ga t
ersebut antara lain
disebabk
an oleh hal-hal sebagai ber
ik ut: 1. Per lambatan per tumbuhan per ek onomian global terutama Tiongk ok yang merupak an negara konsumen min
yak mentah utama.
2. Terus meningk atn ya pr oduksi min yak mentah "NFS JL B4 FS JL BUEBOOFHBSBOFHBSBOPO 01&$ 3. Kelebihan pasok an min
yak mentah global
, salah satun ya ak ibat peningk atan pasok an I ran sejak dicabutn ya embar go t er hadap I ran. 4. M asih r endahn ya per mintaan min yak mentah EJL BXBTBO&S PQBEBO" TJBL IVTVTO ZB* OEJBEBO Tiongk ok . Rendahn
ya nilai rata-rata ICP t
entun ya ber dampak ter hadap k eg
iatan pengusahaan min
yak dan gas bumi
terutama di sekt or hulu . B eberapa K ontrakt or K ontrak
Kerja Sama (KKKS) ber
eaksi dengan mer
evisi r
encana
kerja (
w
ork plan & budget
) yang ber dampak t er hadap menurunn ya nilai in vestasi k eg
iatan hulu dan k
eg
iatan
eksplorasi.
Bila dibandingk
an dengan tahun-tahun sebelumn
ya,
nilai in
vestasi tahun 2015 sebesar US$ 15.312,68
juta mengalami penurunan seban
yak 24,87% dibandingk an tahun 2014, t er besar selama k urun
waktu lima tahun t
erak
hir
. K
eg
iatan eksplorasi tahun
2015 menunjuk
kan potr
et yang sama di mana
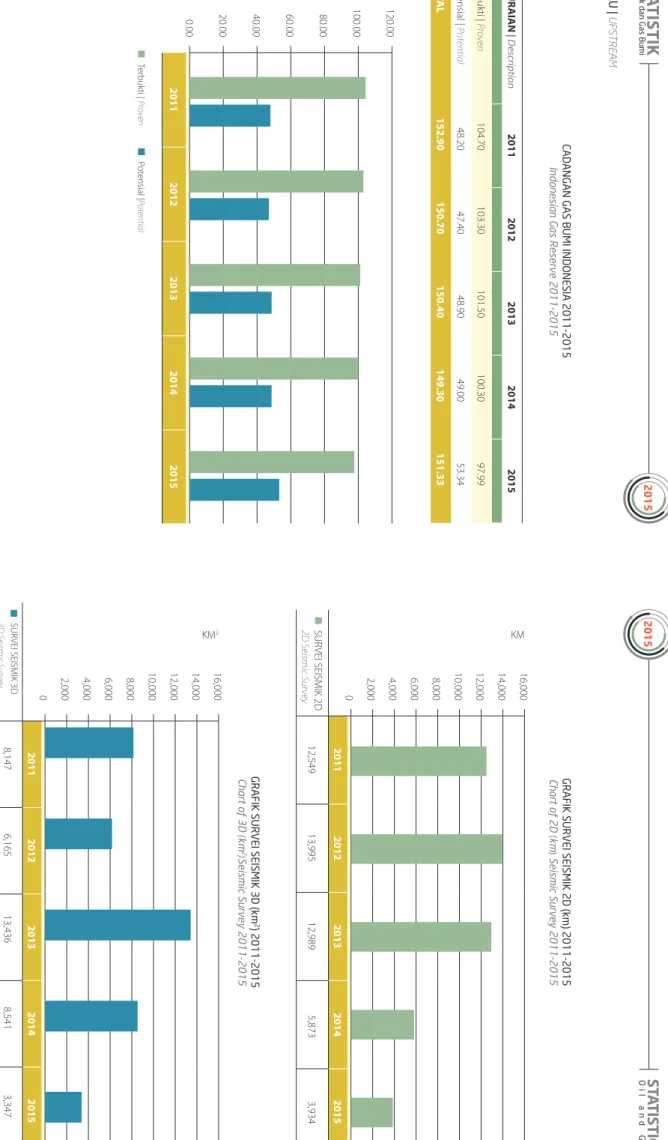
keg iatan seismik 2D (k m) menunjuk kan penurunan seban yak 33,02%, k eg iatan seismik 3D (k m 2 ) menunjuk
kan penurunan seban
yak 60,81%, dan
realisasi pemboran sumur eksporasi menunjuk
kan penurunan seban yak 19,27% dibandingk an tahun 2014. P enurunan k eg iatan eksplorasi t entun ya ber dampak k epada sulitn ya penemuan cadangan baru . Ter
catat pada tahun 2015 t
erjadi penurunan
cadangan t
er
bukti min
yak bumi sebesar 21,97 MMSTB
(-0,61%) dan penurunan cadangan t
er
bukti gas bumi
TFCFTBS
54$'
Sementara itu
, pr
oduksi migas pada dasar
nya mendapatk an ef ek yang r elatif k ecil dik ar enak an
penurunan alami yang t
elah t erjadi ber tahun-tahun yang lalu , di samping upa ya-upa ya yang t elah Th e d ec lin in g t re nd in p ric es p ar tly d ue to th e f oll ow in g matters: 1. Slo w in g g lo ba l e co no m ic g ro w th , e sp ec ia lly C hin a as the main c
onsumer of crude oil
. 2. Co nt in ue d i nc re as e o f c ru de o il p ro du cti on o f U nit ed St at es a nd n on -O PE C c ou nt rie s. 3. Ex ce ss g lo ba l s up ply o f c ru de o il, d ue to in cre as in g su pp ly f ro m Ira n s in ce th e li ftin g o f e m ba rg o against Ir an. 4. Lo w cr ud e o il d em an d i n E uro pe a nd A sia , par ticularly fr
om India and China.
Th e lo w va lu e o f th e a ve ra ge IC P o bv io us ly h ad a n im pa ct o n o il a nd g as ex plo ita tio n a cti vit ies, es pe cia lly in th e u ps tre am se cto r. S om e o f th e C on tra cto rs o f Co op era tio n C on tra ct ( PS C ) re ac te d b y r ev isin g t he w ork p la n a nd b ud ge t. S uc h a cti on s h ad a ff ec te d o n th e d ec lin in g v alu e o f in ve stm en ts i n u ps tre am se cto r es pe cia lly ex plo ra tio n a cti vit ies. Co m pa re d t o p re vio us ye ar s, t he va lu e o f in ve stm en ts in 2 01 5 a m ou nt ed to U S$ 15 ,3 12 .6 8 m illi on d ec re as ed by 2 4.8 7% co m pa re d t o 2 01 4. I t w as th e la rg es t de cre as e in la st f ive ye ar s p eri od . E xp lo ra tio n a cti vit y in 2 01 5 r efl ec te d t he sa m e p ict ur e. T he a cti vit y o f 2 D se ism ic ( km ) d ec re as ed b y 3 3.0 2% , w hil e 3 D se ism ic ac tiv itie s ( km 2) de cre as e b y 6 0.8 1% . R ea liz at io n o f dr illi ng ex plo ra tio n w ell s s ho w ed a d ec re as e o f 1 9.2 7% co m pa re d t o 2 01 4. T he d ec lin e in ex plo ra tio n a cti vit ies w ou ld m ak e d isc ov ery o f n ew re se rv es m or e d iffi cu lt. Re co rd ed in 2 01 5, t he d ec lin e in th e p ro ve n r es erv es of oil a m ou nt ed to 2 1.9 7 M M ST B ( -0 .6 1% ) a nd a re du cti on in p ro ve n n at ura l g as re se rv es o f 2 .3 1 T SC F (-2.30%). M ea nw hil e, o il a nd g as p ro du cti on b as ica lly g et a re la tiv ely sm all ef fe ct du e t o t he n at ura l d ec lin e t ha t ha s o cc ur re d m an y y ea rs a go, d es pit e t he ef fo rts m ad e b y t he g ov ern m en t t o p ur su e o il a nd g as dilak uk an oleh pemer
intah untuk mengejar tar
get pr oduksi migas . Ter catat pr oduksi min yak mentah dan k
ondensat tahun 2015 mengalami penurunan
sebesar 2,98 r ibu bar el per har i (-0,38%) dibandingk an pr oduksi tahun 2014. S edangk an pr
oduksi gas bumi
tahun 2015 mengalami penurunan sebesar 140,16
..4$'% EJCBOEJOHL
BOQS
PEVLTJUBIVO
Sekt
or hilir migas memilik
i pendek
atan yang ber
beda dengan sekt or hulu , di mana per gerak an data biasan ya
dipengaruhi oleh tingk
at k
onsumsi atau penjualan
bahan bak ar min yak (BBM) dan LPG. S ecara agr egat , pr od uc tio n t arg et. R ec or de d p ro du cti on o f c ru de o il an d c on de ns at e in 2 01 5 d ec re as ed b y 2 .9 8 t ho us an d ba rre ls p er da y ( -0 .3 8% ) c om pa re d t o p ro du cti on in 20 14 . M ea nw hil e, n at ura l g as p ro du cti on in 2 01 5 de cre as ed b y 1 40 .1 6 M M SC FD (-1.7 1% ) c om pa re d t o pr oduction in 2014. D ow ns tre am se cto r s ho w s d i ff ere nt p ro gre ss t ha n th e u ps tre am se cto r. T he m ov em en t o f d at a i s u su all y in flu en ce d b y t he le ve l o f c on su m pt io n o r fu el o il ( BB M ) an d L PG sa les. In a gg re ga te , th e d at a f ue l s ale s in 2 01 5 Ikhtisar | Overview Dir ekt orat J enderal M in yak dan G as Bumi Kement er ian Ener gi dan Sumber Da ya M ineral 10
ST
ATISTIK
Minyak dan Gas Bumi
2015 2015
ST
ATISTICS
Oil and Gas 11 Dir ec torat e General of Oil And G
as M inistr y of Ener gy and M ineral R esour ces
data penjualan BBM tahun 2015 sebesar 67.509.826 Kilolit er menurun 4,57% dar i tahun sebelumn ya yaitu sebesar 70.744.978 K ilolit er
, hal ini dik
ar enak an per lambatan ek onomi yang t
erjadi pada tahun
/BNVOEFNJL JBOTFJS JOHQFODBCVUBOTVCTJEJ #FOTJOKFOJT3 0/U FSKBEJQFOJOHL BUBOL POTVNTJ #FOTJOKFOJT3 0/EBO3 0/TFDBSBTJH OJñL BO)BM tersebut ber
banding lurus dengan tr
end angk a yang EJUVOKVL LBOPMFI)BTJM1 SPEVL, JMBOHEBOL FH JBUBO *NQPS##.QBEB# FOTJOKFOJT3 0/EBO3 0/ 1FOKVBMBO# FOTJOKFOJT3 0/QBEBUBIVO membuk uk an catatan k enaik an sebesar 1.699.035 Kilolit er atau 159,85% dar i tahun sebelumn ya. 4FEBOHL BOQFOKVBMBO# FOTJOKFOJT3 0/QBEBUBIVO 2015 membuk uk an catatan k enaik an sebesar 123.870 Kilolit er atau 79,97% dar i tahun sebelumn ya. Sejak dilaksanak ann ya pr og ram k on versi M in yak Tanah
ke LPG yang dimulai pada tahun 2009, penjualan LPG
nasional mengalami tr
end yang t
erus meningk
at.
Ter
catat pada tahun 2015, penjualan LPG meningk
at sebesar 4,66% dar i 6.093.138 Mt on di tahun 2014 menjadi 6.376.990 Mt on di tahun 2015. P eningk atan tersebut diser
tai dengan peningk
atan impor LPG
pada tahun 2015 sebesar 11,69% dibandingk
an tahun
sebelumn
ya. P
eningk
atan persentase angk
a impor
LPG lebih besar dar
i peningk atan angk a persentase penjualan LPG dik ar enak an pr oduksi LPG tahun 2015
mengalami penurunan dibandingk
an pr
oduksi LPG
tahun 2014 sebesar 104.952 Mt
on.
Di sisi lain, per
kembangan data ekspor min
yak NFOUBIEBO-/(DFOEFSVOHTUBCJMEJL BS FOBL BO LFH JBUBOFLTQPSNJO ZBLNFOUBIEBO-/(NFOH JL VUJ sk ema k ontrak jangk a panjang . K endati har ga ICP ter
puruk sepanjang tahun 2015, ekspor min
yak
mentah tahun 2015 mengalami peningk
atan y g DVL VQTJH OJñL BOZBJUVTFCBO ZBLBUBVTFCFTBS 21,93 juta bar el dibandingk an tahun sebelumn ya. 4FNFOUBSBJUVFLTQPS-/(UBIVONFOVSVOUJQJT 2,78% dibandingk an tahun sebelumn ya mesk ipun QS PEVLTJ-/(NFOHBMBNJL FOBJL BO)BMJOJEJTFCBCL BO oleh k ebijak an pemer
intah yang mempr
ior itask an QFOHHVOBBO-/(VOUVLEPNFTUJL am ou nt ed to 6 7,5 09 ,8 26 kil oli te rs d ec re as ed 4 .5 7% fro m th e p re vio us ye ar w hic h a m ou nt ed to 7 0,7 44 ,9 78 kilo lite rs. Th is i s d ue to th e e co no m ic s lo w do w n t ha t oc cu rre d i n 2 01 5. H ow ev er, as th e r em ov al o f s ub sid ies on g as oli ne ty pe R O N 8 8, t he co ns um pt io n o f R O N 9 2 and R ON 95 gasoline t
ypes has signific
antly incr eased . I t is d ire ctl y p ro po rtio na l to th e t re nd o f R efi ne ry P ro du cts as w ell as im po rt a cti vit y f or RO N 9 2 a nd R O N 9 5 f ue l ty pe s. S ale s n um be r o f g as oli ne ty pe s o f R O N 9 2 in 2 01 5 re co rd ed in cre m en ta l o f 1 ,6 99 ,0 35 kil oli te rs, o r 1 59 .8 5% fro m th e p re vio us ye ar, w hil e s ale s o f R O N 9 5 g as oli ne ty pe s in 2 01 5 r ec ord ed in cre m en ta l o f 1 23 8 70 kil oli te rs, or 79.97% fr om the pr evious y ear . Sin ce th e im ple m en ta tio n C on ve rsio n P ro gra m o f ke ro se ne to LP G w hic h h as st ar te d i n 2 00 9, s ale s o f L PG na tio nw id e e xp eri en ce a n i nc re as in g t re nd . R ec ord ed in 2 01 5, L PG sa les in cre as ed b y 4 .6 6% fro m 6 ,0 93 ,1 38 m etr ic t on in 2 01 4 t o 6 .3 76 99 m illio n m etr ic t on s in 20 15 . T he in cre as e w as co nc urr en t w ith in cre as e o f L PG im po rts in 2 01 5 a m ou nt ed to 1 1.6 9% co m pa re d t o t he pre vio us ye ar. Th e p erc en ta ge o f in cre as e in im po rte d LP G w as g re at er t ha n t he p erc en ta ge o f in cre as e in LP G sa les, b ec au se LP G p ro du cti on in 2 01 5 d ec re as ed co m pa re d t o t he p ro du cti on o f L PG in 2 01 4 a m ou nt ed to 104 952 metric ton. O n t he o th er h an d, c ru de o il a nd LN G ex po rt de ve lo pm en t te nd s t o b e s ta ble d ue to th e e xp or t sc he m e o f lo ng -te rm co nt ra cts fo r th em . A lth ou gh IC P dro pp ed th ro ug ho ut 2 01 5, c ru de o il e xp or ts i n 2 01 5 in cre as ed sig nifi ca nt ly b y 2 3.5 6% o r 2 1.9 3 m illio n b arr els co m pa re d t o t he p re vio us ye ar. M ea nw hil e L N G ex po rts in 2015 slightly decr
eased 2.78% than the pr
evious y ear de sp ite th e in cre as e o f L N G p ro du cti on . T his is d ue to go ve rn m en t p oli cie s t ha t p rio rit ize th e u se o f L N G fo r domestic usage .
ST
ATISTIK
Minyak dan Gas Bumi
ST
ATISTIC
S
Oil and Gas2015
Dir
ekt
or
at Jender
al M
in
yak dan G
as Bumi
Kemen
ter
ian Ener
gi dan Sumber Da
ya M
iner
al
D
irector
ate G
ener
al of O
il A
nd G
as
M
inistr
y of Ener
gy and M
iner
al Resour
ces
HUL
U
UPSTREAM
Ikhtisar | Overview Dir ekt orat J enderal M in yak dan G as Bumi Kement er ian Ener gi dan Sumber Da ya M ineral 12ST
ATISTIK
Minyak dan Gas Bumi
PENANDATANGANAN WILAYAH KERJA KONVENSIONAL MIGAS 2011-2015 S ig n in g o f O il a n d G a s C o n v e n tio n a l W o rk in g A re a s 2 0 1 1 -2 0 1 5 2011 2012 2013 2014 2015 1&/"/% "5 "/("/"/ ,0/53",#"36 Ne w C ontr act Signed 27 13 13 7 8 #0/64] Sign Bonus 72,530,152 16,200,076 14,500,000 8,000,000 9,000,000 30 25 20 15 10 5 0 80,000,000 70,000,000 60,000,000 50,000,000 40,000,000 30,000,000 20,000,000 10,000,000 0 US$ Jumlah Kontrak Number of Contracts HULU | UPSTREAM
PENANDATANGANAN WILAYAH KERJA NON KONVENSIONAL MIGAS 2011-2015
Signing of Oil and Gas Unconventional Working Area 2011-2015
2011 2012 2013 2014 2015 1&/"/% "5 "/("/"/ ,0/53",#"36 Ne w C ontr act Signed 19 12 1 0 4 #0/64] Sign Bonus 23,060,000 13,000,000 1,000,000 0 4,000,000 20 18 16 14 12 10 8 6 4 2 0 Jumlah Kontrak Number of Contracts 25,000,000 20,000,000 15,000,000 10,000,000 5,000,000 0 US$ Dir ekt orat J enderal M in yak dan G as Bumi Kement er ian Ener gi dan Sumber Da ya M ineral 14
ST
ATISTIK
Minyak dan Gas Bumi
2015 2015
ST
ATISTICS
Oil and Gas 15 Dir ec torat e General of Oil And G
as M inistr y of Ener gy and M ineral R esour ces
UR AIAN | D escr iption 2011 2012 2013 2014 2015 HUL U I UPSTREAM 16,106.00 17,872.00 20,384.00 20,380.78 15,312.68 a. E ksplorasi I Explor ation 2,570.00 2,758.00 3,049.00 2,618.91 951.83 b. P engembangan I D ev elopment 3,140.00 3,297.00 4,122.00 4,087.43 3,055.42 c. P roduksi I Production 9,194.00 10,639.00 11,859.00 12,256.63 10,113.63 E" ENJOJTUSBTJ* Administr ation 1,202.00 1,178.00 1,354.00 1,417.82 1,191.80
INVESTASI HULU MIGAS 2011-2015
Oil and Gas Upstream Investment 2011-2015
2011 2012 2013 2014 2015 25,000.00 20,000.00 15,000.00 10,000.00 5,000.00 0.00 Jumlah Kontrak Number of Contracts "ENJOJTUSBTJ Administr ation Pengembangan D ev elopment Produksi Production Eksplorasi Explor ation UR AIAN | D escription 2011 2012 2013 2014 2015 Ter bukti | Pr ov en 4,039.60 3,741.30 3,692.50 3,624.50 3,602.53 Pot ensial | Potential 3,692.70 3,666.90 3,857.30 3,750.30 3,702.49 TO TAL 7,732.30 7,408.20 7,549.80 7,375.10 7,305.02
CADANGAN MINYAK BUMI INDONESIA 2011-2015
Indonesian Crude Oil Reserve 2011-2015
2011 2012 2013 2014 2015 4,100.00 4,000.00 3,900.00 3,800.00 3,700.00 3,600.00 3,500.00 3,400.00 3,300.00 MMSTB Ter bukti | Pro ven Pot ensial | Potential HULU | UPSTREAM Dir ekt orat J enderal M in yak dan G as Bumi Kement er ian Ener gi dan Sumber Da ya M ineral 16
ST
ATISTIK
Minyak dan Gas Bumi
2015 2015
ST
ATISTICS
Oil and Gas 17 Dir ec torat e General of Oil And G
as M inistr y of Ener gy and M ineral R esour ces
UR AIAN | D escription 2011 2012 2013 2014 2015 Ter bukti | Pro ven 104.70 103.30 101.50 100.30 97.99 Pot ensial | Potential 48.20 47.40 48.90 49.00 53.34 TO TAL 152.90 150.70 150.40 149.30 151.33
CADANGAN GAS BUMI INDONESIA 2011-2015
Indonesian Gas Reserve 2011-2015
2011 2012 2013 2014 2015 120.00 100.00 80.00 60.00 40.00 20.00 0.00 54$' Ter bukti | Pro ven Pot ensial | Potential
GRAFIK SURVEI SEISMIK 2D (km) 2011-2015
Chart of 2D ( km ) Seismic Survey 2011-2015 2011 2012 2013 2014 2015 SUR VEI SEISMIK 2D 2D S eismic Sur ve y 12,549 13,995 12,989 5,873 3,934 16,000 14,000 12,000 10,000 8,000 6,000 4,000 2,000 0 KM
GRAFIK SURVEI SEISMIK 3D (km
2 ) 2011-2015 Chart of 3D ( km 2 ) Seismic Survey 2011-2015 2011 2012 2013 2014 2015 SUR VEI SEISMIK 3D 3D S eismic Sur ve y 8,147 6,165 13,436 8,541 3,347 16,000 14,000 12,000 10,000 8,000 6,000 4,000 2,000 0 KM2 HULU | UPSTREAM Dir ekt orat J enderal M in yak dan G as Bumi Kement er ian Ener gi dan Sumber Da ya M ineral 18
ST
ATISTIK
Minyak dan Gas Bumi
2015 2015
ST
ATISTICS
Oil and Gas 19 Dir ec torat e General of Oil And G
as M inistr y of Ener gy and M ineral R esour ces
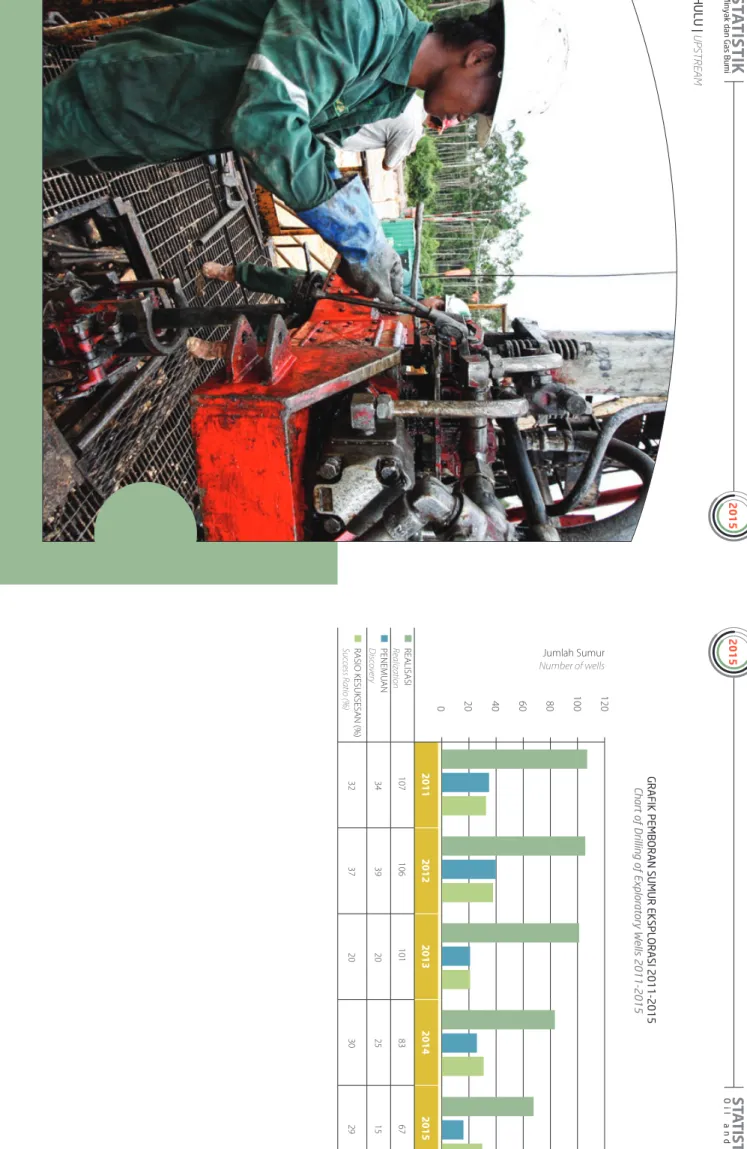
GRAFIK PEMBORAN SUMUR EKSPLORASI 2011-2015
Chart of Drilling of Exploratory Wells 2011-2015
2011 2012 2013 2014 2015 3&"-*4"4* Realiz ation 107 106 101 83 67 1&/&.6 "/ D isc ov er y 34 39 20 25 15 3"4*0,&46,4&4"/ Suc cess R atio (%) 32 37 20 30 29 120 100 80 60 40 20 0 Jumlah Sumur Number of wells HULU | UPSTREAM Dir ekt orat J enderal M in yak dan G as Bumi Kement er ian Ener gi dan Sumber Da ya M ineral 20
ST
ATISTIK
Minyak dan Gas Bumi
2015 2015
ST
ATISTICS
Oil and Gas 21 Dir ec torat e General of Oil And G
as M inistr y of Ener gy and M ineral R esour ces
PR
ODUKSI D
AN PEM
ANF
AA
TAN GAS BUMI 2015
Pro duc tion and U tilization of Natur al G as 2015 MSCF PER USAHAAN Compan y PR ODUKSI BERSIH Net P ro duc tion PEM ANF AA TAN I U tilization TO TAL DIB AK AR Total Losses % PENG-GUNAAN GAS % G as U tilization PENGGUNAAN SE N D IR I O wn Use PT PLN GAS K O TA Cit y G as PUPUK Fer tiliz er PE TR O KIMIA Petr o Chemic al KIL ANG MIN YAK O il Re fi ner y L PG /L EX PA BR IK LP G /Le x Pla nt KONDENSASI Condensation TR AN SP O RT AS I GA S / BB G G as/BBG Transp or tation LNG (FEED ) LNG LOK AL LNG D omestic PIP A GAS Pip eline G as PT PGN PT KR AK AT AU ST EE L INDUSTRI LAIN O ther Industries I. P er tamina O nshor e 1. "44& 5 3 BOUBV 1 4VTV + BNCJ
Ramba, Unitisasi Suban)
36,267,747 4,311,121 1,172,628 - - - - 129,669 141,881 - - - - 1,708,780 - 24,239,017 4,564,651 87.41 2. "44& 5 1 SBCVNVMJI1 FOEPQP -JNBV "EFSB 167,239,017 13,254,319 16,279,891 - 54,898,051 - 8,997,290 6,761,329 - - - - - 54,022,642 - 4,792,093 8,233,402 95.08 3. "44& 5 +BUJCBSBOH 4VCBOH 5BNCVO Pondok M ak mur) 125,294,688 8,783,332 28,658,162 62,634 16,113,489 - 6,196,066 1,054,169 1,948,794 1,368,226 - - - 985,953 3,574,553 39,362,250 17,187,061 86.28 4. "44& 5 $FQV 1 PMFOH 4VL PXBUJ 27,785,761 5,916,664 1,718,769 - - - - - - - - - - - - 15,359,461 4,790,867 82.76 5. "44& 5 4BOHBUUB#VO ZV 4 PS POH Tanjung , Sanga-sanga) 5,529,663 2,738,069 2,341,764 - - - - - - - - - - - - - 449,830 91.87 Sub Total 362,116,876 35,003,505 50,171,214 62,634 71,011,540 - 15,193,356 7,945,167 2,090,675 1,368,226 - - - 56,717,375 3,574,553 83,752,821 35,225,811 90.27 II. P er tamina TA C A. O nshor e 1. KSO P er tamina 3,706,353 821,420 - - - - - - - - - - - - - - 2,884,933 22.16 2. PMBS J ambi 41,549 - - - - - - - - - - - - - - - 41,549 - 3. Semco 959,024 63,598 523,261 - - - - - - - - - - - - - 372,165 61.19 4. Binat ek E ka K ruh 73,000 12,000 - - - - - - - - - - - - - - 61,000 16.44 5. Samudera Ener gi M eruap - - - - - - - - - - - - - - - - - - 6. Pilona Tanjung L ontar 365,000 24,400 - - - - - - - - - - - - - - 340,600 6.68 7. Ellipse Ener gy 376,192 31,646 - - - - - - - - - - - 344,734 - - (188) 100.05 8. G elam 840,910 11,622 688,823 - - - - - - - - - - - - - 140,465 83.30 Sub Total 6,362,028 964,686 1,212,084 - - - - - - - - - - 344,734 - - 3,840,524 39.63 B. O ff shor e 1. Blue Sk y Langsa 570,660 - - - - - - - - - - - - - - - 570,660 - 2. 1FS UBMBIBO"S OFCBSB/BUVOB 1,682,857 808,765 - - - - - - - - - - - - - - 874,092 48.06 Sub Total 2,253,517 808,765 - - - - - - - - - - - - - - 1,444,752 35.89 III. JOB -PSC A. O nshor e 1. Talisman ( O .K ) 2,932,947 468,438 - - 2,424,439 - - - - - - - - - - - 40,070 98.63 2. G olden Spik e 162,563 2,444 - - - - - - - - - - - - - - 160,119 1.50 3. M edco E&P Tomor i 49,156,542 835,209 - - - - - - - - 42,292,235 - - - - - 6,029,098 87.73 4. Petr ochina Sala wati 1,547,499 386,897 307,448 - - - - - - - - - - - - - 853,154 44.87 5. Petr ochina Tuban 1,873,259 746,284 - - - - - 905,649 - - - - - - - - 221,326 88.18 6. Talisman J ambi M erang 34,315,141 1,378,453 15,822,297 1,230 - - - - - - - - 143,429 307,913 - 13,329,354 3,332,465 90.29 Sub Total 89,987,951 3,817,725 16,129,745 1,230 2,424,439 - - 905,649 - - 42,292,235 - 143,429 307,913 - 13,329,354 10,636,232 88.18 B. O ff shor e 1. EMP G ebang - - - - - - - - - - - - - - - - -Total P er tamina + JOB + TA C 460,720,372 40,594,681 67,513,043 63,864 73,435,979 - 15,193,356 8,850,816 2,090,675 1,368,226 2,292,235 - 143,429 57,370,022 3,574,553 97,082,175 51,147,319 88.90 HULU | UPSTREAM Dir ekt orat J enderal M in yak dan G as Bumi Kement er ian Ener gi dan Sumber Da ya M ineral 22
ST
ATISTIK
Minyak dan Gas Bumi
2015 2015
ST
ATISTICS
Oil and Gas 23 Dir ec torat e General of Oil And G
as M inistr y of Ener gy and M ineral R esour ces
PR
ODUKSI D
AN PEM
ANF
AA
TAN GAS BUMI 2015
Pro duc tion and U tilization of Natur al G as 2015 PER USAHAAN Compan y PR ODUKSI BERSIH Net P ro duc tion PEM ANF AA TAN I U tilization TO TAL DIB AK AR Total L osses % PENG-GUNAAN GAS % G as U tilization PENGGUNAAN SE N D IR I O wn Use PT PLN GAS K O TA Cit y G as PUPUK Fer tiliz er PE TR O KIMIA Petr o Chemic al KIL ANG MIN YAK O il Re fi ner y LPG/LEX PABRIK LPG/L ex Plant KONDENSASI Condensation TR AN SP O RT AS I GA S / BB G G as/BBG Transp or tation LN G ( FE ED ) LNG LOK AL LNG D omestic PIP A GAS Pip eline G as PT PG N PT KR AK ATA U ST EE L INDUSTRI LAIN O ther Industries IV . P ro duc tion Sha ring C ontr ac ts O nshor e 1. Exx on M obil 50,499,527 16,749,848 - - 17,720,757 - - - - - - - - - - - 16,028,922 68.26 2. M obil C epu L td 6,500,730 430,014 - - - - - - - - - - - - - - 6,070,716 6.61 3. PT . C P I 11,370,739 11,370,739 - - - - - - - - - - - - - - - 100.00 4. Petr oselat L td 211,140 - 63 - - - - - - - - - - - - - 211,077 0.03 5. Conoco P hillips Gr issik L td 393,303,868 5,274,150 12,093,664 - - - - - - - - - 74,473,499 151,018,548 - 83,859,367 66,584,641 83.07 6. ConocoP hillips S outh J ambi - - - - - - - - - - - - - - - - - - 7. M edco E&P I ndonesia L ematang 24,595,725 1,031,239 13,384,605 - - - - - - - - - - - - - 10,179,881 58.61 8. M edco E&P I ndonesia (S outh Sumat era) 23,931,781 1,156,385 6,154,280 30,240 14,565,020 - - - - - - - - - - 1,161,055 864,801 96.39 9. M edco E&P I ndonesia (R imau) 1,728,679 1,199,198 - - - - - - - - - - - - - - 529,481 69.37 10. M edco E&P I ndonesia K alimantan 271,876 - 216,817 36,046 - - - - - - - - - - - - 19,013 93.01 11. Kangean Ener gy 88,559,119 1,852,747 28,325,211 - 22,286,505 - - - - - - - - - - 34,743,104 1,351,552 98.47 12. Vico 114,590,826 9,478,316 101,831 - 9,722,929 5,459,267 - - - - 86,154,998 - - - - 3,419,391 254,094 99.78 13. Petr ochina B er muda 7,911,092 4,385,565 2,063,526 - - - - 227,845 671,003 - - - - - - - 563,153 92.88 14. Petr ochina J abung 96,676,786 5,942,805 609,820 - - - - 9,177,971 3,563,376 - - - 42,945,108 - - - 34,437,706 64.38 15. Petr ochina Bangk o - - - - - - - - - - - - - - - - - - 16. Ener gy E quit y Epic (S engk ang) 17,292,617 67,854 17,129,959 49,371 - - - - - - - - - - - - 45,433 99.74 17. Lapindo Brantas 1,623,557 26,631 28,466 29,270 - - - - - - - - - 824,441 - 714,749 - 100.00 18. Citic S eram Ener gy L td ( Csel) 646,142 540,912 - - - - - - - - - - - - - - 105,230 83.71 19. M ont d' or Oil K uala Tungk al 304,608 - - - - - - - - - - - - - - - 304,608 - 20. Benuo Tak a 308,961 5,684 325,333 - - - - - - - - - - - - - (22,056) 107.14 21. Kalila (B entu) 17,292,399 2,212 11,439,859 - - - - - - - - - - - - 5,839,719 10,609 99.94 22. Triangle P ase - - - - - - - - - - - - - - - - - - 23. Sele R aya M erang in Dua 62,904 - - - - - - - - - - - - - - - 62,904 - 24. 5BU FMZ/7 546,120 45,964 - - - - - - - - - - - - - - 500,156 8.42 25. PT Tiara Bumi P etr oleum 80,408 - - - - - - - - - - - - - - - 80,408 - 26. M anhattan K alimantan I nv . 115,748 2,150 111,295 - - - - - 2,277 - - - - - - - 26 99.98 Sub Total 858,425,352 59,562,413 91,984,729 144,927 64,295,211 5,459,267 - 9,405,816 4,236,656 - 86,154,998 - 117,418,607 151,842,989 - 129,737,385 138,182,355 83.90 O ff shor e 1. Premier Oil 82,803,523 3,240,367 - - - - - - - - - - 78,310,487 - - - 1,252,669 98.49 2. $POPDP1 IJMMJQT/BUVOB 123,675,370 16,669,108 - - - - - 5,197,778 - - - - 103,530,224 - - - (1,721,740) 101.39 3. Star Ener gi (K ak ap) 9,949,016 1,655,837 - - - - - - - - - - 7,276,404 - - - 1,016,775 89.78 4. EMP M alacca Strait 2,600,013 746,884 617,888 - - - - - - - - - - - - 865,381 369,860 85.77 5. $/00$4&4 40,807,264 11,963,686 17,836,337 - - - - - - - - - - - - - 11,007,241 73.03 6. 1FS UBNJOB)VMV&OFS HJ 1)& 8.0 37,895,349 838,809 29,457,023 - - - - - - - - - - 4,410,681 - 2,453,989 734,847 98.06 7. 1FS UBNJOB)VMV&OFS HJ 1)&0/8 + 65,421,083 8,097,527 33,205,726 - 14,693,405 - 7,500,953 - 321,715 27,446 - - - - - - 1,574,311 97.59 8. BP B erau ( Tangguh) 464,197,062 35,800,000 - - - - - - 1,125,446 - 327,277,219 45,025,981 - - - - 54,968,416 88.16 9. Camar R es . C anada 966,441 9,275 - - - - - - - - - - - - - - 957,166 0.96 10. Che vr on I nd .C o 36,021,601 6,829,766 - - 2,956,525 - 16,840,348 550,461 62,601 - 7,085,507 - - - - - 1,696,393 95.29 11. Che vr on M ak asar 4,950,220 1,465,235 - - 883,829 - - 14,342 12,040 - 2,420,873 - - - - - 153,901 96.89 12. Total E & P I ndonesie 646,688,481 21,781,925 9,062,279 - 49,608,443 26,091,371 - - - - 454,492,606 61,039,835 - - - 16,267,027 8,344,995 98.71 13. Sant os (M adura O ff shor e) 25,172,253 941,346 8,331,726 - - - - - - - - - - 15,875,104 - - 24,077 99.90 14. Sant os (Sampang) 22,694,452 491,289 22,022,249 - - - - - - - - - - - - - 180,914 99.20 15. Sak a P angk ah 17,451,358 2,229,543 14,003,054 - - - - 782,124 - - - - - - - - 436,637 97.50 16. Pear l Oil S ebuk u 34,997,280 1,093,780 - - 32,185,932 - - - - - - - - - - - 1,891,223 95.09 17. Petr onas C ar igali K etapang II L td . 1,224,890 127,020 - - - - - - - - - - - - - - 1,097,870 10.37 18. Petr onas C ar igali M ur iah L td . 11,704,380 167,800 11,450,177 - - - - - - - - - - - - - 86,403 99.26 Sub Total 1,629,220,037 114,149,197 145,986,459 - 100,328,134 26,091,371 24,341,301 6,544,705 1,521,802 27,446 79 1,2 76 ,20 5 10 6,0 65 ,81 6 18 9,1 17 ,11 5 20,285,785 - 19,586,397 84,071,958 94.85 Total P ro duc tion S haring 2,487,645,389 173,711,610 237,971,188 144,927 164,623,345 31,550,638 24,341,301 15,950,521 5,758,458 27,446 877,431,203 106,065,816 306,535,722 172,128,774 - 149,323,782 222,254,313 91.07 Gr and Total 2,948,365,761 214,306,291 305,484,231 208,791 238,059,324 31,550,638 39,534,657 24,801,337 7,849,133 1,395,672 919,723,438 106,065,816 306,679,151 229,498,796 3,574,553 246,405,957 273,401,632 90.73 Gr and Total (MSCFD ) 8,077,714 587,141 836,943 572 652,217 86,440 108,314 67,949 21,504 3,824 2,519,790 290,591 840,217 628,764 9,793 675,085 749,046 90.73 Lanjutan I Contin ued MSCF HULU | UPSTREAM Dir ekt orat J enderal M in yak dan G as Bumi Kement er ian Ener gi dan Sumber Da ya M ineral 24
ST
ATISTIK
Minyak dan Gas Bumi
2015 2015
ST
ATISTICS
Oil and Gas 25 Dir ec torat e General of Oil And G
as M inistr y of Ener gy and M ineral R esour ces
PER USAHAAN Compan y JUML AH PRODUKSI D AL A M SE TAHUN Total P ro duc tion in a Y ear PRODUKSI HARIAN R AT A -R AT A Av er age D aily P ro duc tion MIN YAK Crude O il KO ND EN SA T Condensat e TO TA L MIN YAK Crude O il KO ND EN SA T Condensat e TO TA L I. PT . P er tamina EP & M itr a 36,679,476 0 36,679,476 100,492 0 100,492 II. JOB PSC "+ PC14$ O nshor e ) 1 +0#1&3 5" .*/"(0-%&/41*,& 186,838 0 186,838 512 0 512 2 +0#1&3 5" .*/".&%$ 0 50.03*-5% 292,605 1,224,556 1,517,161 802 3,355 4,157 3 +0#1&3 5" .*/"1& 53 0$)*/"&"45+" 7" 1,791,016 0 1,791,016 4,907 0 4,907 4 +0#1&3 5" .*/"1& 53 0$)*/"4"-" 8 "5* 647,093 0 647,093 1,773 0 1,773 5 +0#1&3 5" .*/" 5"-*4. "/ +.-5% 0 1,612,104 1,612,104 0 4,417 4,417 6 +0#1&3 5" .*/" 5"-*4. "/ 0, -5% 856,973 50,080 907,053 2,348 137 2,485 Sub Total JOB PSC O nshor e 3,774,525 2,886,740 6,661,265 10,341 7,909 18,250 B. JOB PSC ( O ff shor e ) 1 JOB P er tamina - EMP G ebang 0 0 0 0 0 0 Sub Total JOB PSC O ff shor e 0 0 0 0 0 0 Sub Total JOB PSC O nshor e & O ff shor e 3,774,525 2,886,740 6,661,265 10,341 7,909 18,250 III. KKKS / PSC A. KKKS / PSC ( O nshor e ) 1 #0 #1 &35 ". */ "# 6 . *4 *" ,1 6 4" ,0 4,782,156 0 4,782,156 13,102 0 13,102 2 $*5*$4&3" .&/&3 (:-.% 1,211,191 0 1,211,191 3,318 0 3,318 3 15$)& 73 0/1 "$*'*$*/%0/&4*" 99,889,838 2,180,011 102,069,849 273,671 5,973 279,643 4 15$)& 73 0/1 "$*'*$*/%0/&4*"$ 5 4*", 0 0 0 0 0 0 5 $0 / 0 $0 1) *-*1 4 ( 3*4 4*, -5 % 176,657 2,659,744 2,836,401 484 7,287 7,771 6 $0 / 0 $0 1) *--*14 40 6 5) +" . #* 0 0 0 0 0 0 7 &9 90/.0#*-0*-*/%0/&4*"1)&/4#/40 0 561,170 561,170 0 1,537 1,537 8 ," -3 &; 1& 53 0 -& 6 . 4 &3 ". -5 % 130,224 0 130,224 357 0 357 9 ," / ( &" / &/ &3 ( :*/ % 0 / &4 *" -5 % 0 28,849 28,849 0 79 79 10 -"1*/%0#3"/5 "4*/$ 0 0 0 0 0 0 11 15.&%$ 0-&. "5 "/( 0 0 0 0 0 0 12 15.&%$ 0&1*/%0/&4*" 4,043,184 0 4,043,184 11,077 0 11,077 13 15 . &% $0 & 1*/ % 0 / &4 *" 1,877,261 0 1,877,261 5,143 0 5,143 14 .&%$ 0, ".1 "3 503,658 0 503,658 1,380 0 1,380 15 15.&%$ 0&1 5"3", "/ 666,260 0 666,260 1,825 0 1,825 16 &9 90/.0#*-$&16-5% 26,094,070 0 26,094,070 71,491 0 71,491 17 .0/5%h031&"3-0*- 56/(, "--5% 503,406 0 503,406 1,379 0 1,379 18 1& 53 0$)*/"#"/(, 0-5% 2,921 0 2,921 8 0 8 19 1& 53 0 $) */ "*/ 5& 3/ "5 *0 / "-#& 3. 6 % "-5% 1,459,747 304,503 1,764,250 3,999 834 4,834 20 1& 53 0$)*/"*/5&3/" 5*0/"-+"#6/(-5% 1,918,638 3,275,382 5,194,020 5,257 8,974 14,230 21 1& 53 04&-" 5 92,062 0 92,062 252 0 252
PRODUKSI MINYAK MENTAH DAN KONDENSAT 2015
Production of Crude Oil and Condensate 2015
GRAFIK PRODUKSI DAN PEMANFAATAN GAS BUMI 2011-2015
Chart of Production and Utilization of Natural Gas 2011-2015
2011 2012 2013 2014 2015 PR ODUKSI Production 8,415.00 8,149.00 8,130.00 8,217.87 8,077.71 1&. "/' "" 5"/ Utiliz ation 7,923.00 7,451.00 7,480.00 7,364.13 7,329.15 %*#", "3 Losses 492.00 698.00 650.00 853.74 749.05 9,000 8,000 7,000 6,000 5,000 4,000 3,000 2,000 1,000 0 ..4$'% HULU | UPSTREAM Dir ekt orat J enderal M in yak dan G as Bumi Kement er ian Ener gi dan Sumber Da ya M ineral 26
ST
ATISTIK
Minyak dan Gas Bumi
2015 2015
ST
ATISTICS
Oil and Gas 27 Dir ec torat e General of Oil And G
as M inistr y of Ener gy and M ineral R esour ces
PER USAHAAN Compan y JUML AH PRODUKSI D AL A M SE TAHUN Total P ro duc tion in a Y ear PRODUKSI HARIAN R AT A -R AT A Av er age D aily P ro duc tion MIN YAK Crude O il KO ND EN SA T Condensat e TO TA L MIN YAK Crude O il KO ND EN SA T Condensat e TO TA L 22 15 4"3"/"1&.#"/(6/"/3*" 6 142,139 0 142,139 389 0 389 23 4& -& 3" :" 382,995 0 382,995 1,049 0 1,049 24 53*"/(-& 1 "4& 0 0 0 0 0 0 25 15 7*$ 0*/%0/&4*" 3,948,606 1,736,738 5,685,344 10,818 4,758 15,576 26 1546. "5&3"1&34"% "&/&3 (* 118,189 0 118,189 324 0 324 27 &.1 50/(" &Y.04&4"1& 53 0-&6. 3,733 0 3,733 10 0 10 28 &/ &3 (: &2 6*5 :& 1*$ 4 &/ (, "/ ( 15 : LT D. 0 140 140 0 0 0 29 5" 5&-:/7 341,277 0 341,277 935 0 935 30 1)&4*", 628,478 0 628,478 1,722 0 1,722 31 5*"3"#6.* 150,858 0 150,858 413 0 413 Sub Total KKKS / PSC ( On sh ore ) 14 9,0 67 ,54 8 10 ,74 6,5 37 15 9,8 14 ,08 5 40 8,4 04 29 ,44 3 43 7,8 47 B. KKKS / PSC ( O ff shor e) 1. #1 5"/((6) 0 2,107,480 2,107,480 0 5,774 5,774 2. $/00$4&4-5% 12,078,879 0 12,078,879 33,093 0 33,093 3. $" . "33&4063 $&4$"/"% " 170,308 0 170,308 467 0 467 4. $)& 73 0/*/%0/&4*"$ 0.1 "/: 6,904,683 390,375 7,295,058 18,917 1,070 19,986 5. $)& 73 0/. ", "44"3-5% 1,213,745 14,350 1,228,095 3,325 39 3,365 6. $0 / 0 $0 1) *--*14 */ % 0 / &4 *" -5 % 8,338,262 0 8,338,262 22,845 0 22,845 7. 4", "*/%0/&4*"1 "/(, ")-5% 1,826,848 0 1,826,848 5,005 0 5,005 8. 1)& 8.0, 0%&$ 0&/&3 (:$ 0-5% 4,907,188 3,082 4,910,270 13,444 8 13,453 9. &.1. "-" $$"453"*54" &Y, 0/%63 1,414,295 0 1,414,295 3,875 0 3,875 10. 1&3 5" .*/")6-6&/&3 (: 8&45+" 7"-5% 14,554,141 57,259 14,611,400 39,874 157 40,031 11. 13 &. *&3 0 *-/ "5 6/ "4 &" #7 227,778 297,391 525,169 624 815 1,439 12. 4"/5 04 4" .1 "/(15 :-5% 413,828 16,311 430,139 1,134 45 1,178 13. 45 "3&/&3 (: , ", "1-5% 1,142,343 126,490 1,268,833 3,130 347 3,476 14. 50 5" -& 1 */ % 0 / &4 *& 7,300,833 18,256,254 25,557,087 20,002 50,017 70,019 15. 1&"3-0*- 4,6-UE 0 32,242 32,242 0 88 88 16. ." / )" 55 "/ ," -*." / 5" / */ 7& 45 . &/ 5 0 1,014 1,014 0 3 3 17. 1& 53 0/"4$"3*("-*,& 5"1 "/(** 1,864,015 0 1,864,015 5,107 0 5,107 Sub Total KKKS / PSC( O ff shor e ) 62,357,146 21,302,248 83,659,394 170,841 58,362 229,204 Sub Total KKKS / PSC (O nsh ore + O ff sh ore ) 21 1,4 24 ,69 4 32 ,04 8,7 85 24 3,4 73 ,47 9 57 9,2 46 87 ,80 5 66 7,0 51 To ta l In do ne sia 25 1,8 78 ,69 5 34 ,93 5,5 25 28 6,8 14 ,22 0 69 0,0 79 95 ,71 4 78 5,7 92
PRODUKSI MINYAK MENTAH DAN KONDENSAT 2015
Production of Crude Oil and Condensate 2015
Lanjutan I
Contin
ued
Bar
rels
GRAFIK PRODUKSI MINYAK MENTAH DAN KONDENSAT 2011-2015
Chart of Production of Crude Oil and Condensate 2011-2015
2011 2012 2013 2014 2015 .*/: ",.&/5 ") Crude O il 794.00 763.00 728.00 697.30 690.08 ,0/%&/4" 5 Condensate 108.00 96.00 97.00 91.47 95.71 9,000 8,000 7,000 6,000 5,000 4,000 3,000 2,000 1,000 0 3JCV#BSFMQFS)BSJ Thousand Barrels per Day
HULU | UPSTREAM Dir ekt orat J enderal M in yak dan G as Bumi Kement er ian Ener gi dan Sumber Da ya M ineral 28
ST
ATISTIK
Minyak dan Gas Bumi
2015 2015
ST
ATISTICS
Oil and Gas 29 Dir ec torat e General of Oil And G
as M inistr y of Ener gy and M ineral R esour ces
HARGA MINYAK MENTAH INDONESIA 2015
Indonesian Crude Oil Price 2015
PERKEMBANGAN HAR
GA MIN
YAK MENT
AH INDONESIA (ICP) (US$/BBL)
Crude O
il P
ric
e D
ev
elopment in Indonesia (ICP
) (U S$/BBL) MIN YAK MENT AH Crude O il 2015 RA TA -RA TA Av er age Jan ’15 s/d D es ’15 Jan 'FC M ar "QS M ei Jun Jul "HT Sep Okt /P W D es 1 S L C 45.56 54.11 54.19 59.92 62.70 59.54 51.91 43.21 42.96 42.92 41.03 34.61 49.39 2 "SKVOB 44.79 53.69 52.63 55.86 60.93 58.67 50.86 41.84 42.76 43.72 41.33 35.45 48.54 3 " UUBL B 47.38 56.36 55.21 58.47 63.66 61.55 53.98 44.75 45.54 46.49 43.72 37.27 51.20 4 Cinta 45.82 53.69 52.41 55.49 61.02 58.60 51.20 41.78 42.46 42.77 39.87 33.50 48.22 5 D u r i 44.75 55.10 52.53 54.64 60.75 58.49 51.47 42.11 41.04 40.55 37.42 32.34 47.60 6 8 JEVS J 45.37 53.91 53.56 55.99 61.15 58.76 51.37 41.97 42.61 42.92 40.02 33.63 48.44 7 B elida 48.85 57.57 56.49 59.74 65.35 63.09 55.38 46.04 46.84 47.83 45.43 38.81 52.62 8 S enipah C ondensat e 48.09 57.33 57.41 60.17 64.86 63.23 56.00 46.06 46.75 48.08 45.94 41.09 52.92 9 "OPB 47.78 56.76 55.61 58.87 64.06 61.95 54.38 45.15 45.94 46.89 44.12 37.67 51.60 10 "SVO$ POEFOTBU F 48.09 57.33 57.41 60.17 64.86 63.23 56.00 46.06 46.75 48.08 45.94 41.09 52.92 11 Badak 47.38 56.36 55.21 58.47 63.66 61.55 53.98 44.75 45.54 46.49 43.72 37.27 51.20 12 B ek apai 47.38 56.36 55.21 58.47 63.66 61.55 53.98 44.75 45.54 46.49 43.72 37.27 51.20 13 B elanak 39.83 48.73 47.67 50.90 55.97 53.71 45.90 36.88 37.80 38.76 36.37 30.49 43.58 14 B enta yan 43.60 52.15 52.23 57.96 60.74 57.58 49.95 41.25 41.00 40.96 39.07 32.65 47.43 15 B ontang R etur n Condensat e (BR C) 43.23 55.39 55.38 57.56 60.04 58.89 51.15 43.76 44.81 46.92 46.95 43.68 50.65 16 B u l a 44.25 54.60 52.03 54.14 60.25 57.99 50.97 41.61 40.54 40.05 36.92 31.84 47.10 17 Bun yu 45.56 54.11 54.19 59.92 62.70 59.54 51.91 43.21 42.96 42.92 41.03 34.61 49.39 18 C amar 45.17 54.07 53.01 56.24 61.31 59.05 51.24 42.22 43.14 44.10 41.71 35.83 48.92 19 C epu 40.15 49.05 47.99 51.22 56.29 54.03 46.22 37.20 38.12 39.08 36.69 30.81 43.90 20 G eragai/M ak mur 45.75 54.30 54.38 60.11 62.89 59.73 52.10 43.40 43.15 43.11 41.22 34.80 49.58 21 G eragai C ondensat e/ M ak mur C ondensat e 42.97 55.13 55.12 57.30 59.78 58.63 50.89 43.50 44.55 46.66 46.69 43.42 50.39 22 )BOEJM. JY 44.94 53.84 52.78 56.01 61.08 58.82 51.01 41.99 42.91 43.87 41.48 35.60 48.69 23 Jambi 45.75 54.30 54.38 60.11 62.89 59.73 52.10 43.40 43.15 43.11 41.22 34.80 49.58 24 Jatibarang 45.56 54.11 54.19 59.92 62.70 59.54 51.91 43.21 42.96 42.92 41.03 34.61 49.39 25 Jene/P endopo 45.56 54.11 54.19 59.92 62.70 59.54 51.91 43.21 42.96 42.92 41.03 34.61 49.39 26 K aji/M atra 45.96 54.51 54.59 60.32 63.10 59.94 52.31 43.61 43.36 43.32 41.43 35.01 49.79 27 K erapu 48.51 57.23 56.15 59.40 65.01 62.75 55.04 45.70 46.50 47.49 45.09 38.47 52.28 28 K lamono 44.25 54.60 52.03 54.14 60.25 57.99 50.97 41.61 40.54 40.05 36.92 31.84 47.10 (ICP) (US$/Bbl) PERKEMBANGAN HAR GA MIN YAK MENT
AH INDONESIA (ICP) (US$/BBL)
Crude O
il P
ric
e D
ev
elopment in Indonesia (ICP
) (U S$/BBL) MIN YAK MENT AH Crude O il 2015 RA TA -RA TA Av er age Jan ’15 s/d D es ’15 Jan 'FC M ar "QS M ei Jun Jul "HT Sep Okt /P W D es 29 Komplek P alembang 4FMBUBO ,14"JS Ser dang/Guruh 43.05 51.95 50.89 54.12 59.19 56.93 49.12 40.10 41.02 41.98 39.59 33.71 46.80 30 Lalang 45.61 54.16 54.24 59.97 62.75 59.59 51.96 43.26 43.01 42.97 41.08 34.66 49.44 31 Langsa 46.98 55.96 54.81 58.07 63.26 61.15 53.58 44.35 45.14 46.09 43.32 36.87 50.80 32 Lir ik 45.45 54.00 54.08 59.81 62.59 59.43 51.80 43.10 42.85 42.81 40.92 34.50 49.28 33 M adura/P oleng 44.92 53.82 52.76 55.99 61.06 58.80 50.99 41.97 42.89 43.85 41.46 35.58 48.67 34 M engoepeh 45.75 54.30 54.38 60.11 62.89 59.73 52.10 43.40 43.15 43.11 41.22 34.80 49.58 35 M eslu 44.21 53.19 52.04 55.30 60.49 58.38 50.81 41.58 42.37 43.32 40.55 34.10 48.03 36 M udi M ix 44.49 53.39 52.33 55.56 60.63 58.37 50.56 41.54 42.46 43.42 41.03 35.15 48.24 37 /4$, BUBQB"S CFJ 47.27 56.25 55.10 58.36 63.55 61.44 53.87 44.64 45.43 46.38 43.61 37.16 51.09 38 P agerungan Condensat e 47.34 56.58 56.66 59.42 64.11 62.48 55.25 45.31 46.00 47.33 45.19 40.34 52.17 39 Pam. Juata/Sanga2 M ix/M amburungan 45.66 54.21 54.29 60.02 62.80 59.64 52.01 43.31 43.06 43.02 41.13 34.71 49.49 40 P angk ah 43.49 52.39 51.33 54.56 59.63 57.37 49.56 40.54 41.46 42.42 40.03 34.15 47.24 41 R amba/T empino 45.75 54.30 54.38 60.11 62.89 59.73 52.10 43.40 43.15 43.11 41.22 34.80 49.58 42 R imau/T abuhan 45.46 54.01 54.09 59.82 62.60 59.44 51.81 43.11 42.86 42.82 40.93 34.51 49.29 43 Sangatta 45.56 54.11 54.19 59.92 62.70 59.54 51.91 43.21 42.96 42.92 41.03 34.61 49.39 44 S elat P anjang 45.56 54.11 54.19 59.92 62.70 59.54 51.91 43.21 42.96 42.92 41.03 34.61 49.39 45 4 FQJOHHBO :BL JO. JY 44.79 53.69 52.63 55.86 60.93 58.67 50.86 41.84 42.76 43.72 41.33 35.45 48.54 46 S outh J ambi Condensat e 46.15 55.39 55.47 58.23 62.92 61.29 54.06 44.12 44.81 46.14 44.00 39.15 50.98 47 Tanjung 45.75 54.30 54.38 60.11 62.89 59.73 52.10 43.40 43.15 43.11 41.22 34.80 49.58 48 5BMBOH"L BS1 FOEPQP 5"1"JS) JUBN 43.26 52.16 51.10 54.33 59.40 57.14 49.33 40.31 41.23 42.19 39.80 33.92 47.01 49 Tiak a 41.75 52.10 49.53 51.64 57.75 55.49 48.47 39.11 38.04 37.55 34.42 29.34 44.60 50 Udang 45.64 54.19 54.27 60.00 62.78 59.62 51.99 43.29 43.04 43.00 41.11 34.69 49.47 51 8 BMJP. JY 42.74 51.64 50.58 53.81 58.88 56.62 48.81 39.79 40.71 41.67 39.28 33.40 46.49 52 8 FTU4 FOP 46.73 55.71 54.56 57.82 63.01 60.90 53.33 44.10 44.89 45.84 43.07 36.62 50.55 R ata - R ata Terhitung 45.30 54.32 53.66 57.58 61.86 59.40 51.81 42.81 43.13 43.68 41.44 35.47 49.21 Lanjutan I Contin ued (ICP) (US$/Bbl) HULU | UPSTREAM Dir ekt orat J enderal M in yak dan G as Bumi Kement er ian Ener gi dan Sumber Da ya M ineral 30
ST
ATISTIK
Minyak dan Gas Bumi
2015 2015
ST
ATISTICS
Oil and Gas 31 Dir ec torat e General of Oil And G
as M inistr y of Ener gy and M ineral R esour ces
POLA PERGERAKAN HARGA MINY
AK MENTAH TAHUN 2015
PERKEMBANGAN HARGA MINYAK INDONESIA & MINYAK UTAMA DUNIA
(JANUARI 2015 – DESEMBER 2015/ HARIAN)
P ric e D e v e lo p m e n ts o f I n d o n e sia n C ru d e O il & W o rld M a jo r C ru d e O il ( January 2015 - December 2015 / Daily ) HULU | UPSTREAM Dir ekt orat J enderal M in yak dan G as Bumi Kement er ian Ener gi dan Sumber Da ya M ineral 32
ST
ATISTIK
Minyak dan Gas Bumi
2015 2015
ST
ATISTICS
Oil and Gas 33 Dir ec torat e General of Oil And G
as M inistr y of Ener gy and M ineral R esour ces
ST
ATISTIK
Minyak dan Gas Bumi
ST
ATISTIC
S
Oil and Gas2015
Dir
ekt
or
at Jender
al M
in
yak dan G
as Bumi
Kemen
ter
ian Ener
gi dan Sumber Da
ya M
iner
al
D
irector
ate G
ener
al of O
il A
nd G
as
M
inistr
y of Ener
gy and M
iner
al Resour
ces
HILIR
DOWNSTREAM
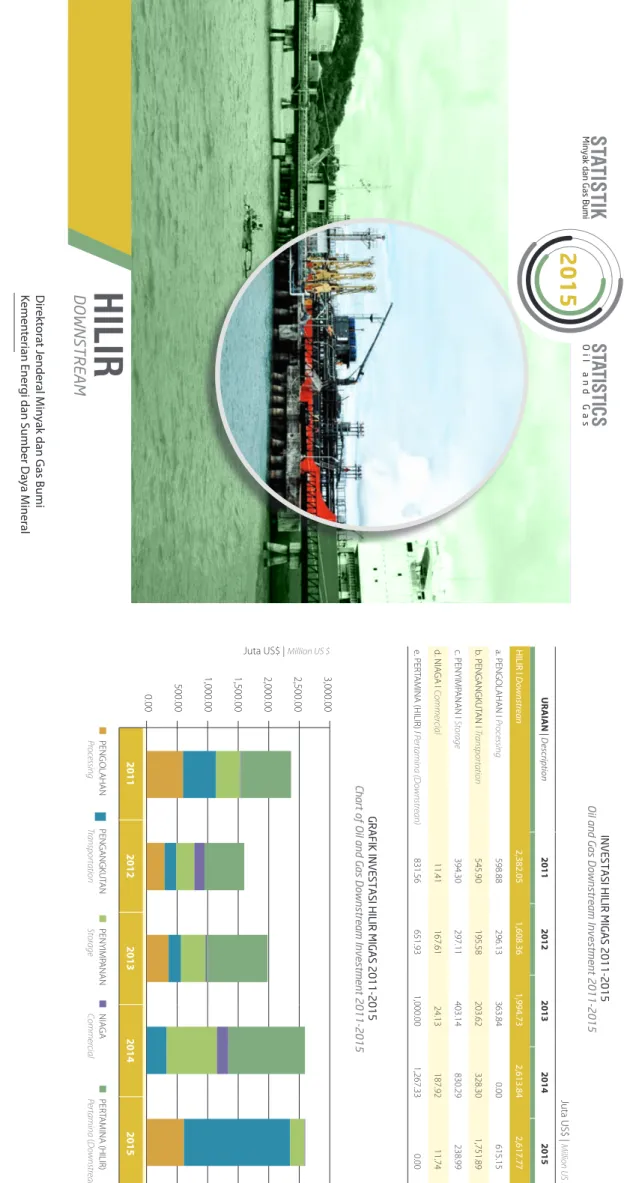
Juta US$ | M illion U S $ UR AIAN | D escription 2011 2012 2013 2014 2015 HILIR I D ownstr ean 2,382.05 1,608.36 1,994.73 2,613.84 2,617.77 B1&/(0-")"/* Proc essing 598.88 296.13 363.84 0.00 615.15 C1&/("/(,65 "/* Transpor tation 545.90 195.58 203.62 328.30 1,751.89 D1&/:*.1 "/"/* Stor age 394.30 297.11 403.14 830.29 238.99 E/*" ("* Commer cial 11.41 167.61 24.13 187.92 11.74 F1&3 5" .*/" )*-*3 I Per tamina (D ownstr ean) 831.56 651.93 1,000.00 1,267.33 0.00INVESTASI HILIR MIGAS 2011-2015
Oil and Gas Downstream Investment 2011-2015
GRAFIK INVESTASI HILIR MIGAS 2011-2015
Chart of Oil and Gas Downstream Investment 2011-2015
2011 2012 2013 2014 2015 3,000.00 2,500.00 2,000.00 1,500.00 1,000.00 500.00 0.00
Juta US$ | Million US $
1&3 5" .*/" )*-*3 Per tamina ( D ownstr ean ) /*" (" Commer cial 1&/:*.1 "/"/ Stor age 1&/("/(,65 "/ Transpor tation 1&/(0-")"/ Proc essing 2015
ST
ATISTICS
Oil and Gas 35 Dir ec torat e General of Oil And G
as M inistr y of Ener gy and M ineral R esour ces
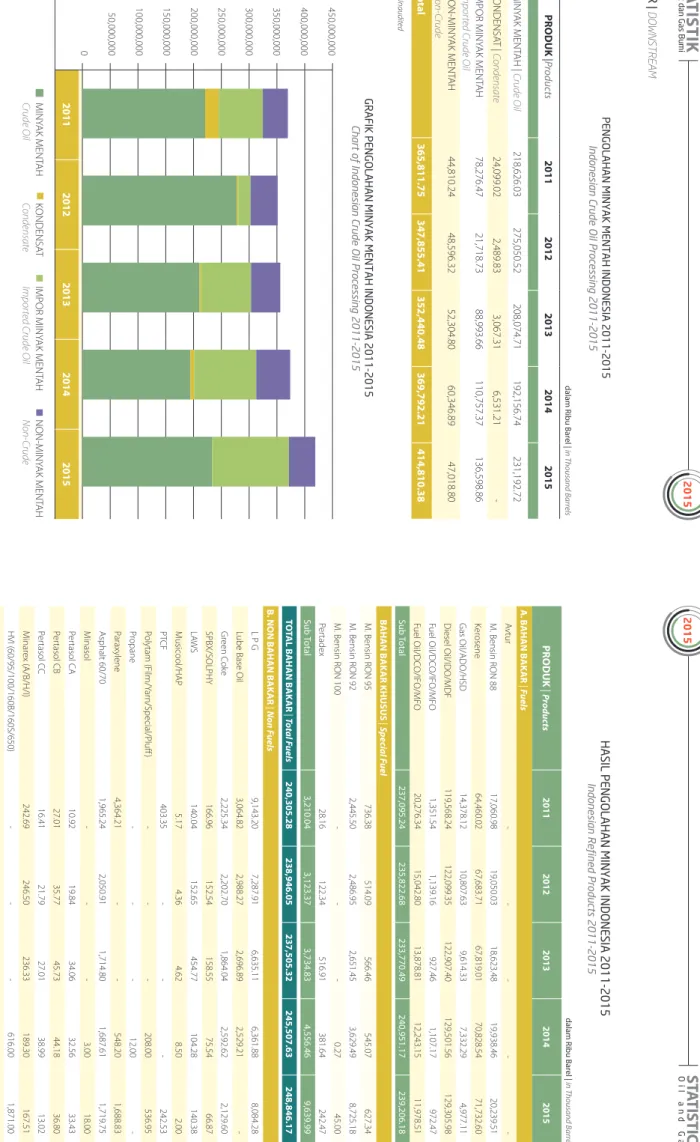
dalam R ibu Bar el | in T housand Barr els PR ODUK | Pro duc ts 2011 2012 2013 2014 2015 .*/: ",.&/5 ")] Crude O il 218,626.03 275,050.52 208,074.71 192,156.74 231,192.72 ,0/%&/4" 5] Condensate 24,099.02 2,489.83 3,067.31 6,531.21 - *.103.*/: ",.&/5 ") Impor ted Crude O il 78,276.47 21,718.73 88,993.66 110,757.37 136,598.86 /0/.*/: ",.&/5 ") Non-Crude 44,810.24 48,596.32 52,304.80 60,346.89 47,018.80 Total 365,811.75 347,855.41 352,440.48 369,792.21 414,810.38 D ata Unaudited
PENGOLAHAN MINYAK MENTAH INDONESIA 2011-2015
Indonesian Crude Oil Processing 2011-2015
GRAFIK PENGOLAHAN MINYAK MENTAH INDONESIA 2011-2015
Chart of Indonesian Crude Oil Processing 2011-2015
2011 2012 2013 2014 2015 450,000,000 400,000,000 350,000,000 300,000,000 250,000,000 200,000,000 150,000,000 100,000,000 50,000,000 0
dalam Ribu Barel | in Thousand Barrels
.*/: ",.&/5 ") Crude O il ,0/%&/4" 5 Condensate *.103.*/: ",.&/5 ") Impor ted Crude O il /0/.*/: ",.&/5 ") Non-Crude HILIR | DOWNSTREAM dalam R ibu Bar el | in T housand Barr els PR ODUK | Pro duc ts 2011 2012 2013 2014 2015 A. B AHAN BAK AR | Fuels "WUVS - - - - - .# FOTJO3 0/ 17,060.98 19,050.03 18,623.48 19,938.46 20,239.51 Ker osene 64,460.02 67,683.71 67,819.01 70,828.54 71,732.60 ( BT0JM"%0)4% 14,378.12 10,807.63 9,614.33 7,332.29 4,977.11 %JFTFM0JM*%0.%' 119,568.24 122,099.35 122,907.40 129,501.56 129,305.98 'VFM0JM%$ 0*'0.'0 1,351.54 1,139.16 927.46 1,107.17 972.47 'VFM0JM%$ 0*'0.'0 20,276.34 15,042.80 13,878.81 12,243.15 11,978.51 Sub Total 237,095.24 235,822.68 233,770.49 240,951.17 239,206.18 BAHAN B AK AR KHUSUS | Sp ec ial F uel .# FOTJO3 0/ 736.38 514.09 566.46 545.07 627.34 .# FOTJO3 0/ 2,445.50 2,486.95 2,651.45 3,629.49 8,725.18 .# FOTJO3 0/ - - - 0.27 45.00 Per tadex 28.16 122.34 516.91 381.64 242.47 Sub Total 3,210.04 3,123.37 3,734.83 4,556.46 9,639.99 TO TAL B AHAN B AK AR | Tot al F uels 240,305.28 238,946.05 237,505.32 245,507.63 248,846.17 B. NON B AHAN B AK AR | Non F uels L P G 9,143.20 7,287.91 6,635.11 6,361.88 8,084.28 L
ube Base Oil
3,064.82 2,988.27 2,696.89 2,529.21 - Gr een C ok e 2,225.34 2,202.70 1,864.04 2,592.62 2,129.60 41#940-1): 166.96 152.54 158.55 75.54 66.87 -" 8 4 140.04 152.65 454.77 104.28 140.38 . VTJDPPM)"1 5.17 4.36 4.62 8.50 2.00 15 $' 403.35 - - - 242.53 1 PMZUBN ' JMN: BS O4QFDJBM1 MVí - - - 208.00 536.95 P ropane - - - 12.00 - P arax ylene 4,364.21 - - 548.20 1,688.83 " TQIBMU 1,965.24 2,050.91 1,714.80 1,687.61 1,719.75 M inasol - - - 3.00 18.00 1 FS UBTPM$" 10.92 19.84 34.06 32.56 33.43 P er tasol CB 27.01 35.77 45.73 44.18 36.80 P er tasol C C 16.41 21.79 27.01 38.99 13.02 . JOBS FY "#)* 242.69 246.50 236.33 189.30 167.51 )7* #4 - - - 616.00 1,871.00 )43 8 BY - - - - 67.00
HASIL PENGOLAHAN MINYAK INDONESIA 2011-2015
Indonesian Refined Products 2011-2015
Dir ekt orat J enderal M in yak dan G as Bumi Kement er ian Ener gi dan Sumber Da ya M ineral 36
ST
ATISTIK
Minyak dan Gas Bumi
2015 2015
ST
ATISTICS
Oil and Gas 37 Dir ec torat e General of Oil And G
as M inistr y of Ener gy and M ineral R esour ces