i
MASTER THESIS
Fatimatul Khikmiyah
097785007
SURABAYA STATE UNIVERSITY
MASTER PROGRAM
MATHEMATICS EDUCATION STUDY PROGRAM
ii
MASTER THESIS
A thesis submitted in partial fulfilment of the requirements for the degree of
Master of Science in Mathematics Education at Surabaya State University
Fatimatul Khikmiyah
097785007
SURABAYA STATE UNIVERSITY
MASTER PROGRAM
MATHEMATICS EDUCATION STUDY PROGRAM
ii
- Write time notation by using 24 hours notation ... 13
- Calculation in the unit of time... 13
- Measuring the angle ... 13
- Acquaint with the unit of distance and speed ... 13
- Solving problems related to time, distance and speed ... 13
3 METHODOLOGY ... 15
3.1 DESIGN RESEARCH METHODOLOGY ... 15
1. Preparation and design phase ... 15
4.1 AN INDONESIAN FABLE FOR REVIEWING STUDENTS INFORMAL KNOWLEDGE OF SPEED ... 21
4.2 MEASURING THROUGH COMPARING ... 26
4.3 ANALYSING DISTANCE AND TIME GROWTH DURING THE MOVEMENT... 30
4.4 DEVELOPING MODELS AND NOTATING SPEED IN A STANDARD UNIT ... 34
4.5 CONVERTING UNITS OF SPEED ... 36
4.6 EXPLORING RELATION AMONG SPEED, DISTANCE AND TIME ... 43
5 RETROSPECTIVE ANALYSIS ... 48
5.1 Try Out of Hypothetical Learning Trajectory 1 ... 48
5.1.1 Daily Life Situations and An Indonesian Fable As the Context ... 49
5.1.2 Measuri g Through Co pari g Acti ity ... 53
5.1.3 Analysing distance and time growth during the movement ... 58
5.1.4 Developing models and notating speed in a standard unit ... 64
5.1.5 Converting Unit of Speed ... 66
5.1.6 Exploring Relation among Speed, Distance and Time ... 70
5.2 Conclusion of Try Out of HLT 1 ... 74
5.3 Refinement of Hypothetical Learning Trajectory 1 ... 75
5.4 Hypothetical Learning Trajectory 2 ... 86
5.5 Teaching Experiment ... 92
5.5.1 Stude ts I for al K o ledge of Speed ... 92
5.5.2 Comparing Speed: When something is faster than another? ... 100
5.5.3 Speed determined by the distance travelled in a unit time ... 105
5.5.4 Speed is a proportion between a distance and time ... 113
5.5.5 Interrelation among speed, distance and time... 121
5.5.6 Assessment ... 126
6 CONCLUSSION AND DISCUSSION ... 138
6.1 Conclussion ... 138
Answer to the first sub research question ... 139
Answer to the second sub research question ... 142
6.2 Discussion ... 149
6.2.1 The use of toy cars in learning the concept of speed ... 149
6.2.2 Teacher s a d Stude ts I teractio ... 150
iv
LIST OF FIGURES
v
LIST OF TABLE
vi
vii ABSTRACT
Khikmiyah, Fatimatul. 2011. Supporting Students‟ Development of the Concept of
Speed. Master Thesis, Mathematics Education Study Program, Master Program of Surabaya State University. Supervisor: (I) Dr. Agung Lukito, M. S and (II) Sitti Maesuri Patahuddin, Ph.D.
Keywords : The concept of speed, design research, Indonesian fable, toy cars context, ratio table model
Speed is one of the concepts, which can integrate mathematics and science. Prior researches show that speed is one of the most difficult concepts during the upper grade of elementary school. However, Indonesian elementary students usually learn the concept of speed directly to the formal calculation by introducing them with the formula of speed as
distance divided by time and separated from students‟ experiences.
The main aim of this research is to design a local instruction theory to support students‟ development in the concept of speed. Hence, design research was chosen as an appropriate means to achieve the goals. A sequence of instructional activities with Indonesian fable and toy cars contexts was designed based on students‟ development and
Realistic Mathematics Education (RME) principles namely „guided reinvention‟,
didactical phenomenology, emergent modelling and emergent perspective. A teacher and twenty-five students in fifth grade of SD Al-Fatah Surabaya (an elementary school in Indonesia) are involved in this research.
1
1 INT RODU CT ION
Mathematics and science exist in children‟s surroundings although they do
not aware with it. Consider children who lean wide plywood board against many
blocks so that it becomes a ramp and start to move with gliding action on it. When
their action is too slow, they begin to think how to make it faster. They might
explore what happens if they make the steepness vary or use different length of
plywood then observe and communicate their exploration to each other. In this
example, children engaged in scientific observation, use the mathematical concept
of speed, distance, length, height and counting (the number of blocks to support
the ramp) as well the concept of ramp in physics. This example also explains how
the context of speed gives the opportunity for children to integrate mathematics
and science.
In informal situation, children are beginning to understand the meaning of
words and phrases like “faster”, “slower” and “as fast as” while they are seeing
the object moves, a person walks or run, the car travels and so on. They also start
to recognize and describe the positions of people or objects, how they move
through the space in relation to other people or other objects. Moreover, they will
try to describe and to compare the speed using their own words. We can see this
when young children for instance told to their friend that “the flash”, a superhero
in comics, can run as fast as light. Although they use the phrases “as fast as” it
does not mean that they know the concept of speed.
In formal situation, the concept of speed introduced to the students since in
learning kinematics in junior high school as well calculus in the higher education.
However, according to Gravemeijer, et al (2007) the concept of speed is one of
the most difficult in the upper grades of primary school. Children meet difficulties
in understanding the concept of speed because they must take into consideration
of two variables; distance and time (Piaget, 1971., Gravemeijer, et al., 2007). In
fact, children have the tendency to look primarily at the distance travelled, and
lose sight of the time that is required to travel this distance
(Thompson&Thompson, 1992). Moreover, Piaget (1971) explains that children
might compare properly the objects but still may not recognize the correct
relationship between distance and time. From his four teaching experiments,
Thompson&Thompson (1992) see a consistent pattern in children‟s development
of the concept of speed in which they differentiate into four levels. However, only
a few studies on the teaching and learning process for the concept of speed in the
elementary school. Therefore, more study still needed to observe how students
think and reason about the concept of speed.
The important principle in this study is what Freudenthal‟s idea that views
mathematics as a human activity instead of seeing mathematics as a subject to be
transmitted (Freudenthal, 1991). His idea then transmitted as Realistic
Mathematics Education (RME), which has it origin in the 1970s. The instructional
activities that we proposed here based on RME principles and more emphasize on
„guided reinvention‟, didactical phenomenology, emergent modelling and
The main aim of the research is to design a local instruction theory to support
students‟ development in the concept of speed, especially for elementary
education in Indonesia that more emphasizes on formal mathematics in which the
concept of speed given as “distance by time” rigorously. Because speed is
distance by time then we can get the distance by multiplying the speed with the
time and get the time by divided the distance by speed. Students in upper grade of
elementary school in Indonesia mostly know this rule but it is difficult for them to
give reasons behind. Hence, the research question of this study is:
How can we support students‟ development of the concept of speed?
In order to answer that research question, we design a sequence of
instructional activities with Indonesian contexts, which facilitate students in
developing their own models as one of their reasoning ways to explain the
concept of speed and interrelation among speed, distance and time.
Definition of Terms
1. Support
2. Development
3. The concept of speed
The concept of speed here means speed as a proportion between two different
4
2 THEOR ET IC AL FRAM EWO RK
2.1 THE C O N C EP T O F S P EED
In everyday usage, the terms „speed‟ and „velocity‟ are interchangeable
(Serway, 2009). We may also wonder the use of letter instead of for speed.
Cassidy et.al, (2002) explain that the concept of speed is closely related to the concepts of velocity, from which the symbol arises. Speed is perceived as the
property of an object that is relative to the ground (Doorman, 2005). Speed
indicates how fast something is moving regardless of whether or how it may
change the direction. In present study, we use term speed instead of velocity since
we only concern with speed as the quantity of motion and this is what the students
learn in elementary schools.
Although children have certainly become acquainted with speed, in the
context of race, look closely at the speedometer of the car and so forth, the
concept of speed is still one of the most difficult quantities in the upper grade of
primary school (Gravemeijer, 2007). There are two main issues concern with this
fact. First is a conceptual problem. Speed can be called as a compound quantity
(Halloun&Hestenes 1985 in Doorman, 2005;Gravemeijer, in press), a rate
(Thompson&Thompson, 1992;Abels, M., 2006), or a composite quantity
(Gravemeijer, 2007;TAL Team, 2008). These terms refer to a proportion between
two different quantities, distance and time. It is also the reason that in physics,
speed classified as a derived physical quantity (Ellse et al, 2003). Since speed is a
compound quantity then children must pay attention simultaneously to two
the tendency to look primarily speed at the distance travelled and lose sight of the
time that is required to travel this distance, 40 km/h according to them refers to a
distance of 40 km and the unit of time is implicit. This fact might be one of the
reasons why students get difficulties in determining the time needed to take 250
meters if the average speed is 40 km/h.
The second issue is a gap between the concepts with daily life situation since
the concept of speed refers to a type of imaginary situation. A man driving a car
with 40 km/h is assumed would travel 40 kilometres if he drives exactly 1 hour.
However, he does not have to drive with this speed for exactly one hour to have a
velocity 40 km/h. The speed 40 km/h can represents both instantaneous and
average speed. Instantaneous speed means speed at a moment that can be
approximated with a time interval that tends to zero meanwhile average speed is
related to distance travelled within a time interval (Doorman, 2005). As the
children see the tool for measuring speed such as a speedometer in a car, they see
instantaneous speed but as soon as we give meaning of speed we use a time
interval and lost the instant. This is an aspect that not easy to reach for children.
In four teaching experiments with one fifth grader, four sixth grader and one
whole class with 32 seventh grader, Thompson&Thompson (1992) see a
consistent pattern in children‟s development of the concept of speed as follow ;
1. Speed as a distance
Children begin thinking of speed only of distance-how far one goes(in one unit
time). This conception often revealed in the way they express a speed in
expressing an elaborated unit, “he goes 45 miles in an hour”. This image of
speed does not involve time as an explicit quantity.
2. Distance increases then time follows
Children begin to think that speed involves two separate quantities, distance
and time. Speed as a distance moved in one time unit. Time is explicit in
students‟ awareness but the distance is prominent. They come to anticipate that
travelling a number of speed-distance (how far one goes in one unit time)
produces an identical number of time units but thinking of a number of time
units does not automatically evoke an image of an identical number of
speed-distance.
3. Distance and time accrue simultaneously
Distance and time increase simultaneously and continuously. Moving for
speed-distance implies moving for one time unit and vice versa. This is the first
occasion wherein students reason about speed multiplicatively. The
multiplicatively is not numerical but logical-distance and duration co-occur
(Piaget, 1970). Here, children can view speed involve a constant proportion.
The constancy is in the simultaneous increase of the same amount of distance
and same amount of time and vice versa but it does not support an awareness
the same proportion of the total distance and time.
4. Speed as a rate
Distance and time increase simultaneously and continuously and in
proportional correspondence. The proportion between the distances in time unit
Researchers have shown that students have the tendency to look primarily at
the distance travelled (Thompson&Thompson, 1992; Gravemeijer, 2007) and lose
sight the time that is required to travel this distance. Historically, it has also taken
a long time before people accepted that the proportion between two different
quantities could be used as a unit. Hence, we believe that it is important for
children to learn speed first as the type of measurement that involves distance and
time. People use a speedometer as an apparatus to measure the speed but we
cannot use it to measure the speed of animals or someone who moves. However,
we can use the combination of apparatus of measuring distance and time such as
measuring tapes and stopwatches to express speed. This situation can be
problematical for students in elementary school so that it provokes them to
analyse and gives them the opportunity to the process by which mathematics was
invented.
Given students‟ difficulties in understanding the concept of speed and
students‟ development of the concept of speed, in present research we design the
instructional activities which in line with Realistic Mathematics Education
(RME). By designing and enacting an instructional unit for fifth grade students,
we try to create a learning environment in which we can observe how students
think and reason about the concept of speed and it relations with distance and
time.
2.2 REA LI S TI C MA TH EM A TI C S ED U C A TI O N
Realistic Mathematics education is rooted in Freudenthal‟s interpretation
involving solving problems, looking for problems and organizing a subject matter
and mathematizing as the main activity (Gravemeijer., 1994). It was Treffers who
placed the two ways of mathematizing. He distinguished „horizontal‟ and
„vertical‟ mathematizing. In the case of horizontal mathematizing, mathematical
tools are brought forward and used to organize and solve a problem situated in
daily life. Vertical mathematizing, on the contrary, stands for all kinds of
reorganizations and operations done by students within the mathematical system
itself (Van den Heuvel-Panhuizen, 2003). The central principle of RME is that
mathematics should always be meaningful to students. The term „realistic‟
stresses that problem situation should be „experientially real‟ for students. This
does not necessarily mean that the problem situations are always encountered in
daily life. Students can experience an abstract mathematical problem as real when
the mathematics of that problem is meaningful to them (Bakker, 2004).
RME offers heuristic or principles for instructional design in mathematics
education ; guided reinvention, didactical phenomenology and emergent
modelling (Gravemeijer, 1994). The following session will describe these
heuristics.
2. 2. 1 Guided reinvention
The reinvention principle in RME states that students should be given the
opportunity to experience a process similar to the process by which mathematics
was invented (Gravemeijer, 1994). It means that it allows the learners to come to
regard the knowledge they acquire as their own private knowledge, knowledge for
students reinvent the unit of speed that involving the unit of distance and time as
the way to quantify something moves. The reinvention principle can be inspired
by the history of mathematics and the informal procedure. In order to support the
reinvention principle, the appropriate contextual problem that allow for a wide
variety of solution procedures need to considered.
Didactica l Pheno meno logy
A didactical phenomenology refers to looking for the situation that creates
to be organized by the students. Such an analysis investigates how the concepts
we want to teach help organise this situation, and how they can be problematical
for the students (Doorman, 2005). The phenomena “beg to be organised” is used
as the starting point for education. We use the phenomenon of measuring speed of
humans or animals moves in daily life as the starting point since one cannot use a
tool like a speedometer to measure but indeed, he can use the combination of
apparatus for measuring distance and time to measure the speed.
2 . 2 . 2 Eme rg ent M odellin g
In the third principle, self-developed model play as the bridge of the gap
between the informal knowledge and formal mathematics (Gravemeijer, 1994). In
RME, it is expected that the students develop the models by themselves.
Materials, visual sketches, paradigmatic situations, schemes, diagrams and even
symbols can serve as model (Treffers and Goffree, 1985; Treffers 1987, 1991;
Gravemeijer, 1994a in Van Heuvel - Panhuizen, 2003). The models first appear as
Then gradually it generalized over situations become a model for mathematical
reasoning to foster higher-level ideas.
The concept of speed is a type of imaginary situation as we explained
before. Here students need materials, visual sketches, schemes, and so on to
organize the situation. In present research, we will never know exactly what kinds
of models that will appear. However, the sophisticated models for the concepts of
speed are models for proportional reasoning, which are the ratio table and the
double number line because they both offer a systematic way of writing down the
relation between distance and time (Gravemeijer, et al 2005).
A ratio table is a mental model as well as a work sheet. It plays an
important role in the curriculum on proportion (Gravemeijer, 2007). Ratio table is
an ideal aid for making handy calculations and gaining insight because the table
invites students to write down intermediate steps. Moreover, they explain that the
strength of the ratio table is that students can reason with number relationship that
they already know. To calculate how long someone will take to cycle 20 km at an
average speed of 15 km/h, one can do as :
km 15 5 20
minutes 60 20 80
From the table above we can see clearly every intermediate steps and what they
mean. In this case, 15 km in 60 minutes means the same as 5 km in 20 minutes.
From the table also students might immediately see that we can go from 15 to 20
to calculate from 15 km to 20 km so that he/she makes a ratio table as shown
below:
km 15 30 10 20
minutes 60 120 40 80
Another model that can be used to explain the concept of speed and it
relations between distance and time is double number lines. A double number line
has the same principle with a ratio table but the position of points in double
number line is meaningful. This model allows students to link distance and time
together; it is allow students to make accurate calculations and estimates as well.
To calculate how long someone will take to cycle as the problem above, a double
number line will show as follows:
5 15 20
20 60 80
Above we can see that the intermediate steps that had been used is actually same
with the first example in the ratio table; 15 km in 60 minutes means the same as 5
km in 20 minutes hence multiply the proportion of 5 km in 20 minutes by 4 would
get 20 km in 80 minutes. All of the models show the same result in which with an
average speed of 15 km/h someone need 80 minutes to travel 80 km of distance.
Ratio table and the number line model can work together for the concept of
speed and it relations between distance and time. However, these models are not
familiar in Indonesia even in mathematics textbook so that we conjecture that it is
the learning process give students opportunity to make the model of the situation.
Afterward, teacher can provoke them to make a table that has the same principle
with a ratio table but more in vertical forms since students‟ book provide the lines
in horizontal way so that make a vertical table is easier and more natural than a
horizontal table.
2.3 EM ER GEN T PER S P EC TI V E
Emergent Perspective is an interpretative framework for analysing or
interpreting the classroom discourse and communication. This perspective can be
used to understand mathematical learning in the social context of the classroom.
In this study, we pay attention mostly in social perspective. In specific, related to
social norms and socio mathematical norms. Social norms refer to expected ways
of acting and explaining that become established through a process of mutual
negotiation between the teacher and students. Meanwhile, the socio-mathematical
norms are the ways of explicating and acting in whole class discussion that are
specific to mathematics. In other word, it related to the teacher in which what he
wants mathematics to be for his or her students. Examples of socio-mathematical
norms include what counts as a different mathematical solution, a sophisticated
mathematical solution, and so on (Gravemeijer, 2006)
Before the learning process, we conjectured that both teacher and students
have their own beliefs about their roles. During the learning process, it is expected
that teacher initiates and develops social and socio-mathematical norms as
the learning process will bring the students to the more democratic in the way of
thinking.
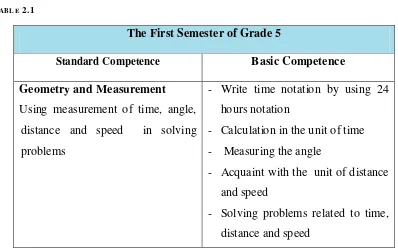
2.4 THE CO N C EP T O F SP EED I N IN D O N ES I A N CU R R I C U LU M
Based on Indonesian curriculum, the concept of speed in is taught in the
five grade of elementary school. The table describes the concept of speed in fifth
grade of elementary schools.
- Calculation in the unit of time
- Measuring the angle
- Acquaint with the unit of distance
and speed
- Solving problems related to time,
distance and speed
As explained above that in order to understand the concept of speed as a
rate students must first conceive the length of displacement, then perceive a
measure of duration and be able to compare the time intervals of different events.
Meanwhile, the preliminary concept of its are measurement length and time in
metric system is studied in grade 3. Therefore, we assume that students in fifth
15
3 M ETHODOLOG Y
In this chapter, the researcher will desribe the research methodology,
research subject, how data wull be gathered and the methods used to analyze it
including the reliability and validity.
3.1 DES I GN R ES EA R C H M E THO D O LO GY
As described in the first chapter that the main aim of this research is to
develop a local instruction theory for the concept of speed. For this purpose, the
present research falls under the general heading of design research. According to
Bakker (2004) design research, developmental research, and design experiments
all treat design as a strategy for developing and refining theories. Furthermore, he
explained that the main objective of design research is to develop theories
together with instructional materials. In order to reach the research aim, a
sequence activity with Indonesian context was designed to improve educational
practises in learning the concept of speed for five graders of elementary school.
A design research which is used consists of cycles of three phases as
following:
1. Preparation and design phase
2. Teaching experiment
3. Retrospective analysis
It is evident that the relevant theory about the topic should be studied
before designing the research. In this research, the theory came from various
sources in mathematics, science, realistic mathematics education, design research
process. Then, the researcher collected Indonesian contexts together with the
activities. Indonesian context used as the uniqueness meanwhile the important
criterion for selecting the activities were its potential role towards the end of the
goal. Both of these resources carried out in the discussion with the supervisors and
colleagues in order to make a design of the Hypothetical Learning Trajectory
(HLT). This hypothetical learning trajectory assumed could be adjusted with the
actual learning process in the teaching experiment.
The teaching experiment will be conducted in the second semester of the
fifth grade in the academic year 2010/2011 during three weeks (eight lessons)
with 70 minutes of the duration for each lesson. The purpose of this phase is both
to test and to improve the conjecture of the learning trajectory that was developed
in the previous phase and to collect the data for answering the research questions.
A further phase of the methodology is the retrospective analysis. In this
phase, HLT compared with the actual learning process so there might be a
revision or reformulation of the HLT as the adjustment with the actual conditions.
In order to answer research questions, the whole data then be collected,
interpreted, analysed and confirmed.
3.2 RES EA R C H SU BJ EC TS
The study will be conducted with a teacher and twenty-three students in
the fifth grade of SD Al-Fatah Surabaya. The students are about 10 to 11 years
old. Based on the curriculum, they learn the concepts of time and length as
3.3 DA TA CO LLEC TI O N
Various data sources are collected in order to follow the learning process
and to answer research questions. Hence, the data collection of this research is
described as follows:
a. Video
During the teaching experiment, two cameras record videotapes; one camera
as a static camera to record the whole class activities and the other camera
records the discussion in the group of students. There are also videos of the
interviews with the teacher and the students.
b. Written data
The written data from students‟ work in solving the problems during the class
activity and in the final assessment provide more information about students‟
achievement in learning the concept of speed. Therefore, the written data here
include students‟ work during the teaching experiment, observation sheets,
the results of assessments including the final assessment and some notes
gathered during the teaching experiment.
3.4 DA TA AN A LY S I S, RE LI A B I LI TY A N D VA LI D I TY
3.4.1 DA TA AN A LY S I S
The data were analyzed retrospectively use the HLT as the guideline.
Meanwhile, the process of data analysis involves making sense out of text and
image data. It involves preparing the data for analysis, moving deeper and deeper
into understanding the data and making interpretation of the larger meaning of the
could inform the HLT and answer the research question. Then, the conjectures
about the students‟ learning and views are generated, tested at other episodes and
other materials (students work, field notes, and tests). The test for the
confirmation and counter the examples. The analyses also discuss with colleagues
and the supervisor in order to recheck our interpretation and probably could think
alternative interpretations.
3.4.2 RE LI A BI LI TY
- Data triangulation
Data triangulation is built from different data sources, such as the
videotaping of the activities, students‟ work and notes from the observer.
- Intersubjectivity
Intersubjectivity is applied by involving colleagues in the observations and
in analysing the data.
- Trackability
Trackability means that the reader must be able to track the learning
process of the researchers and to reconstruct their study: failures and
success, procedures followed, the conceptual framework used, and the
reasons to make certain choices must be all reported (Bakker, 2004). In
this study, we describe the process of the study systematically to offer
other researchers the possibility to retracing our conclusions through the
3.4.3 VA LI D I TY
- HLT as means to support validity
In order to support the validity of this study, we use HLT as the
formulation and verification of the conjectures about the students‟
development. The teaching experiments and data analysis are the result of
either verification of the conjectures‟ or in adjustments or new conjectures
for subsequent experiments.
- Triangulation
The validity supported by different methods of data collection as we
20
4 HYPO THE TI CAL LEA RNI N G TRA JEC TORY
The development of an instruction theory according to Bakker (2004)
includes both the design of such instructional means and research of how these
support in students‟ reasoning. The first part implies that it is important to design
an instructional environment that supports both the learning process and students‟
reasoning. Dealt with this, Simon in Simon and Tzur, (2004) offered the
Hypothetical Learning Trajectory (HLT) as a way to explicate an important aspect
of pedagogical thinking involved in teaching mathematics. An HLT consists of
the goal for the students‟ learning, the mathematical tasks that will be used to
promote students learning, and hypotheses about the process of the students‟
learning.
An HLT has different functions depending on the phase of the design
research (Bakker, 2004). During the preparation phase, the HLT guides the design
of instructional materials that have to be developed or adapted. During the
teaching experiment phase, the teacher and the researcher use the HLT as a
guideline what to focus on in teaching, interviewing and observing. Meanwhile,
the HLT functions as a guideline to determining what the researcher should focus
in the retrospective analysis phase.
The end goals of the learning process are students can develop the concept
of speed as a compound quantity and use their proportional reasoning in order to
explain interrelation among speed, distance and time. Based on these endpoints,
informal knowledge of speed, measuring through comparing, Analysing distance
and time growth during the movement, developing models and notating speed in a
standard unit, converting units of speed and exploring interrelation among speed,
distance. As the last part of the sequence, we asses students‟ development of the
concept of speed that they learned before. The following is a description of the
Hypothetical Learning Trajectory used in this present research:
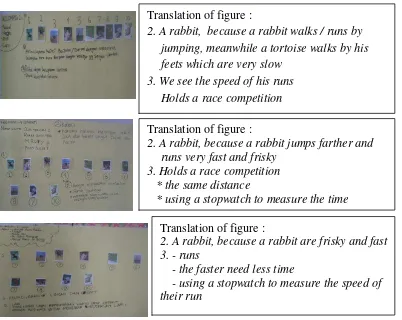
4.1 AN IN D O N ES I A N F A B LE F O R R EV I EW I N G S TU D EN TS‟ I N F O R M A L
KN O W LED GE O F S P EED
Goal (s) :
Reviewing students‟ informal knowledge and a general discussion of motion
and speed
An Introduction part :
We can see motion from our daily life, a baby crawls, mother walks, a boy
run, animals running fast to catch up its prey, people ride bicycles or motorcycles,
cars travel in the street and so on. Human use speed to quantify motion so that it is
easy to answer a question such “Which one is faster” and “How fast is something
moves?”
A famous folktale for Indonesian children relates to the concept of speed is
a fable „Kancil dan Siput‟, so that is why it used in the introduction part of the
teaching and learning process. A Kancil known as a mouse deer and siput is a
snail. Mouse deer lives in the jungles of Africa, Asia, and many Pacific islands. It
is an animal about the size of a cat, has the legs and the tail of a deer, and the face
eats only plants, but lots of animals eat the mouse deer. Hence, to stay alive, it
must be quick and smart. Based on the fable, Kancil challenged snail to compete
in running. Snail accepted that challenge on condition that he decided the rules
and as the result, the snail won the competition.
During the learning process, first teacher can asks students whether they
know the fable, what is „Kancil‟, what is „Siput‟ and what is the fable told about
the result of the race competition between „Kancil and Siput‟. It is expected that
students will criticize the fable with the idea that it is impossible for „Siput‟
winning the competition instead of Kancil since normally kancil is faster than
siput. Students may also say that there was un-fair competition happened. It is
also expected that they come up with the reason behind such as :
- if kancil and siput run at the same starting point and the same time then
we‟ll can see immediately that kancil will left siput behind.
- siput may start runs first then kancil runs five minutes after, then it is not
difficult for kancil to overtake siput.
However, students who did not know what is kancil and siput and how its run
may accept that nothing wrong in such situation since it is in a folktale. Teacher
can anticipate it by showing the picture of kancil and snail, ask some students to
pretend as kancil and siput then ask them walk imitatively. After this introduction
part, students are asked to work in a small group (4 or 5 students) for around 10
minutes to solve this following problem.
Problem(s) :
2. In your opinion, what is the fastest and animal and discuss the way to
compare the speed of the animal in order to know the fastest animal.
Conjectures of students‟ thinking :
It seems very difficult for the students to order all of the animals. They can
determine the slowest animal but to order the entire animal in a correct way then
decide the fastest animal is not so easy. However, students might use their
informal knowledge such as from daily life, from the article, from the video or
television that shows how the animals run etc. In deciding which one is faster
between a giraffe and a kangaroo for instance, students might say since a giraffe
has long legs than a kangaroo then a giraffe is faster than zebra. Other students
might also say that a kangaroo is faster than a giraffe because they saw how these
animals ran in the television, etc. There are also possibilities that some students
only guessing. In the discussion of the way to compare the speed of the animals,
students might come up with the idea of a running competition like in the fable.
Discussion :
It is predicted that there will be various answers in ordering entire animals
discussion of speed. Teacher can start with ask the students whether they feel
confidence with their answers, if there are various answers in ordering the animals
and deciding the fastest one what will they do to get the correct answer? How can
they compare the speed of the animals? In addition, why they use that way? To
answer the questions students might come up with the idea of searching the speed
of the animals in the internet; hold a running competition for the animals, etc.
Human moves and so do the animals. We can see directly who is the fastest in
human running competition although the number of participants is so many
because they know that they must run in certain distance with certain rule but
doing the same for animals is not so easy. Children realize that the fastest is the
one who first reach the finish line but it does not mean that they will relate it with
the distance and time directly. Hence, teacher should emphasize that the important
thing of a running competition is the fastest or the winner is the one who has least
time to go to the finish line or with other words at the same distance, the winner
needs least time than the others.
Another way to compare the speed of the animals with the same idea with a
running competition is measure the time of each animal to reach certain distance
one by one. From here, we can see directly how the distance and time involve in
comparing the speed. If the second way is not appears during the class discussion
then teacher can tell students about the experiment by a British man who measure
the speed of cheetah in Kenya. First, he measured off 200-meter dash, a distance
that sprinters run throughout the world. The track was on level ground and
white wool yarn between the posts. At the finish, he marked a line on the ground
between the two posts. To make sure his stopwatch was correct; he checked it
against two stopwatches of the Kenya Athletic Association. Then he picked a
quiet, windless day for the experiment. To get ready for each test, the cheetah was
held around 17 meters behind the starting line. A truck, with its engine running
and ready to go, was 70 meters down the course. The coach stood in the back of
the truck. In one hand, he held the stopwatch, in the other a piece of meat that had
been shown to the cheetah. He shouted for the cheetah to be released, and started
the stopwatch when she broke the yarn at the starting point. A driver revved up
the truck to stay ahead of the cheetah until well beyond the finish line. The coach
stopped the watch when he saw the chest of the cheetah cross the finish line. Then
he threw down the meat to let the cheetah eat it. Two more trials were made, with
a thirty-minute rest between them. The times for the three trials were 7.0, 6.9, and
7.2 seconds then he decide that the time needed for the cheetah is more or less 7
seconds.
These two ways are useful in introducing the speed but most of the time it is
only focus on the same distance instead of using the same time. However,
students can also decide which is the fastest by measuring the animals‟ distance
reached in a given time. The fastest animal is an animal that reach furthest
distance in the same time. From the ways to compare the speed of the animals, it
is expected that students realize that speed is involving the distance and time,
go faster then the distance travelled is further but it need less time to reach given
distance.
4.2 MEA S U R I N G THR O U G H C O M P A R I N G
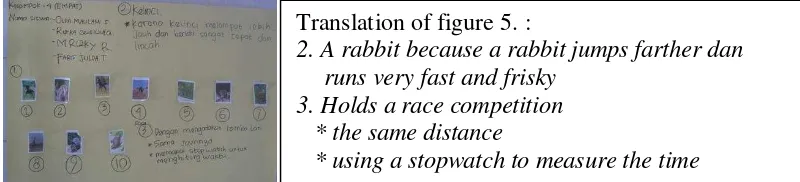
A Contextual situation:
In this activity, we use „toy cars‟ to change the context of animals since
students are familiar with toy, it is possible for them to investigate the speed of the
toy cars directly and using toy cars we can keep the speed in constant. Next, the
term a car used here refers to a toy car.
Goal (s) :
Students can compare the speed of two toy cars
Mathematical ideas :
- Complete motion involves distance travelled and amount of time required
to travel that distance.
- Comparing speed means compare the distance and time simultaneously
Problems :
1. Compare the speed of these two toy cars. Which car is faster?
2. Make a drawing of your investigation of those two cars so that other persons
know how fast the car compares with the other! How many times is it faster
than the other?
Description of the activity(s) :
The students are asked to work in small groups (4 or 5 students). They would
minutes. Teacher will not tell the way to compare the speed. After that, students
will present their work in the class.
Conjectures of students‟ thinking and discussion:
In deciding the faster, the students might come up with these strategies:
Carry out a race competition;
- Students in the group hold the car, put the car side by side, let the cars go
and see the car which overtake the other car is the faster one
- Students in the group hold the cars, put the car side-by-side, let the cars go
and some students in front of them are ready to catch the car. The car that
comes first to them is the faster car.
Compare the speed numerically
- Students in the group make a path for the cars, let the cars run one-by-one
and measure the time needed for each car, the car needs less time is faster
than another does.
- Students in the group hold the cars, put the car side by side then let the
cars go. Meanwhile, one student keeps the time and other students stop the
car at certain time that they want. The car that goes further is the faster.
- One Student in the group keep the time, one student hold and let the car
goes one by one, and other student stop the car in the time that they
choose. After that, they measure the distance travelled by the car. The
faster car is the car that goes further in the same time
Students are free to choose the way they used to compare the car, so that there
generalize two possible approaches, namely using the given distance and the
given time. By the given distance, the car that need less time is faster. Inversely
in the given time, the car travelled further is the faster. Students can see this
relation clearly, if they make a drawing of it as mentioned in the second problem.
Through the problems, we also expect that children realize that it is important to
quantify the speed so that we know exactly how the car goes fast than other. By
quantifying the speed students can say for instance, the car A is twice faster than
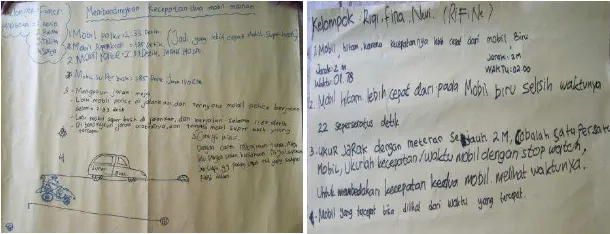
B, three times faster etc. Students might draw as following:
Drawings of the race path
From the drawing children can explain that car A need less time than B so that
it is faster. Teacher can use this drawing to discuss such as if the faster car reach
the finish, where is the other car at that time so that children also come up with the
idea that the faster car reach further distance in the same time. After that how can
children know how much is it faster?, Almost twice, three times and so on. We
expect that students will come up with the idea of measuring the distance.
Make a drawing that after 5 sec for instance:
The distance of car A :
The distance of car B:
The advantage of the drawing above is students can compare in a visual way.
We can see that for instance car A is almost twice faster than car B through these
drawings. Although not all might appeared in the class, teacher still can continue
the discussion like :
- If it is only the first drawing appeared; we know from the drawing that car A
reach the finish line earlier so that A is faster than B. Then at the time A reach
the finish line, where is the position of the B?
- If it is only the second drawing appeared; we know from the drawing that car A
need less time to reach the finish line. Hence A is faster than B. Then, if the
cars travelled with the same time, how far is A? Is it have the same distance
with B or how?
- If it is only the third drawing appeared; we know from the drawing that car A
reach further distance than B. Hence, A is faster than B. Then which car need
less time to reach for instance one lap in race competition?
Through the discussion, we expect that students will realize that comparing speed
and time simultaneously when something is moving, how much the distance
travelled in a given time or vice versa. Then teacher can continue that students can
not show precisely how fast something than other from the drawing. It is also
difficult for them to explain if they asked to compare many cars for instance if
each students in the class or even in the school bring their cars and they want to
compare it all. Hence, they need to find the way to state the speed in such a way
other people know which car is fastest, the second fastest, the third and so on and
how fast it is.
4.3 AN A LY S I N G D I S TA N C E A N D TI M E GR O W TH D U R I N G TH E
M O V EM EN T
Goal (s) :
- Students can measure and estimate the time needed by toy cars to travel
given distance
- Students can draw the situation of the movement of the cars to travel given
distance.
Mathematical ideas :
The distance and time increase simultaneously and continuously during the
movement.
Problem(s) :
1. Investigate the time needed by the car travelled in 2 meters!
2. Predict how much time it will take if the car continues to travel once around
3. Make a drawing of the car travelled the class and give an explanation in the
increasing the distance and time!
Description of the activity :
As the starting point of the activity, teacher will review what the students did
in previous lesson in which students compare the speed of two cars and possible
approaches to compare the speed. In this activity, students will compare various
cars by measuring the time needed for each car to reach certain distance, make a
prediction of the time if the speed is constant then analyse the growth of the
distance and time during the cars travelled. Teacher asks children to work in small
groups then gives them a car (each group has a different car), a stopwatch, a
measuring tape and the problem as well. After the group discussion, students will
present their works in the class.
Conjectures of students thinking: Problem 1
- Students will make a path of 2 meters; choose the start and the finish line.
One student holds the stopwatch and another student holds the car. After that,
they let the car run and stop the stopwatch while the car reaching the finish
line. Students may only doing once or more in order to get the valid data.
- Students only make a path of 1 meter; choose the start and the finish line. One
student holds the stopwatch and another student holds the car. After that, they
let the car run and stop the stopwatch while the car reaching the finish line.
The time needed to reach 2 m is twice of the time needed for 1 m path.
- Students measure the length and the width of the class then calculate its
perimeter. After that, based on their works in problem 1, students estimate the
time needed for the car to go around the class once as follow :
The car travelled for 2 meters in 5 second
The length of the class is 6 meters
The width of the class is 5 meters
The perimeter of the class is 2 × 6 + 2 × 5 = 22 meters
The time needed to around the class once is
22∶ 2 × 5 = 11 × 5 = 55
- Students measure the perimeter of the class by measuring the whole side of
the class. After that, based on their works in problem 1, students make a
calculation to estimate the time needed for the car to go around the class once
as follow :
The car travelled for 2 meters in 5 second
The perimeter of the class is 22 meters
The time needed to around the class once is
22∶ 2 × 5 = 11 × 5 = 55
Conjectures of students‟ drawing in Problem 3
Discussion :
Teacher can start the discussion with students‟ answers in the first problem.
Since there are different cars in each group then the answer also might be vary.
From various answers teacher can ask students such as, which car is fastest? If the
time needed for a car in-group A is the least one than what will be for the second
problem, Will it does so?
After that, teacher can come to the second problem by analysing students‟
work in determining the perimeter of the class as the distance travelled for the
cars. The accuracy is on the discussion instead of children‟s way of measure the
perimeter. However, teacher can also use this to assess students‟ knowledge in
measuring the length as the basic knowledge for distance. The discussion then
continues with students‟ answer in determining the time needed by the cars to
round the class. We do not expect that students really let the cars travelling the
class to come to the answer. However, we expect that they realize that if they
know the time needed by the cars to travel in 2 m and know perimeter as well,
then they can predict the time needed to round the class once, even twice, three
times and so forth.
Teacher can continue the discussion by analysing students‟ work in drawing
the journey of the car around the class. Through these drawing, we expect that
students can see the situation in which during the cars travel, both distance and
time growing simultaneously and continuously and the accruals of quantities stand
in the same proportional relationship with their total accumulations. If there is
outside in various distance for instance 6 m, 10 m etc and teacher asked them to
measure the time. Through this investigation, we expect that students fell
confidence with the prediction of such situation.
4.4 DEV E LO P I N G MO D E LS A N D NO TA TI N G S P E E D I N A S TA N D A R D
U N I T
Goal(s):
- Students can determine speed in a standard unit
- Students can develop their own models as a tool for solving problems
Mathematical ideas:
- Distance and time have proportional correspondence
- Speed as a compound quantity determine by the distance travelled in a unit
time.
Problem(s):
1. Make a long list of the distance travelled by your car after many seconds
on the table!
2. How do you determine the speed of the car? Explain your answer!
Description of the activity:
In this activity, children use the result of their investigation in previous
lesson. They still works in the same group to solve the problems given around 20
minutes then present their works in the class.
Conjectures of students‟ thinking:
Problem 1
Distance (meters) Time (seconds)
2 5
4 10
... ...
24 60
1440 3600
Problem 2
- The speed of the car is 2 meters in 5 minutes
- The speed of the car is 0,4 m/s
- The speed of the car is 10 seconds for 4 meters
- The speed of the car is 24 meters in one minutes or 24 m/minute
- The speed of the car is 1440 meters in one hour or 1440 m/hour
Discussion :
From this activity, students will explore more their prediction in the distance
travelled by the car but more focus on the number. Through the presentation of
children works, we expect that there are various ways to show how the distance
and time increasing during the journey. Whatever the way they used, the numbers
shows clearly the increasing multiplicatively of the distance and time. On the
other words, it shows proportion between distance and time in which always the
same. When the distance increases twice, three times and so forth, then the time
increases as well. The proportion of increasing quantities is in the same proportion
say about the distance travelled by the car in one minute, one hour, two hours or
even one day for instance because 60 seconds means 1 minute, 3600 seconds is
one hour and so forth.
The discussion on the second problem emphasize on a standard unit of
determining the speed. Possible answers such as in the conjectures are correct but
some students may know how the speed usually state in daily life as like in metric
system. In metric system, speed is usually expressed in kilometers per hour (km/h)
or meters per second (m/s). When people use the standard unit of speed then it is
easy for them to compare speed around the world. The discussion then focuses on
the way to express the speed in m/s.
4.5 CO N V ER TI N G U N I TS O F S P EED
Goal (s) :
Students can read and explain what the sign road means and what the
speedometer shown
Students can distinguish between maximum, average and instantaneous
speed
Students can convert the units of speed
Mathematical ideas :
Instantaneous speed means speed at a moment
Average speed related to distance travelled within a time interval
Speed can be expressed in m/s or km/h
What is the road sign explain? What does the speedometer show? If the speedometer points into 40, could you explain what is it mean?
Can we drive with 40 km/h in 10 minutes?
In the previous activity, students measure the speed of the toy cars. They can
express the speed of the toy cars in meter per second (m/s). However, in daily life
it is easy to see that speed expressed in kilometres per hour (km/h) for instance in
a speedometer and the road sign. Hence, in the first part of the lesson teacher
bring the picture of a road sign and a speedometer as the part of the discussion.
Description of the activity(s) :
Teacher starts the activity by giving the poster of a sign road and a
speedometer to the students. After that, teacher guides an interactive discussion
about it. First he/she can ask the children such as “What is the sign road explain?,
What is the speedometer shown? How does the speedometer point to the number,
is it fix or changeable? If the speedometer points into 40, could you explain what
it means?” After class discussion, teacher then asks students to work in small
group to solve the problems below in around 30 minutes. Teacher then discuss the
answer in the class by asking the students to explain their answers, posting
questions, giving feedbacks and reinforcements on it.
Conjectures of students‟ thinking and discussion :
Conjectures of students‟ answer in first class discussion
A sign road poster
- The sign shows that when we enter the campus area, the speed of the vehicle
must be 10 km/h
- The sign shows that when we enter the campus area, we must walk
- The sign shows that when we enter the campus area, we can‟t drive fast
- The sign shows that when we enter the campus area, the speed of the vehicle
must be 10 km/h at maximum
A speedometer poster
First Question
- Speedometer shows how fast someone rides the motorcycle or the car. If the
speedometer points into 40, it means that our speed is 40 km/h at that time
and we can reach 40 kilometres of distance in one hour.
- Speedometer shows the speed of motorcycle or the car. If the speedometer
points into 40, it means that it is not very fast.
Second Question
- No, we cannot drive with that speed in 10 minutes since the speed express in
one hour
- No, we cannot drive with that speed because 10 minutes is less than one
- Yes, we can because when my father start to move then I see that the pointer
in speedometer also start to move
- Yes, we can because the speedometer shows the speed at that time and the
pointer sometimes moves up if we go faster and moves down if we go
slower
The problem given in the class for reviewing students‟ knowledge based on
the discussion in the previous lesson. Students had stated the speed of toy cars in
m/s, for instance if the speed of the car is 3 m/s then the toy cars will travel 3 m in
1 second, 6 m in 2 seconds and so forth. On the discussion, teacher should
emphasize that as km/h means that one assumed can reach the distance of 40 km
if he travels in one hour, 80 km in two hours and so forth. The difference between
the speed of toy cars and the motorcycles, cars etc is in the toy cars, the speed is
constant but in motorcycles, cars, etc since sometimes one should aaccelerate or
put on the break. However, using mathematics people can predict the time needed
or the distance travel if they know the speed.
The discussion is also about maximum, average and instantaneous speed.
Teacher can first ask students what they know about maximum speed then
emphasize that the sign shows the maximum speed, from the word maximum it
means that people are forbidden to enter the area with the speed more than 10
km/h. Meanwhile, the speedometer shows instantaneous speed or the speed only
in that time so that it can move up when it goes faster and move down when it
goes slower. However, we can estimate the average speed by measuring the
The maximum speed of the motorcycles may more than 140 km/h, instantaneous
speed is usually fluctuating and it makes an average speed. Hence, the average
speed is always lower than (or equal to) the maximum speed. The average speed
can be the maximum speed if for a certain time interval, it moves all the time with
the same speed.
Group discussion problem:
1. Arman has jogging as his hobby. He said that last week he ran 60 meters in 15
seconds. Can you predict the Arman‟s distance in one hour ?
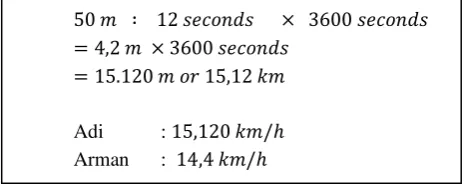
2. Adi likes jogging too. He said that yesterday he ran 50 meters in 12 second. Is
Arman‟s speed higher or lower that Adi‟s?
3. Find Adi‟s speed in m/h and km/h?
Conjectures of students‟ answer and discussion :
Problem 1
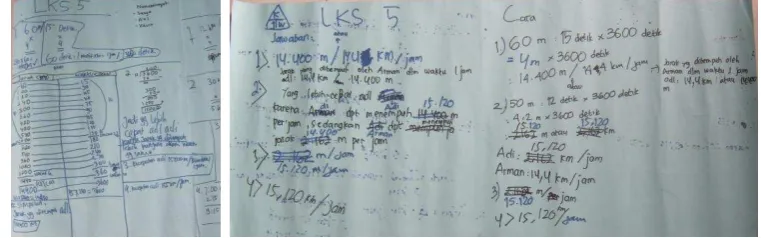
The answer will vary, sample answer are :
- Students use a vertical table in two columns to solve the problem
Distance Time
60 15
120 30
240 60 sec = 1
14400 = 14,4 60 min = 1 ℎ
28,8 2 ℎ
Hence Arman‟s distance in one hour is 14,4
Distance (km) Distance (m) Time (sec) Time (hour)
- 60 15 -
- 120 30 -
- 240 60 -
14,4 14400 3600 1
28,8 - - 2
Hence Arman‟s distance in one hour is 14,4
Problem 2
Students might come up with the methods as they proposed in the previous
problems. They already have the table of Arman‟s distance and time so that they
continue with the table for Adi
- Students use a vertical table in two columns
Distance Time
50 12
250 60 sec = 1
15000 = 15 60 min = 1 ℎ
Hence, Adi‟s distance in one hour is 15
- Students use a vertical table in four columns
Distance (km) Distance (m) Time (sec) Time (hour)
- 50 12 -
15 15000 3600 1
30 - - 2
Adi‟s speed is 15 /ℎ meanwhile Arman‟s speed 14.4 /ℎ hence Adi is
faster than Arman‟s
Problem 3
Based on students‟ calculation in problem 1, they conclude that Adi‟s speed is
15000 m/h or 15 km/h
Discussion :
Teacher may discuss briefly all the various ways from the students. Then the
focus of the discussion is about the effective ways in converting the speed. The
tables above can use as a handy way to solve the problems and explain more
about their reasoning. After the discussion of the problems, teacher can propose
another question such as “will Arman really be able to run that distance in one
hour?” in order to discuss further about human speed in running. Answer from the
children might be varying. The sample answers are :
- No, he can cot run exactly in that distance because he will be exhausted
- No, it is not likely that Arman will run distance in one hour because it is
hard for him to keep up the speed for a whole hour.
- Yes, because he has experiences in running a long distance
Through this questions teacher can review the discussion in the beginning of the
lesson and emphasizes that the calculation does not predict the arrival time in a
4.6 EX P LO R I N G R E LA TI O N A M O N G S P EED, D I S TA N C E A N D TI M E
Goal(s) :
Further exploration of the relation among speed, distance and time
Mathematical idea(s):
- Speed is directly proportional to distance
- Speed is inversely proportional to time
Problem(s):
1. A rabbit runs 12 km in 15 minutes. Determine the speed of the rabbit in km/h
and explain your answer!
2. Mother went to the market by motorcycle with average speed of 30 km/h
speed. If she arrived in the market in 10 minutes then how far does the market
from her house?
3. During the semester holidays, Chika and her family who lives in Surabaya go
to the Jatim Park in Malang that is 90 km far. If Chika‟s father drove the car
with average speed of 40 km/h, how can you predict the time needed for the
travel? If they go to travel at 7 o‟clock in the morning, what time they will be
arrived in Jatim park?
Description of the activity :
At this activity, students again work in group of 4 or 5 for around 30 minutes
then write their answer in a poster. After that, students will present their posters in
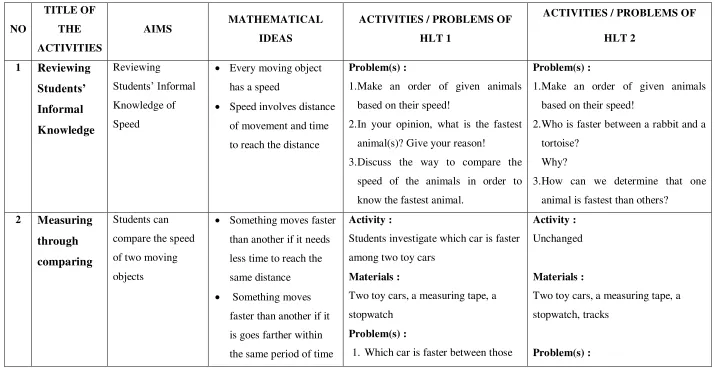
Conjectures of students‟ answers : Problem 1
Since in the previous lesson students know the table then students might use this
to solve the problem
- Students use a vertical table in two columns in one steps
Distance Time
12 15
48 60 min = 1 ℎ
Hence, the speed of the rabbit is 48 km/h
- Students use a vertical table in two columns in two steps
Distance Time
12 15
24 30 min =1
2ℎ
48 60 min = 1 ℎ
Hence, the speed of the rabbit is 48 km/h
- Students use a vertical table in three columns in one step
Distance (km) Time (min) Time (hour)
12 15 -
48 60 1
Hence, the speed of the rabbit is 48 km/h
Distance (km) Time (min) Time (hour)
12 15 -
24 30 -
48 60 1
Hence, the speed of the rabbit is 48 km/h
Problem 2
Students use the table to solve the problems given
- Students change the speed of 30 km/h into the table of so many distance in so
many time then use a table to solve the problem
Distance Time
30 1 ℎ= 60
5 10
Hence, the distance of the market from mother‟s house is 5
- Students use a vertical table in three columns in one step
Distance (km) Time (min) Time (hour)
30 60 1
5 10 −
Hence, the distance of the market from mother‟s house is 5
Problem 3
- Students change the speed of 40 km/h into the table of so many distance in so
many time then use a table to solve the problems
Distance Time
40 1 ℎ= 60
10 15
90 135
Hence, the time needed for the travel is 135 minutes or 2 hours and 15
minutes
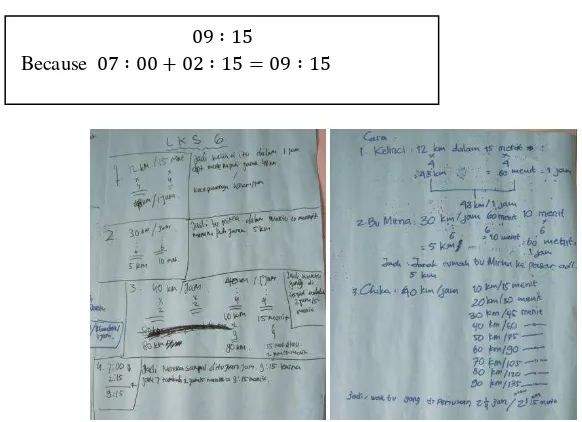
If they go to travel at 7 o‟clock in the morning then they will be arrive in
Jatim park at 09.15
- Students use a vertical table in three columns
Distance (km) Time (min) Time (hour)
40 60 1
10 15 −
90 135 2 ℎ 15
Hence, the time needed for the travel is 135 minutes or 2 hours and 15
minutes
If they go to travel at 7 o‟clock in the morning then they will be arrive in
Jatim park at 09.15
Discussion :
Teacher can discuss students‟ answer during the presentation of each group
and after. During the presentation of each group teacher can provoke students to
on. After the presentation from the whole group teacher can compare the answers