Volume 27, Number 1, 2012, 73 – 97
DOES LEGAL TRANSPLANTATION WORK?
THE CASE OF INDONESIAN CORPORATE GOVERNANCE
REFORMS
1Harijono
Universitas Kristen Satya Wacana Salatiga ([email protected])
George Tanewski
Faculty of Business and Economics Monash University
ABSTRACT
This study examines the impact of corporate governance reforms by analysing the relation between firms’ operating performance and key ownership structure and corporate governance variables on a sample of firms listed on the Jakarta Stock Exchange between the periods 1993 to 2007. Contrary to widespread belief that reforms in Indonesia have failed, this paper provides empirical evidence in support of the positive impact of corporate governance reforms. While the impact of family control, the firms’ business group affiliation, divergence between cash flow and control rights and political connection are all negatively associated with firms’ operating performance (ROA) for the pre-reform period (i.e., 1993-1999), these negative effects disappear during the post-reform period (i.e., 2001-2007), except for family control. More importantly, the relationship between family control and operating performance is negative only when the family’s control right exceeds their cash flow right. This study provides some empirical evidence and insights to both regulators and development assistance agencies on the effectiveness of Indonesian corporate governance reforms.
Keywords: corporate governance reform, controlling shareholders, firm performance, Indonesia
INTRODUCTION
Weaknesses1 in Asian corporate govern-ance systems have been widely attributed as a primary cause of the 1997 Asian crisis and its after-effects (Kim et al. 2010; Dickinson and Mullineux, 2001; Capulong et al. 2000;
1 This article has been awarded as the third winner of JIEB’s Best Paper Award 2011.
the OECD, which had developed model corporate governance codes for ready interna-tional transplantation, was of the firm opinion that implementation of these ‘ready-made’ reforms would bring about a quick improve-ment in national economic performance (Hill, 2005, p. 743). This thinking was premised on the assumption that ‘ready-made’ Principles of Corporate Governance, developed along the concepts of fairness, transparency, account-ability and responsibility, would also more readily assist member and non-member gov-ernments to both implement and evaluate their corporate governance frameworks.
Accordingly a range of initiatives to pro-mote both legal infrastructure and corporate governance reforms in Indonesia was launched at the close of the century. As part of the gov-ernance reforms mandated by the IMF, the National Committee for Corporate Govern-ance (NCCG) in Indonesia was established on 9 August 1999. In March 2000, the NCCG issued the Indonesian Code of Corporate Gov-ernance, which was primarily adopted from the OECD Principles of Corporate Govern-ance. Consequently, the BAPEPAM (the Capital Market Supervisory Agency) and the Jakarta Stock Exchange have also issued nu-merous rules, regulations and recommenda-tions as part of the overall corporate govern-ance reforms in Indonesia. These extensive reform measures included improving the qual-ity of information that management is required to provide to shareholders and the general public, enhancing minority shareholders’ par-ticipation in corporate decision making, mak-ing boards of directors more effective and more independent and reducing the likelihood of related-party transactions that would harm minority shareholders. Most of these govern-ance reforms have been adopted and trans-planted from western countries, primarily from the United States. However, much doubt, es-pecially among law scholars (e.g., Kamal, 2008; Hill, 2005; Daniel, 2003; Fitzpatrick, 2000), has been expressed about the
effective-ness of these corporate governance reforms in Indonesia. This skepticism is based on the following three reasons.
First, corporate governance reforms adopted by Indonesia have evolved originally from the United States where ownership of corporations is diffuse. In such an environ-ment dispersed shareholders have low incen-tives to monitor managers due to the free rider problem (i.e., dispersed shareholders are un-interested in monitoring because they bear all the monitoring costs and share only a small proportion of the benefits). As a result, the effective control of corporations ends up in the hands of management. When ownership is diffuse, agency problems will stem from con-flicts of interest between outside shareholders, who own the firm, and managers, who control the firm (Jensen and Meckling, 1976).
In contrast, most corporations in Indonesia are characterised by highly concentrated own-ership structures that are usually composed of family groups and these firms are greatly in-fluenced by the family’s involvement in man-agement. Family controlled corporations are not characterised by a separation of ownership and control nor are Indonesian corporations run by professional managers whose interests may diverge from dispersed shareholders. Consequently, controlling families in Indone-sian corporations have the ability to extract private benefits at the expense of minority shareholders. In other words, in family con-trolled and owned corporations the nature of the agency problem shifts away from classic manager-shareholder conflict (referred to here as Agency Problem I) to conflicts between the controlling owner (who is often also the man-ager) and minority shareholders (referred to here as Agency Problem II).Accordingly cor-porate governance mechanisms intended to combat Agency Problem I may not be suitable for alleviating Agency Problems II in Indone-sia (Fitzpatrick, 2000).
not achieve success since these governance mechanisms have been developed in a totally different culture (Daniel, 2003). Foreign adopted corporate governance systems work well in western countries because these regu-lations have been developed in cultures where there is usually stronger legal investor protec-tion which assists in lowering private benefits of control and the principles of corporate gov-ernance are part of the legal culture. In con-trast, Indonesia has weak legal investor pro-tection (La Porta et al. 2000; Claessens et al. 2000) and higher private benefits of control. Thus the implementation of corporate govern-ance mechanisms among listed firms in Indo-nesia faces many challenges which arise from the concentration of ownership, pyramid struc-tures among group companies, cross share-holdings, corruption, and cronyism. These characteristics are found in most listed compa-nies in Indonesia and often it has become something akin to a unique “culture” for the companies (Daniel, 2003).
Morck and Yeung (2004) maintain that the quality of legal protection determines the impact of a particular governance mechanism. They argue that family governance improves firm performance in the United States (e.g., Anderson and Reeb, 2004) precisely because families have large fortunes tied up in the firm, thus decreasing the likelihood of mis-management. More importantly, legal protec-tion in the U.S. is strong and it effectively pre-vents family firms from expropriating minor-ity shareholder wealth. In contrast, as a result of weaker investor protection in Indonesia (Claessens et al. 2000) many family firms in Indonesia are able to employ pyramid struc-tures which allow families to control numer-ous firms without investing too much of their own wealth in each firm – the ‘conglomera-tion’ phenomenon. These structures create incentives for family shareholders to spend minority shareholders’ money on things they desire and therefore reduce firm value.
Third, Indonesia has introduced many of its corporate governance reforms as a condi-tion of the financial assistance provided by the International Monetary Fund (IMF). As this is not a self-motivated initiative, many corpora-tions are reluctant to adopt and implement these reforms. Therefore, reforms have mostly only materialized on paper, in the form of very detailed and strict laws and regulations (Alijoyo et al. 2004).
In summary, much doubt has been ex-pressed as to whether legal transplantation of the Anglo-American corporate governance model will work in Indonesia. Many of the corporate governance changes introduced in Indonesia are seen as cosmetic, because em-bedded institutional and socio-cultural norms and values limit the effectiveness of the newly instituted mechanisms. While these sceptical conjectures on Indonesia’s corporate govern-ance reforms are theoretically justified, there is no study to date that has empirically tested these assertions. Accordingly our paper pro-vides a contribution to the corporate govern-ance literature and to the convergence debate by investigating whether corporate governance reforms adopted in Indonesia in 2000have had an effect on corporate performance. Specifi-cally, this study examines whether the Indone-sian corporate governance reforms have indeed led to a decline in expropriation of minority shareholders by controlling share-holders (i.e., Type II agency problems). If corporate governance reforms in Indonesia are effective in reducing Type II agency problems, we should observe concomitant improvements infirms’ operating performances. We answer this research question in two ways.
per-formance, Tobin’s Q, a measure of firms’ market value and shareholders’ wealth, and hold and buy monthly share returns as an alternative measure of firm performance. Explanatory variables include family control, divergence between control and cash flow rights, firm’s association with a business group, and the firm’s political connection. These factors are believed to be part of the controlling shareholder’s strategy to extract private benefits of control at the expense of minority shareholders and therefore, are cited as the major sources of corporate governance vulnerabilities that led to the Indonesian eco-nomic downturn in 1997(e.g., Nam and Nam, 2004; Fisman, 2001; Capulong et al. 2000; Claessens et al. 2000). More specifically, em-pirical studies (e.g., Baek et al. 2004; Mitton, 2002; Johnson et al. 2000) conducted on the 1997 Asian financial crisis show that the above-mentioned factors had a negative im-pact on firm value during the economic crisis. Second, we examine specifically the oper-ating performance effects of the Jakarta Stock Exchange (JSX) rules issued in 2000 related to the independence of the board of commission-ers2. The JSX rules require that the proportion of independent commissioners is in line with the proportion of shares held by non-control-ling or public shareholders, subject to the re-quirement that the number of independent commissioners must not be less than 30 per cent of all members of the Board of Commis-sioners. This research question evaluates whether Indonesian publicly-listed firms that complied with the JSX rules related to board
2 Indonesia follows a two-tier board of directors’ regime. The main feature of this model is the clear demarcation between the roles of the company’s management and the company’s supervisory board (Kamal, 2008). Under a two-tier board model (which emanates from Indonesia’s Dutch colonial heritage and civil law), companies are comprised of three legal entities, namely, general meet-ing of shareholders, management, and the supervisory board. This is in contrast to the unitary model, which comprises two legal entities, that is, the general meeting of shareholders and the board of directors (see Kamal, 2008).
of commissioners in 2000, experienced im-provements in firms’ operating performance.
Contrary to widespread belief that corpo-rate governance reforms in Indonesia have failed, this paper provides empirical evidence in support of the positive impact of corporate governance reforms in Indonesia. The impact of family control, firms’ business group af-filiation, divergence between cash flow and control rights and political connections on operating performance are all negatively asso-ciated with firms’ operating performance for the pre-reform period (i.e., 1993-1999). These negative results support the view that these four governance structures are a primary source of Agency Problem II (i.e., expropria-tion of minority shareholders by controlling shareholders).Interestingly, the negative ef-fects of these key governance variables disap-pear during the post-reform period (i.e., 2001-2007), except for family control. More impor-tantly, the relationship between family control and operating performance is negative only when the family’s control right exceeds their cash flow right.
We also provide evidence in support of the positive impact of board independence. Firms in Indonesia that comply with the JSX rules related to independent commissioner are better performers compared to those that do not comply. In spite of doubts being expressed about the legislative effectiveness of trans-planting the Anglo-American corporate gov-ernance model based on strong legal protec-tion into a socio-cultural environment of weak legal protection, our results provide evidence that these transplanted corporate governance mechanisms are effective in reducing Agency Problem II and in improving corporate per-formance.
operating performance only when the family’s control rights exceed their cash flow rights during the post-reform period, our study offers some additional insights on how corporate governance regulations should be enhanced in Indonesia to effectively protect minority shareholders against expropriation and thus to facilitate the healthy development of the Jakarta stock market.
The remainder of the paper is organized as follows. The next section presents key corpo-rate governance problems in Indonesia and its reform as well as providing a description of the board system in Indonesia and major cor-porate governance reforms related to board independence. Section 3 describes the research designs and Section 4 reports our results. Sec-tion 5 concludes and discusses the implica-tions of our findings.
LITERATURE REVIEW AND HYPOTHESIS DEVELOPMENT
1. Key corporate governance problems and regulatory reform in Indonesia
Unlike companies in the USA and UK whose shares are mostly diffusely held, Indo-nesian corporations like other Asian corpora-tions (e.g., Malaysia, South Korea, Philip-pines, Thailand) typically have large share-holders (usually family) who tightly control shares. Large block holders can use their influence in two ways. On the one hand, they can influence management to make decisions that increases overall shareholder value which benefits all shareholders (i.e., shared benefits of control), while on the other hand, large blockholders can influence management to provide them with private benefits of control (i.e., benefits that are available only to large controlling blockholders). While some of these private benefits can be innocuous and do not necessarily affect other shareholders, block-holders can also use their control to extract significant corporate resources. These private benefits can lead to reductions in the value of the firm at the expense of minority
sharehold-ers (Denis and McConell, 2003). In Indonesia there are at least four key governance struc-tures that are believed to facilitate minority shareholders expropriation.
First, large family-based corporations have historically held and still currently hold dominant positions in Indonesia. Family con-trol can potentially improve firm performance due to the family’s long-term perspectives and significant investment tied up in the firm (Anderson and Reeb, 2004). However, corpo-rate ownership structures characterized by significant family control and interlocking shareholdings among affiliated firms may leave insiders with excessive power to pursue their own interests at the expense of minority shareholders, creditors and other stakeholders. High concentrations of ownership reduce the effectiveness of some important mechanisms of shareholder protection, such as the system of boards of directors, shareholder participa-tion through voting during shareholder meet-ings, and transparency and disclosure. It may also have been one of the major sources of resistance to any reform initiatives in these areas (Capulong et al. 2000).
18,600 Indian firms during the period 1989– 1999, Bertrand et al. (2002) find that the ulti-mate owners of pyramid structures in India have strong incentives to divert resources from firms low down in the pyramid towards those higher up in the pyramid.
Third, as shown in Claessens et al. (2000), many controlling shareholders of listed firms in Indonesia have voting power over firms that exceed their cash flow rights. This discrepancy in cash flow rights and voting rights can create severe agency problems between controlling and minority shareholders, since it provides the former group with substantial power over important strategic decisions while enabling them to avoid the full cost of any negative outcomes. This entrenchment problem created by the controlling owner is similar to the managerial entrenchment problem discussed by Morck et al. (1988). Higher managerial ownership may entrench managers, as they are increasingly less subject to governance by boards of directors and to discipline by the market for corporate control. Separation be-tween ownership rights and control rights can exacerbate the entrenchment problems raised by concentrated ownership. To consolidate control, stock pyramids or cross shareholdings can be used, which lower the cash-flow in-vestment needed. A controlling owner in this situation can extract wealth from the firm, receive most of the benefit and only bear a fraction of the cost through a lower valuation of his/her cash-flow ownership.
Fourth, political connections play an im-portant role in driving resource misallocation. Fisman (2001) claims that in Indonesia, politi-cal connectedness rather than fundamentals such as productivity are the primary determi-nant of profitability, which leads to distorted investment decision making. He also argues that well-connected firms may not earn higher profits, even though they might be receiving significant political rents. This is because the resources they may be required to devote to rent-seeking activities are quite considerable.
In short, a fundamental corporate govern-ance problem in Indonesia is how to improve investor protection and protect minority share-holders from expropriation by controlling shareholders. Most of the reform measures appear to have focused on addressing this problem. The areas in which Indonesia intro-duced extensive reform measures include (Nam and Nam, 2004):
Improving the quality of information that management is required to provide to all shareholders and the general public;
Enhancing minority shareholders’ partici-pation in corporate decision making; Making boards of directors more effective
and more independent of management, and; Reducing the likelihood of related-party
transactions that would hurt minority shareholders
In line with the objectives of corporate governance reforms explained above, the Indonesian Capital Market Supervisory Agency (BAPEPAM) and the JSX have issued numerous rules and regulations. In 2000, BAPEPAM issued Circular Letter No. 03/ 2000, requiring publicly listed companies to set up audit committees and to have an in-dependent commissioner. This circular letter was supported by the JSX Decree No. 315/ 2000 concerning listing requirements, wherein it requires companies on the JSX to have an independent commissioner, an audit commit-tee, and a corporate secretary.
In March 2000, the National Committee for Corporate Governance (NCCG) which was established on 9 August 1999 issued the Indo-nesian Code of Corporate Governance. This code contains 13 areas adopted from the OECD Principles of Corporate Governance, and they include:
competitive position both domestically and internationally, and to create a sound envi-ronment to support investment;
encouraging the management of the com-pany to behave in a professional, transpar-ent, and efficient manner, as well as opti-mizing and enhancing the independence of the Board of Commissioners, the Board of Directors, and the General Meeting of Shareholders; and
encouraging shareholders and members of the Boards to make decisions and to act with a strict sense of morality, in compli-ance with the prevailing regulations having the force of law, and in accordance with their social responsibility towards the vari-ous stakeholders and the protection of the environment.
While the Indonesian government has in-troduced a range of corporate governance reforms since the onset of the Asian crisis in 1997, there have been serious problems with the implementation and enforcement of these reforms. What appears to be emerging in Indonesia is a corporate governance system that resembles the outsider model of corporate governance in form but not in substance (Roser, 2003).It’s also been claimed by nu-merous authors (e.g., Kamal, 2008; Hill, 2005; Daniel, 2003) that implementation of good corporate governance which was adopted from foreign cultures will not achieve success since these governance mechanisms have been built up in totally different cultural environments. Foreign corporate governance works well in western countries precisely because they have strong legal investor protection and the princi-ples of corporate governance are part of their legal culture. In contrast, Indonesia has weak legal investor protection (La Porta et al. 2000). The implementation of the corporate governance mechanisms among listed compa-nies in Indonesia faces many seemingly in-surmountable problems which primarily arise from concentrations of ownership, pyramid structures of group companies, cross
share-holdings, corruption, and cronyism. These characteristics are found in most listed compa-nies in Indonesia and they have become something akin to a unique “culture” for these companies (Daniel, 2003).
In short, the corporate governance reforms adopted by Indonesia may not be effective precisely because of issues related to legal transplantation. This suggests that the negative impact of family control, firm’s affiliation to business groups, the divergence between cash flow and control rights, and the culture of po-litical connections might still persist despite the introduction of corporate governance re-forms aimed at alleviating some of the Type II agency problems.
2. Indonesian board systems and its reform
In contrast to the unitary board of direc-tors’ model practiced by companies under the common law system, Indonesia practices a two-tier board of directors system whereby corporations comprise both a board of com-missioners and a board of directors. The board of commissioners performs the firms’ supervi-sory and advisupervi-sory roles, while the board of directors performs the firms’ executive roles. With respect to publically listed companies (PT Tbk), Indonesian company law requires such companies to have at least two directors and at least two commissioners.
In the wake of the Asian financial crisis, it became apparent that in many companies boards of commissioners did not function ac-cording to the relevant laws as well as the spirit of those laws. Boards of commissioners should represent shareholders and the primary boards’ objective is to make decisions that are in the best interests of the corporation and its shareholders. In reality, however, boards work primarily in the interests of dominant share-holders and frequently make decisions that are detrimental to the interests of minority share-holders and to the firm itself. Following the economic crisis, Indonesia had introduced an extensive set of reform measures to make boards more responsible and effective (Nam and Nam, 2004).
The appointment of independent commis-sioners is a key reform measure that is ex-pected to strengthen the independence of boards and make them more effective in pur-suing the interests of firms and all sharehold-ers, especially minority shareholdsharehold-ers, instead of merely the interests of dominant sharehold-ers. In 2000, the JSX issued Decree No. 315/2000 concerning listing requirements, wherein listed companies on the JSX were required to appoint independent commission-ers. The proportion of independent commis-sioners must be in line with the proportion of shares held by non-controlling, or public shareholders, subject to the requirement that the number of independent commissioners must not be less than 30 per cent of all mem-bers of the board of commissioners. The JSX rule defines independent commissioners as members of the board of commissioners who are not affiliated with the controlling share-holders and/or other commissioners and/or directors, and who are not serving concur-rently as a director in another affiliated com-pany, and are appointed in a general meeting of shareholders by the public shareholders.
The concept of independent commission-ers in Indonesia is closely related to the concept of outside directors in the US.
Exist-ing empirical studies of U.S. firms related to the effectiveness of outside directors show inconclusive results. On the one hand, Rosen-stein and Wyatt (1990) show that the appoint-ment of outside directors is positively related to stock price reactions. In contrast, other studies such as Hermalin and Weisbach (1991), Mehran (1995), Yermack (1996), Klein (1998), and Dalton, Daily, Ellstand, and Johnson (1998) find no association between the presence of outside directors and firm per-formance. Agrawal and Knoeber (1996) even report that firm performance is negatively related to the percentage of outsiders on the board, with the implication that boards are not optimally constructed to maximize firm value. Evidence regarding the effectiveness of boards of directors elsewhere in the world is also mixed (Denis and McConell, 2003).
SAMPLE, DATA, AND VARIABLES
The sampling frame comprised the popu-lation (N=265) of companies listed on the Jakarta Stock Exchange (JSX) in 2000. Of the total number of companies, 70 were financial firms. These firms were excluded from the sample due to their regulatory structure. Since we focus on corporate governance reforms and its implications, we exclude 5 firms that were only listed during the pre-reform period (1993–1999) and 10 firms that were only listed in 2000, bringing the final sample down to 180 firms or 2,636 firm-year observations3.
Corporate governance data such as board size and financial data are obtained from the Indonesian Capital Market Directory, while share price data are collected from Data stream. We use annual reports to identify inde-pendent commissioners and to obtain data missing from the Indonesian Capital Market Directory. To identify family control, business group affiliation, cash flow right and control rights, we rely on Claessens et al. (2000) pro-cedures and obtain data from Conglomeration Indonesia 1998 published by Pusat Data Bisnis Indonesia. Conglomeration Indonesia provides information on group affiliations as well as the identity of ultimate owners of publically listed firms in Indonesia. Information from Con-glomeration Indonesia also assisted us in our calculations of cash flow and control rights.
Data from 1993 to 2007 covers both the pre- and post-governance reform periods to assess the relationship between operating per-formance (i.e., ROA, Tobin’s Q, and hold and buy monthly share returns), key ownership structure variables (i.e. family control, diver-gence between control and cash flow rights, and firm’s association with business group) and corporate governance variables (i.e., inde-pendence of the board of commissioners and firm’s political connection). By collecting data
3 As we have an unbalanced panel data set, our number of firm-year observations differs from the number of firms we observe over the 15 year period, particularly in the panel study regression models.
from the post-reform period (i.e., 2001-2007), we are able to examine the impact of overall corporate governance reforms on key owner-ship structure and governance problems by comparing results from the pre-reform period (i.e., 1993-1999). As discussed above, the year 2000 was a seminal year in terms of corporate governance reforms in Indonesia, that is, ma-jor corporate governance reforms and the Ja-karta Stock Exchange (JSX) rules related to the independence of the board of commission-ers were mostly issued and enacted in 2000. We thus use this year as the structural break-point for our two sub-periods to assess corporate governance reforms in Indonesia.
Since research data contain annual infor-mation of several companies over multiple years from 1993 to 2007, we employ panel data regression techniques. While some key explanatory variables in this study can be con-strued as time-invariant, for example, families are classified long-term large shareholders as they maintain control of their firms over long periods, we nonetheless assume the 180 firms included in our sample have a common mean value and that individual differences in the intercept values of each firm are reflected in the error term it (Baum,2006). To measure the impact of firm specific characteristics such as the divergence between control and cash flow rights, family control, firm’s association with business group, leverage, firm size, and firm age, a random effect estimator was used in this study4.Accordingly the random effect regres-sion equation takes the following form: Operating Performanceit = 0 + 1 Key
4 Both the Breusch and Pagan Lagrangian multiplier test
Researchers usually use two types of per-formance measures to gauge firm perform-ance, namely, accounting performance meas-ures such as return on assets (ROA), return on sales (ROS), and return on equity (ROE) (e.g., Bhagat and Bolton, 2009; Fan, Wang, and Zhang, 2007; Grullon et al. 2005), and; stock performance measures such as stock returns (e.g., Fan, Wang, and Zhang, 2007).As no single measure is perfect and each type of per-formance measures’ measurement error might attenuate the results, we use both accounting performance measures and stock performance measures. Consistent with Bhagat and Bolton (2009) we use ROA, defined as operating in-come before depreciation (EBITDA) scaled by the book-value of total assets, as our primary measure of operating performance. In supple-mentary tests, we use both Tobin’s Q and the hold and buy monthly stock return as the al-ternative measures of stock performance (see Fan, Wang, and Zhang, 2007). In this study, we define Tobin’s Q as the market value of equity + book assets-book value of equity di-vided (scaled) by book assets.
This study considers four key ownership structure (explanatory) variables: family con-trol, divergence between cash flow and control rights, and firm’s association with a business group, and three key corporate governance (explanatory) variables: board independence, board size, and firm’s political connection. If the corporate governance reforms in Indonesia are ineffective, the impact of key explanatory variables (i.e. family control, the divergence between cash flow and control rights, business group affiliation, board independence, board size, and political connection) on operating performance should be negative for both the pre- (1993-1999) and post-governance reform periods (2001-2007). In addition, if compli-ance to the regulation is only in form but not in substance we would then expect to find no relationship, or even a negative relationship, between operating performance and board characteristics (i.e., board size and board
inde-pendence).
Firms are classified as family controlled if one family has more than 20% of the control rights. Thus family control is measured using a dummy variable with the value of 1 if the firm(s) is controlled by a family and 0 other-wise. The method to calculate cash flow and control rights are explained in Claessens et al. (2000). Their calculation of cash flow and control rights is augmented by an example, where a family owns 11% of the stock of pub-licly traded Firm A, which in turn has 21 per cent of the stock in Firm B. Claessens et al. (2000) assume there are no deviations from one-share one-vote or cross-holdings between firms A and B. In this case, the family owns about 2 per cent of the cash-flow rights of Firm B, or the product of the two ownership stakes along the chain. The disparity between cash flow and control rights is measured by using a dummy variable where the value of 1 is if the control right exceeds cash flow rights, and 0 otherwise.
The firm’s group affiliation is identified by using Conglomeration Indonesia 1998, which is published by Pusat Data Bisnis Indo-nesia. The publication provides the list of top 300 business groups in Indonesia. Members of the business groups are not only listed firms but also private firms in Indonesia. The busi-ness group variable takes the value of 1 if one particular firm belongs to one group and 0 otherwise.
calculated as the log of the total number of board members and board commissioners.
The definition and data on political con-nections are obtained from Fisman (2001). As a measure of political connections, Fisman used the Suharto Dependency Index (1995) developed by the Castle Group, a leading eco-nomic consulting firm in Jakarta.
Following previous research (e.g., Bhagat and Bolton, 2009; DeJong et al. 2005; Joh, 2003; Claessens et al. 2002), we employ the following control variables: firm age, firm size, leverage, sales growth, capital expendi-ture, risk, industry dummies and year dum-mies. Firm age is measured as the natural log of the number of years since the firm’s incep-tion while firm size is the natural log of the book value of total assets. Firm growth is measured as sales growth and capital expen-diture is scaled by total sales. We control for debt in the capital structure by dividing total debt by total assets.
RESULTS
Descriptive Results
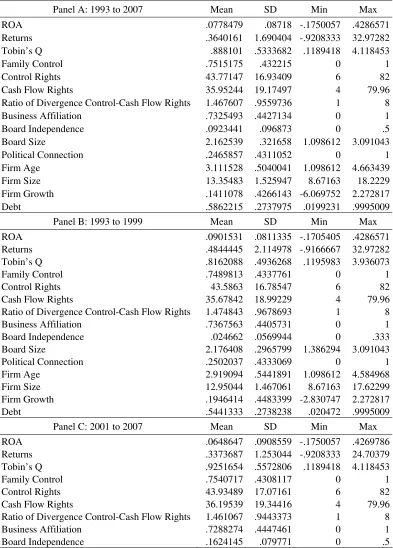
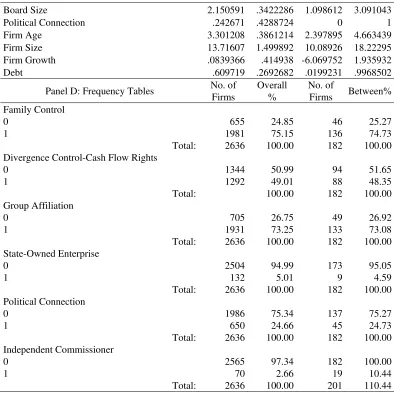
Table 1 presents summary statistics for the variables used in the regression models. The table is partitioned into three separate sections in which Panel A provides statistics for the overall 15 year period, Panel B for the pre-form period 1993-1999, Panel C for the post-reform period 2001-2007, and Panel D pro-vides a distribution breakdown of family con-trol, divergence between control and cash flow rights, group affiliation, state-owned enter-prises, political connection, and independent commissioners. Indeed Panel D shows that approximately 75 per cent of the firms in the sample are family controlled, 49 per cent of the firms’ have substantial shareholders’ whose control rights exceeds their cash flow
rights, over 73 percent of the firms are affili-ated to a group or conglomeration, around 5 per cent of firms are state-owned enterprises, approximately 25 per cent are politically af-filiated, and 10 per cent of firms are compliant with the board of commissioner regulations.
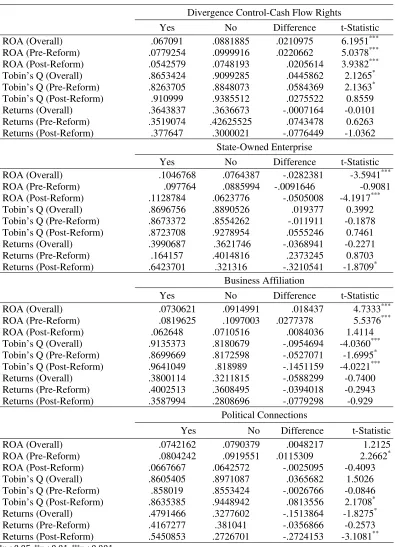
Table 2 reports univariate statistics on both the accounting and stock performance measures for the overall sample period as well as the pre- and the post-reform periods. In terms of operating performance, family con-trolled firms in Indonesia seem to significantly underperform their non-family controlled counterparts. This is further corroborated by analysis on the divergence between control and cash flow rights, which shows that family controlled firms significantly underperform their non-family controlled counterparts. In-terestingly, firms with political connections appear to only significantly underperform during the pre-reform period compared to firms that do not have political connections, whereas this statistical difference between these two groups disappears during the post-reform period suggesting that corporate gov-ernance reforms appear to have had an effect on Type II agency problems.
Table 1. Descriptive Statistics
Panel A: 1993 to 2007 Mean SD Min Max
ROA .0778479 .08718 -.1750057 .4286571
Returns .3640161 1.690404 -.9208333 32.97282
Tobin’s Q .888101 .5333682 .1189418 4.118453
Family Control .7515175 .432215 0 1
Control Rights 43.77147 16.93409 6 82
Cash Flow Rights 35.95244 19.17497 4 79.96
Ratio of Divergence Control-Cash Flow Rights 1.467607 .9559736 1 8
Business Affiliation .7325493 .4427134 0 1
Board Independence .0923441 .096873 0 .5
Board Size 2.162539 .321658 1.098612 3.091043
Political Connection .2465857 .4311052 0 1
Firm Age 3.111528 .5040041 1.098612 4.663439
Firm Size 13.35483 1.525947 8.67163 18.2229
Firm Growth .1411078 .4266143 -6.069752 2.272817
Debt .5862215 .2737975 .0199231 .9995009
Panel B: 1993 to 1999 Mean SD Min Max
ROA .0901531 .0811335 -.1705405 .4286571
Returns .4844445 2.114978 -.9166667 32.97282
Tobin’s Q .8162088 .4936268 .1195983 3.936073
Family Control .7489813 .4337761 0 1
Control Rights 43.5863 16.78547 6 82
Cash Flow Rights 35.67842 18.99229 4 79.96
Ratio of Divergence Control-Cash Flow Rights 1.474843 .9678693 1 8
Business Affiliation .7367563 .4405731 0 1
Board Independence .024662 .0569944 0 .333
Board Size 2.176408 .2965799 1.386294 3.091043
Political Connection .2502037 .4333069 0 1
Firm Age 2.919094 .5441891 1.098612 4.584968
Firm Size 12.95044 1.467061 8.67163 17.62299
Firm Growth .1946414 .4483399 -2.830747 2.272817
Debt .5441333 .2738238 .020472 .9995009
Panel C: 2001 to 2007 Mean SD Min Max
ROA .0648647 .0908559 -.1750057 .4269786
Returns .3373687 1.253044 -.9208333 24.70379
Tobin’s Q .9251654 .5572806 .1189418 4.118453
Family Control .7540717 .4308117 0 1
Control Rights 43.93489 17.07161 6 82
Cash Flow Rights 36.19539 19.34416 4 79.96
Ratio of Divergence Control-Cash Flow Rights 1.461067 .9443373 1 8
Business Affiliation .7288274 .4447461 0 1
Table 1. Descriptive Statistics (continued)
Board Size 2.150591 .3422286 1.098612 3.091043
Political Connection .242671 .4288724 0 1
Firm Age 3.301208 .3861214 2.397895 4.663439
Firm Size 13.71607 1.499892 10.08926 18.22295
Firm Growth .0839366 .414938 -6.069752 1.935932
Debt .609719 .2692682 .0199231 .9968502
Panel D: Frequency Tables No. of Firms
Overall %
No. of
Firms Between% Family Control
0 655 24.85 46 25.27
1 1981 75.15 136 74.73
Total: 2636 100.00 182 100.00
Divergence Control-Cash Flow Rights
0 1344 50.99 94 51.65
1 1292 49.01 88 48.35
Total: 100.00 182 100.00
Group Affiliation
0 705 26.75 49 26.92
1 1931 73.25 133 73.08
Total: 2636 100.00 182 100.00
State-Owned Enterprise
0 2504 94.99 173 95.05
1 132 5.01 9 4.59
Total: 2636 100.00 182 100.00
Political Connection
0 1986 75.34 137 75.27
1 650 24.66 45 24.73
Total: 2636 100.00 182 100.00
Independent Commissioner
0 2565 97.34 182 100.00
1 70 2.66 19 10.44
Total: 2636 100.00 201 110.44
Table 2. Univariate Statistics
Family Control
Family Non-Family Difference t-Statistic
Table 2. Univariate Statistics (continued)
Divergence Control-Cash Flow Rights
Yes No Difference t-Statistic
ROA (Overall) .067091 .0881885 .0210975 6.1951*** ROA (Pre-Reform) .0779254 .0999916 .0220662 5.0378*** ROA (Post-Reform) .0542579 .0748193 .0205614 3.9382*** Tobin’s Q (Overall) .8653424 .9099285 .0445862 2.1265* Tobin’s Q (Pre-Reform) .8263705 .8848073 .0584369 2.1363* Tobin’s Q (Post-Reform) .910999 .9385512 .0275522 0.8559 Returns (Overall) .3643837 .3636673 -.0007164 -0.0101 Returns (Pre-Reform) .3519074 .42625525 .0743478 0.6263 Returns (Post-Reform) .377647 .3000021 -.0776449 -1.0362
State-Owned Enterprise
Yes No Difference t-Statistic
ROA (Overall) .1046768 .0764387 -.0282381 -3.5941*** ROA (Pre-Reform) .097764 .0885994 -.0091646 -0.9081 ROA (Post-Reform) .1128784 .0623776 -.0505008 -4.1917*** Tobin’s Q (Overall) .8696756 .8890526 .019377 0.3992 Tobin’s Q (Pre-Reform) .8673372 .8554262 -.011911 -0.1878 Tobin’s Q (Post-Reform) .8723708 .9278954 .0555246 0.7461 Returns (Overall) .3990687 .3621746 -.0368941 -0.2271 Returns (Pre-Reform) .164157 .4014816 .2373245 0.8703 Returns (Post-Reform) .6423701 .321316 -.3210541 -1.8709*
Business Affiliation
Yes No Difference t-Statistic
ROA (Overall) .0730621 .0914991 .018437 4.7333*** ROA (Pre-Reform) .0819625 .1097003 .0277378 5.5376*** ROA (Post-Reform) .062648 .0710516 .0084036 1.4114 Tobin’s Q (Overall) .9135373 .8180679 -.0954694 -4.0360*** Tobin’s Q (Pre-Reform) .8699669 .8172598 -.0527071 -1.6995* Tobin’s Q (Post-Reform) .9641049 .818989 -.1451159 -4.0221*** Returns (Overall) .3800114 .3211815 -.0588299 -0.7400 Returns (Pre-Reform) .4002513 .3608495 -.0394018 -0.2943 Returns (Post-Reform) .3587994 .2808696 -.0779298 -0.929
Political Connections
Yes No Difference t-Statistic
ROA (Overall) .0742162 .0790379 .0048217 1.2125
ROA (Pre-Reform) .0804242 .0919551 .0115309 2.2662* ROA (Post-Reform) .0667667 .0642572 -.0025095 -0.4093 Tobin’s Q (Overall) .8605405 .8971087 .0365682 1.5026 Tobin’s Q (Pre-Reform) .858019 .8553424 -.0026766 -0.0846 Tobin’s Q (Post-Reform) .8635385 .9448942 .0813556 2.1708* Returns (Overall) .4791466 .3277602 -.1513864 -1.8275* Returns (Pre-Reform) .4167277 .381041 -.0356866 -0.2573 Returns (Post-Reform) .5450853 .2726701 -.2724153 -3.1081**
Ha
rijono & Ta
newsk
i
8
7
Panel A: Pearson’s Correlation
ROA1 DFB CON1 CAS1 DWED DBG2 BIND2 LBS DPOL LFA FS1 LSG LV1
ROA1 1.0000
DFB -0.1365 1.0000
CON1 0.0530 0.2800 1.0000
CAS1 0.1014 0.0554 0.8134 1.0000
DWED -0.1248 0.3878 -0.0791 -0.4838 1.0000
DBG2 -0.0968 0.3325 -0.1511 -0.2883 0.3206 1.0000
BIND2 -0.1028 0.0425 0.0382 0.0315 0.0032 0.0052 1.0000
LBS 0.1472 -0.0553 -0.2088 -0.2229 0.1064 0.0970 -0.0899 1.0000
DPOL -0.0265 0.2074 -0.0349 -0.2579 0.3901 0.3193 0.0122 0.3393 1.0000
LFA 0.1324 -0.1319 0.1155 0.0491 0.0309 -0.0807 0.2848 0.0534 -0.0113 1.0000
FS1 0.0008 0.0412 -0.1243 -0.1411 0.1041 0.1855 0.1633 0.5087 0.3367 0.1474 1.0000
LSG 0.2435 0.0240 0.0035 -0.0001 0.0110 0.0103 -0.0808 0.0476 0.0177 -0.0140 0.0611 1.0000
LV1 -0.4446 0.0901 -0.0013 -0.0510 0.1018 0.0655 0.0754 -0.0327 0.0346 0.0015 0.1584 -0.0495 1.0000
Panel B. Spearman Rank Correlation
ROA1 DFB CON1 CAS1 DWED DBG2 BIND2 LBS DPOL LFA FS1 LSG LV1
ROA1 1.0000
DFB -0.1028 1.0000
CON1 0.0335 0.2462 1.0000
CAS1 0.0923 0.0529 0.7835 1.0000
DWED -0.1066 0.3878 -0.0956 -0.4781 1.0000
DBG2 -0.0614 0.3325 -0.1487 -0.2415 0.3206 1.0000
BIND2 -0.1162 0.0448 0.0485 0.0317 -0.0047 0.0043 1.0000
LBS 0.1234 -0.0695 -0.1729 -0.1754 0.0972 0.0885 -0.0901 1.0000
DPOL -0.0291 0.2074 -0.0331 -0.2392 0.3901 0.3193 0.0015 0.3018 1.0000
LFA 0.0635 -0.1322 0.1087 0.0622 0.0030 -0.0859 0.3045 0.0646 -0.0384 1.0000
FS1 -0.0355 0.0570 -0.1209 -0.1106 0.1187 0.2050 0.1539 0.4731 0.3293 0.1439 1.0000
LSG 0.3296 0.0047 -0.0098 -0.0034 0.0043 0.0274 -0.1102 0.0585 0.0227 -0.0206 0.0593 1.0000
2. Panel Regression Models
We study the relationships between oper-ating performance and key ownership and corporate governance variables, especially the disparity between cash flow and control right, firm’s business group affiliation, political con-nection and family control, during the entire period from 1993-2007. We explicitly separate the sample period into pre-reform (1993-1999) and post-reform (2001-2007) sub-periods to focus on the effects of the regulation.
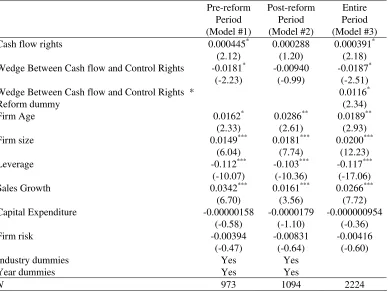
Table 4 shows results of three regression models, that is, the first model examines the pre-reform period, the second the post-reform period and the third assesses coefficients for entire sample period (1993–2007), which cov-ers both the pre and post-reform periods. The
purpose of the first two regression models are to compare whether the relationship between key ownership structure variables and operat-ing performance changed significantly from the pre- to the post-reform period. To formally test for changes over time between pre-reform and post reform periods, the third regression model includes an interaction variable be-tween the divergence bebe-tween cash flow and control rights and a dummy variable that dis-tinguishes between reform periods, that is, 1 equals post-reform period and 0 otherwise. Several different regression models are esti-mated and presented in Panels A, B, C, and D of Table 4 respectively, namely, the disparity between cash flow and control rights, business group affiliation, political connection and family control.
Table 4. (Panel A). Random Effects Regression Models
Pre-reform Post-reform Entire
Period (Model #1)
Period (Model #2)
Period (Model #3)
Cash flow rights 0.000445* 0.000288 0.000391*
(2.12) (1.20) (2.18)
-0.0181* -0.00940 -0.0187* Wedge Between Cash flow and Control Rights
(-2.23) (-0.99) (-2.51)
0.0116*
Wedge Between Cash flow and Control Rights *
Reform dummy (2.34)
Firm Age 0.0162* 0.0286** 0.0189**
(2.33) (2.61) (2.93)
Firm size 0.0149*** 0.0181*** 0.0200***
(6.04) (7.74) (12.23)
Leverage -0.112*** -0.103*** -0.117***
(-10.07) (-10.36) (-17.06)
Sales Growth 0.0342*** 0.0161*** 0.0266***
(6.70) (3.56) (7.72)
Capital Expenditure -0.00000158 -0.0000179 -0.000000954
(-0.58) (-1.10) (-0.36)
Firm risk -0.00394 -0.00831 -0.00416
(-0.47) (-0.64) (-0.60)
Industry dummies Yes Yes
Year dummies Yes Yes
N 973 1094 2224
t statistics in parentheses *
Table 4. (Panel B). Random Effects Regression Models
Pre-reform Period Post-reform Period Entire Period (Model #1) (Model #2) (Model #3)
Business group -0.0408*** -0.0141 -0.0414***
(-4.60) (-1.39) (-5.16)
0.0266***
Business group * Reformed Dummy
(4.75)
Firm Age 0.0119 0.0266* 0.0148*
(1.72) (2.41) (2.29)
Firm size 0.0161*** 0.0181*** 0.0203***
(6.40) (7.67) (12.40)
Leverage -0.113*** -0.103*** -0.118***
(-10.14) (-10.37) (-17.20)
Sales Growth 0.0342*** 0.0161*** 0.0267***
(6.73) (3.53) (7.80)
Capital Expenditure -0.00000176 -0.0000179 -0.00000104
(-0.65) (-1.10) (-0.40)
Firm risk -0.00305 -0.00887 -0.00333
(-0.37) (-0.68) (-0.49)
Industry dummies Yes Yes (2.20)
Year dummies Yes Yes
N 973 1094 2224
t statistics in parentheses. *p< 0.05, **p< 0.01, ***p< 0.001
Table 4. (Panel C). Random Effects Regression Models
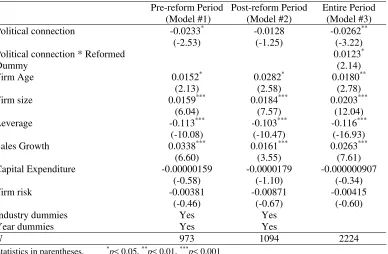
Pre-reform Period Post-reform Period Entire Period (Model #1) (Model #2) (Model #3) Political connection -0.0233* -0.0128 -0.0262**
(-2.53) (-1.25) (-3.22)
0.0123*
Political connection * Reformed
Dummy (2.14)
Firm Age 0.0152* 0.0282* 0.0180**
(2.13) (2.58) (2.78)
Firm size 0.0159*** 0.0184*** 0.0203***
(6.04) (7.57) (12.04)
Leverage -0.113*** -0.103*** -0.116***
(-10.08) (-10.47) (-16.93)
Sales Growth 0.0338*** 0.0161*** 0.0263***
(6.60) (3.55) (7.61)
Capital Expenditure -0.00000159 -0.0000179 -0.000000907
(-0.58) (-1.10) (-0.34)
Firm risk -0.00381 -0.00871 -0.00415
(-0.46) (-0.67) (-0.60)
Industry dummies Yes Yes
Year dummies Yes Yes
N 973 1094 2224
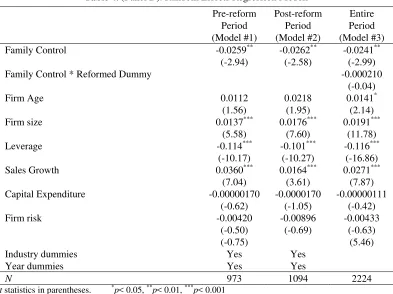
Table 4. (Panel D). Random Effects Regression Models
Pre-reform Post-reform Entire
Period (Model #1)
Period (Model #2)
Period (Model #3)
Family Control -0.0259** -0.0262** -0.0241**
(-2.94) (-2.58) (-2.99)
-0.000210
Family Control * Reformed Dummy
(-0.04)
Firm Age 0.0112 0.0218 0.0141*
(1.56) (1.95) (2.14)
Firm size 0.0137*** 0.0176*** 0.0191***
(5.58) (7.60) (11.78)
Leverage -0.114*** -0.101*** -0.116***
(-10.17) (-10.27) (-16.86)
Sales Growth 0.0360*** 0.0164*** 0.0271***
(7.04) (3.61) (7.87) Capital Expenditure -0.00000170 -0.0000170 -0.00000111
(-0.62) (-1.05) (-0.42)
Firm risk -0.00420 -0.00896 -0.00433
(-0.50) (-0.69) (-0.63)
(-0.75) (5.46)
Industry dummies Yes Yes
Year dummies Yes Yes
N 973 1094 2224
t statistics in parentheses. *p< 0.05, **p< 0.01, ***p< 0.001
Consistent with prior research (Claessens et al. 2002; Joh, 2003), firm age, firm size and sales growth have positive effects on operating performance, while leverage is negatively as-sociated with firm performance. The remain-ing two control variables (i.e., firm risk and capital expenditure) are not significantly asso-ciated with operating performance. Results for the control variables are consistent between the pre- and post-reform periods.
The coefficient on the variable measuring divergence between cash flow and control rights in Panel A is of key interest. As ex-pected, the coefficient estimate is negative at the 5 per cent level of significance during the pre-reform period. The result is consistent with the argument that when voting rights ex-ceed cash flow rights, agency problems be-tween controlling and minority shareholders become severe since controlling owner(s) are
able to expropriate wealth from the firm. In other words, controlling owners receive the entire benefit of the expropriation but only bear a fraction of the cost through a lower valuation of their cash-flow ownership (Claessens et al. 2002).
Although the relationship between oper-ating performance and divergence between cash flow-control rights during the post-re-form period remains negative, it is not statisti-cally significant. The interaction variable be-tween the reform period dummy and diver-gence between cash flow-control rights in model # 3 is positive and statistically signifi-cant at the 5 per cent level, suggesting that the negative effect of the discrepancy between cash flow and control rights has significantly decreased during the post-reform period.
political connection (Panel C) on operating performance for the pre-reform period are similar to those for divergence between cash flow-control rights. The negative coefficient (significant at the 1 per cent level)for the firm’s business group affiliation on operating performance during the pre-reform period suggests that business group affiliation is used by controlling shareholders to transfer re-sources between firms at the cost of minority shareholders. Similarly, the significant nega-tive association (at the 5 per cent level) be-tween political connection and operating per-formance is consistent with Fisman’s (2001) argument that political rents come at a cost. Indeed, Fisman (2001) argues the resources that politically connected firms usually devote on rent-seeking activities are higher than the actual political rent the firm earns from these behaviours. Again, these behaviours come at the expense to minority shareholders.
Interestingly, the negative impact of both the firm’s business group affiliation and politi-cal connection during pre-reform period dis-appear in the post-reform period. The interac-tion variables between both variables and the reform dummy variable are positive and sta-tistically significant at the 1 per cent and 5 per cent level, respectively. Overall, the results indicate the positive effects of governance reforms in Indonesia. That is, corporate gov-ernance reforms in Indonesia have been able to decrease actions by controlling shareholders to utilize their ownership structures (i.e., di-vergence between cash flow and control right), organizational structures (i.e., business group), and their cronyism (i.e., political connection) to extract private benefits of control at the ex-pense of minority and other shareholders.
Panel D of Table 4 reports the results of the impact of family control on operating per-formance. Although corporate governance reform has decreased the negative effects of business group affiliation, political connection and the discrepancy between cash flow and control rights, it seems that the impact of
fam-ily control has been unaffected by the reforms. The variable family control in Panel D shows negative and statistically significant coeffi-cients at the 1 per cent level on operating per-formance for both the pre- and post reform periods, suggesting that despite the Indonesian corporate governance reforms substantial family shareholders are still able to expropri-ate wealth from minority shareholders.
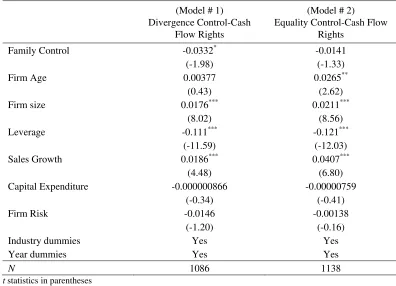
Additional analyses depicted in Table 5 show that the negative association between family control and operating performance only occurs when the voting right of family share-holders exceed their cash flow rights. Model #1 shows results for firms where the family’s voting rights exceeds their cash flow right, while Model #2 presents results where the family’s voting right equals their cash flow rights. In Model # 1 the family control coeffi-cient is negative and statistically significant at the 5 per cent level on operating performance when the family’s voting rights exceeds their cash flow rights. In contrast, when the fam-ily’s voting right equals their cash flow rights, the impact of family control on operating per-formance becomes non-significant (see Model # 2). This suggests that corporate governance reforms are not effective in family controlled firms when the family’s voting rights exceeds their cash flow rights.
Table 5. Additional Analyses Random Effects Regression Models of Family Control and Operating Performance
(Model # 1) Divergence Control-Cash
Flow Rights
(Model # 2) Equality Control-Cash Flow
Rights
Family Control -0.0332* -0.0141
(-1.98) (-1.33)
Firm Age 0.00377 0.0265**
(0.43) (2.62)
Firm size 0.0176*** 0.0211***
(8.02) (8.56)
Leverage -0.111*** -0.121***
(-11.59) (-12.03)
Sales Growth 0.0186*** 0.0407***
(4.48) (6.80)
Capital Expenditure -0.000000866 -0.00000759
(-0.34) (-0.41)
Firm Risk -0.0146 -0.00138
(-1.20) (-0.16)
Industry dummies Yes Yes
Year dummies Yes Yes
N 1086 1138
t statistics in parentheses *
p< 0.05, **p< 0.01, ***p< 0.001
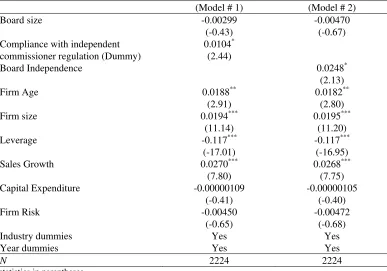
We measure the effectiveness of the inde-pendence commissioner regulation by investi-gating the performance effects if the firm complies with the regulation. That is, firms are classified as compliant if the proportion of their independent commissioners is no less than 30% of all members of the board of commissioners. In other words, a dummy vari-able is used in the regression which cate-gorises compliant firms as 1 and 0 otherwise. Following previous studies on outside direc-tors, we also include in the regression model a board independence ratio (i.e., the proportion of independent commissioners to total number of board of commissioners) variable to meas-ure the impact of independent commissioners.
Table 6. The impact of compliance with independent commissioner regulation on operating performance
(Model # 1) (Model # 2)
Board size -0.00299 -0.00470
(-0.43) (-0.67)
0.0104* Compliance with independent
commissioner regulation (Dummy) (2.44)
Board Independence 0.0248*
(2.13)
Firm Age 0.0188** 0.0182**
(2.91) (2.80)
Firm size 0.0194*** 0.0195***
(11.14) (11.20)
Leverage -0.117*** -0.117***
(-17.01) (-16.95)
Sales Growth 0.0270*** 0.0268***
(7.80) (7.75)
Capital Expenditure -0.00000109 -0.00000105
(-0.41) (-0.40)
Firm Risk -0.00450 -0.00472
(-0.65) (-0.68)
Industry dummies Yes Yes
Year dummies Yes Yes
N 2224 2224
t statistics in parentheses *
p< 0.05, **p< 0.01, ***p< 0.001
3. Robustness Checks
We conducted several sensitivity analyses using different key variables of interest and to ensure that influential observations did not distort our results. In general, our robustness analyses suggest that the results reported above are insensitive to various alternative specifications.
We first explored alternative measures of key governance variables. For example, we use Claessens et al. (2002) definition of busi-ness group rather than the definition used by Conglomeration Indonesia 1998 for group affiliation. Then, we examine the disparity between cash flow and control rights measure by employing the ratio of cash flow to control rights rather than the dummy variable reported in our above regression results. In addition, we
employ the percentage of share ownership by family as a proxy for family control. The re-sults are generally consistent with our earlier analyses.
Second, we test the sensitivity of our re-sults in the presence of outliers and influential observations by truncating the largest one and five percent levels for each tail of the distribu-tion for the model variables. The results are generally consistent with our earlier analyses.
mar-ket inefficiency and therefore, stock prices are not likely to reflect all available information. In such cases, he argues that accounting prof-itability is likely to be a better performance measure than stock market-based measures. It should be noted that studies based on devel-oped economies (e.g., Bhagat and Bolton, 2008; 2009) similarly find inconsistent results when investigating the impact of governance mechanisms on market performance.
Fourth, previous research (e.g., Anderson and Reeb, 2002) suggest that the relation be-tween family ownership and firm performance is non-linear. In order to check this non-line-arity we modify our regression that measures the impact of family control on operating per-formance by including family ownership and the square of family ownership, as continuous variables. The impact of family control is still negative and statistically significant while the coefficient on the square of family ownership is not statistically significant. Contrary to the result found in Anderson and Reeb (2002) which is based on US data, our results indicate that the relationship between firm operating performance and family ownership is negative and linear.
CONCLUSION
Contrary to the widespread belief that corporate governance reforms in Indonesia have failed, this paper provides evidence in support of the positive impact of corporate governance reforms in Indonesia. The impact of family control, firms’ business group af-filiation, divergence between cash flow-con-trol rights and political connection on operat-ing performance are all negative for the pre-reform period (i.e., 1993-1999). The results are consistent with the view that these four governance structures are sources of Agency Problem II (i.e., expropriation of minority shareholders by controlling shareholders). Interestingly, the negative effects of these key ownership and governance problems disappear during the post-reform period (i.e., 2001 to 2007), except for family control. However, the
relationship between family control and oper-ating performance is negative during the post-reform period only when family’s control rights exceed their cash flow rights.
We also provide evidence in support of the positive impact of board independence on the firm’s operating performance. Results sug-gest that greater board independence is associ-ated with higher operating performance. In addition, companies that comply with the JSX rules related to independent commissioners are better performers compared to those that do not comply with the regulation. Similar to Australia, Indonesian firms operate in a vol-untary corporate governance environment which suggests more successful companies in the Indonesian marketplace exposed to the global market through trade in exports and imports are more likely to adopt corporate governance reforms precisely because of ei-ther pressures from foreign investors or fierce competition that dictate greater transparency.
REFERENCES
Agrawal, A. and C. Knoeber, 1996. “Firm Performance and Mechanisms to Control Agency Problems Between Manager and Shareholders”. Journal of Financial and Quantitative Analysis, 31, 377-397. Alijoyo, A., E. Bouma, M.N. Sutawinangun,
and M.D. Kusadrianto, 2004. “Corporate governance in Indonesia”. Asian
Devel-opment Bank Working Paper Series,
Manila: ADB.
Anderson, R.C. and D.M. Reeb, 2004. “Board Composition: Balancing Family Influence in SandP 500 Firms”. Administrative Sci-ence Quarterly, 49 (2), 209-237.
Baek, J.S., J.K.Kang, and K.S. Park, 2004. “Corporate Governance and Firm Value: Evidence from the Korean Financial Crisis”. Journal of Financial Economics, 71, 2695-2740.
Baum, C.E., 2006. An Introduction to Modern
Econometrics Using STATA. College
Station, Texas: STATA Press.
Bertrand, M., P. Mehta, and S. Mullainathan, 2002. “Ferreting Out Tunnelling: an Application to Indian Business Groups”. Quarterly Journal of Economics, 117 (1), 121-148.
Bhagat, S. and B. Bolton, 2009. “Sarbanes-Oxley, Governance and Performance”. Working Paper: SSRN.
Bhagat, S. and B. Bolton, 2008. ”Corporate Governance and Firm Performance”. Journal of Corporate Finance, 14, 257-273.
Capulong, M., D. Edward, D. Webb, and J. Zhuang, eds., 2000.Corporate governance and finance in East Asia: A study of Indonesia, Republic of Korea, Malaysia, Philippines and Thailand. Manila: Asian Development Bank.
Claessens, S., S. Djankov, J.P.H. Fan and L.H.P. Lang, 2002. “Disentangling the In-centive and Entrenchment Effects of
Large Shareholdings”, Journal of Fi-nance, 57 (6), 2741-2771.
Dalton, D., C. Daily, A.Ellstand, and J. Johnson, 1998. “Meta-Analytic Reviews of Board Composition, Leadership Struc-ture and Financial Performance”. Strategic Management Journal, 19, 269-290. Daniel, W.E., 2003. “Corporate Governance in
Indonesian Listed Companies – a Legal Transplantation Problem”. Bond Law Re-view, 15, 344-375.
Denis, F. and J. McConnell, 2003. “Interna-tional Corporate Governance”. Journal of Financial and Quantitative Analysis, 38, 1-36.
Dickinson, D.G. and A. W. Mullineux, 2001. “Lessons from the East Asian Financial Crisis: a Financial Sector Perspective”. Georforum, 32(1), 133-142.
Fan, J.P.H., T.J. Wang, and T. Zhang, 2007. “Politically Connected CEOs, Corporate Governance, and Post-IPO Performance of China’s Newly Partially Privatized Firms”. Journal of Financial Economics, 84, 330-357.
Fisman, D., 2000. “Estimating the Value of Political Connection”. American Econom-ics Review, 91,1095-1102.
Fitzpatrick, D., 2000. “Indonesian Corporate Governance: Would Outside Directors or Commissioners Help?” in Manning, C. and Van Diermen, P., 2000. Indonesia in Transition. Singapore: Institute of South East Asian Studies.
Grullon, G., R. Michaely, S. Benartzi, and R.H. Thaler, 2005. “Dividend Changes do Not Signal Changes in Future Profi-tability”. Journal of Business, 78, 1659-1682.
Hermalin, B., and M. Weisbach, 1991. “The Effect of Board Composition and Direct Incentives on Firm Performance”. Finan-cial Management, 20 (4), 101-112.
Governance”. Sydney Law Review, 27, 743-761.
Jensen, G.R. and W. Meckling, 1976. “Theory of the Firm: Managerial Behaviour, Agency Costs, and Ownership Structure”,
Journal of Financial Economics, 3(4),
305-360.
Joh, S.W., 2003. “Corporate Governance and Firm Profitability: Evidence from Korea Before the Economic Crisis”. Journal of Financial Economics, 68,287-322.
Johnson, S., P. Boone, A. Breach, and E. Friedman, 2000. “Corporate Governance in the Asian Financial Crisis”. Journal of Financial Economics, 58, 141-186. Kamal, M. and M.M. Rahim, 2008. “Changes
in the Corporate Governance Patterns in Developing Countries: Guesses on Ideo-logical Imbalance”. Macquarie School of
Law Working Paper: Macquarie
Univer-sity.
Khanna, T. and K. Palepu, 1997. “Why Focus Strategy May be Wrong at Emerging Mar-kets’. Harvard Business Review, 75, 41-45.
Kim, J., J. Eppler-Kim, W.S.Kim, and S.J. Byun, 2010. “Foreign Investors and Corporate Governance in Korea”. Pacific-Basin Finance Journal, 18, 390-402. Klein, A., 1998. “Firm Performance and Board
Committee Structure”. Journal of Law and Economics, 41, 275-303.
Kurniawan, D.M. and N. Indriantoro, 2001. “Corporate Governance in Indonesia”. Asian Development Bank Working Paper Series, Manila: ADB.
La Porta, R., F. Lopez-de-Silanes, and A. Shleifer, 1999. “Corporate Ownership
Around the World”, Journal of Finance, 54 (2), 471-517.
La Porta, R., F. Lopez-de-Silanes, A. Shleifer, and R.W. Vishny, 2000. “Agency Prob-lems and Dividend Policies Around the World”. Journal of Finance, 55(1), 1-33. Mehran, H., 1995. “Executive Compensation
Structure, Ownership, and Firm Perform-ance”. Journal of Financial Economics, 38, 163-184.
Mitton, T., 2002. “A Cross-Firm Analysis of the Impact of Corporate Governance on East Asian Financial Crisis”. Journal of Financial Economics, 64, 215-241. Morck, R., A. Shleifer, and R. Vishny, 1988.
“Management Ownership and Market Valuation: An Empirical Analysis”. Journal of Financial Economics, 20, 293-315.
Morck, R. and B. Yeung, 2004. “Family Con-trol and the Rent-Seeking Society”. Entre-preneurship Theory and Practice, 28 (4), 293-315.
Nam, S.W. and I.C. Nam, 2004. “Corporate Governance in Asia”. Asian Development
Bank Working Paper Series, Manila:
ADB.
Roser, A., 2003. “Coalitions, Convergence, and Corporate Governance Reform in Indonesia”. Third World Quarterly, 24, 319-337.
Rosenstein, S. and J. Wyatt, 1990. “Outside Directors, Board Independence and Share-holders Wealth”. Journal of Financial Economics, 26 (2), 175-191.
APPENDIX A Variable Description
Dependent Variables
ROA Operating income before depreciation (EBITDA) scaled by the book-value of total assets
Returns Hold and buy monthly stock returns
Tobin’s Q The market value of equity plus book assets-book value of equity divided by book assets
Explanatory Variables - Ownership Structure
Family Control A binary variable that equals one if the founding family or family member or private individual controlled 20 percent or more of the control rights, zero otherwise
Control Rights The control rights of ownership refer to an owner’s ability to influence the way a firm is run. The threshold of control is defined as 20% of voting rights by the firm’s substantial shareholder.
Cash-Flow Rights The cash-flow rights of ownership refer to the fraction of
the firm’s profits to which an owner is entitled. It is the product of the ownership stakes along the chain.
Divergence between Cash Flow and Control Rights
Abinary variable where the value of 1 is if the control right exceeds cash flow rights, and 0 otherwise.
Business affiliation The business group variable takes the value of 1 if one particular firm belongs to one group and 0 otherwise
Explanatory Variables - Corporate Governance
Board Independence The proportion of independent directors on the board of commissioners Board Size Natural logarithm of the number of board members and board
commissioners Political Connection
(Index)
Based on the Suharto Dependency Index (1995) (see Fisman, 2001, p. 1097). The index consists of a numerical rating of the degree to which each of the 25 largest industrial groups in Indonesia is dependent on political connections for its profitability. The ratings range from one (least dependent) to five (most dependent).Most of these groups have multiple companies listed on the JSX, yielding a total sample of 79 firms
Control Variables
Firm Age The natural logarithm of the number of years since the firm’s incorporation
Firm Size The natural logarithm of the book value of total assets Firm Growth Sales growth and capital expenditure scaled by total Debt Total debt divided by total assets