TAX AVOIDANCE, RELATED PARTY TRANSACTIONS, CORPORATE
GOVERNANCE AND THE CORPORATE CASH DIVIDEND POLICY
Dewi Kartika Sari
Vocational Education Program, Universitas Indonesia, Indonesia ([email protected])
Sidharta Utama
Faculty of Economics and Business, Universitas Indonesia, Indonesia ([email protected])
Hilda Rossieta
Faculty of Economics and Business, Universitas Indonesia, Indonesia ([email protected])
ABSTRACT
This study aims to investigate the relationship between tax avoidance, related party transactions and the corporate dividend policy. Furthermore, this study will also investigate the moderating effects of the implementation of Corporate Governance (CG) on the relationship between tax avoidance, Related Party Transactions (RPT) and corporate dividend policies. Our sample covers companies listed on the Indonesian Stock Exchange during 2011-2014. The results provide moderate support for the proposed hypotheses. First, the greater tax avoidance that a company makes will increase the size of the firm's RPT. Second, the higher that the company's RPT is, this will lower the company's cash dividend payout rate. Third, the greater the tax avoidance is, the lower the company's cash dividend payout rate will be, which is done through a related party transaction. Fourth, the impact of the implementation of strong CG will weaken the positive relationship between corporate tax avoidance and the company’s RPT size, strengthen the negative relationship between the RPT’s size and the cash dividend payout policy of the firm, and strengthen the negative relationship between the company’s tax avoidance and the company's cash dividend payout policy which is mediated by the company’s RPT. This study makes three contributions. First, this study shows an indirect relationship between tax avoidance and cash dividend payments, mediated by RPT. Second, this study tries to examine the effect of CG’s moderation on the relationship between tax avoidance and RPT, as well as the effect of CG’s moderation on the relationship between tax avoidance and cash dividend payments, mediated by RPT. Third, this study developed RPT measurements by looking at the RPT’s components more specifically (looking at components of transactions outside of the main business of the company - the "others" component).
Keywords: tax avoidance, related party transaction, corporate governance, cash dividend policy
INTRODUCTION
On December 30, 2016, the Government of the Republic of Indonesia issued Regulation (of the Finance Minister) PMK No. 213 PMK.03/2016 regulating the types of documents and/or additional information that must be kept by taxpayers conducting transactions with related parties or through management procedures. This regulation aims to reduce tax avoidance by
multinational companies through transfer pricing schemes.
This may be detrimental to the interests of the non-controlling shareholders, because reducing the firm’s profits will lower the rate of return on investment the non-controlling shareholders receive in the form of dividends.
This is according to a statement issued by Prastowo (2017), a taxation observer of the Center for Taxation Analysis (CITA), which states that a transaction mechanism of transfer pricing is generally performed by an affiliated company that aims to reduce its earnings, so its payment of tax and the distribution of dividends will be low. But unquestionably, this statement must still be proven empirically.
La Porta et al. (2000) states that corporate governance is a mechanism that can reduce the information asymmetry between the internal and external parties, so as to reduce the possibility of the expropriation of the non-controlling share-holders. The monitoring role of good corporate governance can be a mechanism that ensures the company’s related party transactions are carried out with the aim of maximizing efficiency, so it can maximize shareholder value.
Based on the above background, this study aims to empirically test the relationship between tax avoidance, related party transactions and corporate dividend policy. Furthermore, this study will also investigate the moderating effect of Corporate Governance (CG) on the relation-ship between tax avoidance, Related Party Transactions (RPT) and the firms’ dividend policies.
As far as the author knows, no research has examined the relationship of the above three variables simultaneously. Previous research has examined the relationship between tax avoidance, related party transactions and the firms’ dividend policies, but this was only partially explored (Koestaman and Diyanty (2013); Yuniasih et al. (2013); Hartati et al.
(2014); Su et al. (2014); and Chan et al. (2016)). Previous research has not yet tested the moderation of CG on the relationship between RPT and cash dividend payments, and the effect of CG’s moderation on the simultaneous relationship between tax avoidance, RPT and cash dividends. Most previous studies focused
on investigating the effects of CG’s moderation on RPT relationships with market reactions (Cheung et al. (2006); Utama et al. (2010); Ryngaert and Thomas (2012)) or company values (Kohlbeck and Mayhew (2010); Utama & Utama (2014); Elkelish (2017)). Koestaman and Diyanti (2013) have tested the effect of CG’s moderation, but on the relationship between family ownership and cash dividend payouts.
Previous research tended to measure RPT in simple terms, where RPT is measured using dummy variables (Ge et al. (2010); Utama (2010); Yuniasih et al. (2013); Hartati et al.
(2014)). However, there have been several studies that tested RPT by using its monetary amounts, i.e. Utama (2015), who decomposed RPT’s components into RPT associated with the components of Assets and Liabilities (RPTAL) and with components of Sales and Expenses (RPTSE), and Chan et al. (2016) who has tested tunneling in China and found that tunneling is mostly done through the RPT components of other receivables.
This study makes three contributions. First, this study shows an indirect relationship between tax avoidance and cash dividend payments mediated by RPT. Second, the study also attempts to examine the effect of CG’s moderation on the relationship between tax avoidance and RPT, as well as the effect of CG’s moderation on the relationship between tax avoidance and cash dividend payments, which is mediated by RPT. Third, this study develops the RPT’s measurements (Utama, 2015) by looking at the RPT’s components more specifically (looking at components of transactions outside of the main business of the company - the "other" component (Chan et al., 2016))
LITERATURE REVIEW
1. Tax Avoidance and Related Parties Transactions
A tax avoidance transaction is an action taken by a company to minimize its corporate tax liability. According to the traditional view, tax avoidance is seen as an action that can increase the value of a company. This is because the taxes saved can be reinvested and/or returned to the shareholders. However, from an agent's perspective, tax avoidance can lead to the transfer of wealth or resources from shareholders to managers, or from non-controlling share-holders to controlling shareshare-holders (Desai et al., 2007; Chan et al., 2016). Such tax avoidance actions may provide cash resources that can be transferred from the company to its manager, or from the non-controlling shareholders to the controlling shareholders.
The transfer of resources that can be detrimental to non-controlling shareholders is called a tunneling action. Examples of tunneling actions, to name a few include: The expro-priation of company assets, transfer pricing to related parties, the sale of assets to the controlling shareholder at a price which is not in accordance with the market, and guaranteeing debt by using the assets of the company (Johnson et al., 2000).
However, the actions of related party transactions are not always bad. There are two hypotheses underlying the actions of related party transactions, the shareholder expropriation hypothesis and efficient contracting hypothesis (Ryngaerty & Thomas, 2012). If the effects of the related party transactions of the company are considered detrimental to its shareholders, then it is said to support the hypothesis about shareholder expropriation. Meanwhile, if the company uses the information it has to perform related parties transactions that increase the shareholders’ value, then it is said to support the efficient contracting hypothesis.
There have been some studies that examine the relationship between tax and RPT, either directly or indirectly; for example, the research conducted by Chen et al. (2010) and Chan et al.
(2016). Chen et al.’s. (2010) study aimed to test whether family enterprises in China are more aggressive in tax avoidance. They found that family firms turned out to be less aggressive in tax avoidance. Chen et al. (2010) suggests that this may be because family firms in China are willing to lose tax profits to avoid non-tax costs, such as the decline in the company's stock price, which can happen because the non-controlling shareholders think the tax avoidance undertaken by the company constitutes a rent-seeking act.
Research conducted by Chan et al. (2016) has directly and empirically examined the relationship between tax avoidance and tunneling, using Chinese companies as a sample. They found that acts of tax avoidance are positively associated with tunneling. These findings remained consistent despite having controlled for the characteristics of the company, corporate governance, and institutional factors that may also affect tunneling. Chan et al. (2016) used the effective tax rates as a proxy of tax avoidance actions, and loans to related parties as a proxy of tunneling. Loans to related parties was selected as the proxy of tunneling associated with acts of tax avoidance, with the assumption that loans granted to related parties would be detrimental to the non-controlling shareholders, because the cash proceeds of the tax savings are not reinvested. Based on these arguments, this study proposes an alternative hypothesis as follows:
H1: Tax avoidance is positively related to the
related party transactions
2. Related Party Transactions and Dividend Policy
The proposition of Miller and Modigliani (1961) states that, in a world without friction, a dividend policy will not affect the shareholders’ wealth. However, a dividend policy can lead to agency problems within the company. It could be either agency problem between controlling shareholder of the manager, or non-controlling shareholders (Easterbrook, 1984; Faccio et al., 2001).
that enjoyed by the controlling shareholder, and less of a perquisite that that enjoyed by the manager (Su et al., 2014). A cash dividend is the expenditure of company resources which is made proportionally to the controlling and non-controlling shareholders. The distribution of dividends directly reduces/limits the expropria-tion made by managers/controlling shareholders (Faccio et al., 2001). Therefore, the controlling shareholder wishing to expropriate tends to avoid dividend payouts.
One type of expropriation action that a controlling shareholder can take is through the act of related party transactions. Su et al. (2014) conducted a study in China regarding the relationship between cash dividend payments and related party transactions, particularly loan components to related parties. They found a negative relationship between the amount of related party transactions and cash dividend payments. This indicates that a company that deals with many related parties will pay less cash dividends. Therefore, this study proposes a hypothesis in an alternative form as follows: H2: The related party transactions negatively
affect the company's cash dividend payment rate.
Based on the results of the previous research described above, it appears tax avoidance acts by a company may harm the interests of its non-controlling shareholders. Non-non-controlling share-holders will be disadvantaged, because the company’s tax avoidance through a transfer pricing scheme with related parties will reduce the corporate profits, which in turn will reduce the return on investment in the form of the cash dividends received by the non-controlling shareholders. Therefore, this study proposes a third hypothesis in an alternative form as follows:
H3: Through related party transactions,
corporate tax avoidance will be negatively related to the company's cash dividend payment rate.
3. Corporate Governance and the Relation-ship between Tax Avoidance Actions, RPT and Cash Dividend
La Porta et al. (2000) states that corporate governance is a mechanism that can reduce the information asymmetry between the internal and external parties, so as to reduce the possibility of expropriation of the non-controlling share-holders. The monitoring role of good corporate governance can be a mechanism that ensures the company related party transactions aim to maximize shareholders’ value. Klapper and Love (2004) state that the application of corporate governance is important for companies located in countries with weak law enforcement conditions, where the legal tools to protect the rights of non-controlling shareholders are poor.
Research related to the moderating role of corporate governance mechanisms has produced differing results. Lestari et al. (2014) found that the mechanism of a company’s corporate governance weakens the positive relationship between tax planning and firm value. This suggests that tax planning and corporate governance mechanisms have a substitution effect, where tax planning will be required at companies with a low quality of corporate governance. Diyanty et al. (2013) found that strong corporate governance practices are proven to prevent the entrenchment effect of the amount of related party transactions. While Utama and Utama (2013) have not been able to find any ability by corporate governance mechanisms to moderate the relationship between the related party transactions with the company's value. Koestaman and Diyanty (2013) found that the corporate governance mechanism of a company cannot protect the expropriation of its non-controlling shareholders. Based on the findings of this previous research, this study proposes a fourth hypothesis in an alternative form as follows:
H4a: A CG mechanism will moderate the
relationship between tax avoidance and the amount of related party transactions.
H4b: A CG mechanism will moderate the
relationship between the related party transactions with the company's cash dividend payment rate.
H4c: A CG mechanism will moderate the
relationship of tax avoidance and the company's cash dividend payout rate, which is mediated by the amount of related party transactions.
RESEARCH METHOD 1. Sample
The sample used in this study is the 100 companies with the largest market capitalization listed on the Indonesian Stock Exchange (BEI) in the period from 2011 to 2014. This period was chosen because of the availability of data; the financial data were obtained from www.idx.co.id or taken directly from the companies’ websites. For the corporate governance data, this study used CG scorecard data issued by the Indonesian Institute for Corporate Directorship.
2. Measurement of Variables Tax Avoidance
The Effective Tax Rate (ETR) is one of the most common measurements used to measure tax avoidance actions by a company (Hanlon & Heitzman, 2010). This study uses the current ETR to measure corporate tax avoidance. According to Hanlon and Heitzman (2010), the use of the current ETR may reflect the deferral strategy of the company and reflects the tax avoidance that is not in accordance with the applicable regulations (reflecting non-conforming avoidance). The current ETR is calculated by dividing the value of the current income tax expense by the profit before tax value.
Related Party Transactions
Measurements of the related party transactions in this study used and developed the measurements conducted by Utama (2015) and Chan et al. (2016). Utama (2015) divided related party transactions into four categories based on the groups presented in the financial statements, which are the Related Party Transactions of
Assets (RPTA), Related Party Transactions of Liabilities (RPTL), Related Party Transactions of Sales and revenue (RPTS) and Related Party Transactions of Expenses (RPTE). While Chan
et al. (2016) measured related party transactions based on the value of the other accounts receivable, because the results of the study in China found that the act of tunneling is mostly done through other receivables transactions. Therefore, this study divides the transactions related parties into six categories: RPT related to Assets (RPTA), Liabilities (RPTL), Sales and revenues (RPTS), Expenses (RPTE), Other Receivables (RPTA_OR), and Non-operating liabilities (RPTL_NonOp). The RPT value is presented based on the monetary amount.
Cash Dividend Policy
This study uses a Dividend Payout ratio (DIVPAYOUT) as a proxy of the cash dividend policy (Koestaman & Diyanty (2013); La Porta
et al. (2000)). DIVPAYOUT is the proportion of cash dividends paid by the company compared to the value of its net income.
Control Variables
To ensure that the research’s results are really influenced by the variables to be tested, this study also controls for the variables that have proven to also influence the actions of tunneling, which is measured using the RPT. The control variables are ROA, SIZE, LEV, DACC, BIG4, SOE, GROWTH, FIRST and AGE
(Chan et al. 2016). ROA is measured by dividing the net income by the value of the company’s assets. SIZE is a natural logarithm value of the total assets. LEV is leverage measured by dividing the total value of liabilities by the value of the total assets of the company. DACC is a residual value of discretionary accruals that is measured using a modified cross-sectional model of Jones. BIG4 is a dummy variable, which is 1 if the company is audited by a big 4 accounting firm, and 0 if not. SOE is a dummy variable, which is 1 if the company is a state-owned enterprise (SOE), and 0 if it is not.
percentage of the shares held by the largest shareholder. AGE is the length of time that the company has been listed on the Indonesian Stock Exchange.
3. Research Model
To test the first hypothesis, which examines the relationship between tax avoidance and the amount of Related Party Transactions (RPT), this study uses the following research model equation:
RPTit = 0 + 1ETRit + 2-10VARCONTROLit +
εit ...(1)
Where:
RPT = value RPTA, RPTA_OR, RPTL, RPTL_NonOp, RPTS, and RPTE for firm
i in year t
ETR = current value of ETR for firm i in year t VARCONTROL = ROA, SIZE, LEV, DACC,
BIG4, SOE, GROWTH, FIRST and AGE
If the hypothesis is proven, the study expects the value of to have a negative direction. The smaller that the value of ETR is indicates the greater the avoidance of tax that has been conducted by the company, and this will create a greater value for the amount of RPT.
Meanwhile, to test the second hypothesis, which examines the relationship between the amount of RPT and the company's cash dividend policy, this study uses the following research model equation:
DIVPAYOUTit = α0 + α1ETRit + α
2-10VARCONTROLit + εit (2)
Where:
DIVPAYOUT = cash dividend payout ratio of firm i in year t
RPT = value of RPTA, RPTA_OR, RPTL, RPTL_NonOp, RPTS, and RPTE for firm i in year t
VARCONTROL = ROA, SIZE, LEV, DACC,
BIG4, SOE, GROWTH, FIRST and
AGE of firm i in year t
If the hypothesis is proven, the study expects the value of to have a negative direction. The
greater the value of the RPT, the smaller the cash dividend to be distributed.
To test the third hypothesis, which is to test the effect of the magnitude of the mediation by
RPT on the relationship between tax avoidance and the company's cash dividend policy, this study uses the following research model equation:
DIVPAYOUTit = α0 + 1ETRit + 2 it +
3-11VARCONTROLit + εit (3)
Where:
DIVPAYOUT = cash dividend payout ratio of firm i in year t
ETR = current ETR of firm i in year t
= predicted value of RPTA, RPTA_OR, RPTL, RPTL_NonOp, RPTS, and RPTE
resulting from Equation (1) for firm i in year t
VARCONTROL = ROA, SIZE, LEV, DACC, BIG4, SOE, GROWTH, FIRST and AGE
of firm i in year t
If the third hypothesis is proven, the study expects the value of to have a negative direction. Through the RPT, the greater avoidance of tax by the company will result in reduced cash dividends by the company.
Finally, to test Hypothesis 4, which examines the effect of the moderating mechanism of CG on the relationship between the act of tax avoidance with the amount of RPT (Hypothesis 4a), the relationship between the amount of RPT and the level of the payment of cash dividends (Hypothesis 4b), and the relationship between tax avoidance and cash dividends payment which is mediated by RPT (Hypothesis 4c), then this research uses the following research model equations:
Hypothesis 4a:
RPTit = 0 + 1ETRit + 2CGit + 3ETR*CGit +
4-12VARCONTROLit + εit (4)
Hypothesis 4b:
DIVPAYOUTit = α 0 + α1RPTit + α2CGit +
α3RPT*CGit +
Hypothesis 4c:
DIVPAYOUTit = α 0 + 1ETRit + 2 it + 3CGit
+ 4ETR*CGit + 5 *CGit +
6-15VARCONTROLit + εit (6)
Where:
DIVPAYOUT = dividend payout ratio offirm i in year t
ETR = currentETR of firm i in year t
= predicted value of RPTA, RPTA_OR, RPTL, RPTL_NonOp, RPTS, and RPTE
resulting from Equation (1) for firm i in year t
CG = CG scorecard value of firm i in year t
VARCONTROL = ROA, SIZE, LEV, DACC, BIG4, SOE, GROWTH, FIRST and AGE
If Hypothesis 4 is proven, then the expected values of , and γ in this study should be statistically significant. Because the results of previous studies have different coefficient directions, this study does not predict the direction of certain coefficients.
RESEARCH RESULT AND ANALYSIS
1. Sample Selection Results
Criteria samples used in this study are as follows: (1) Companies in the top 100 for their market capitalization during 2011 to 2014, which are also included in the CG scorecard data issued by the IICD; (2) always included in the IICD data; (3) excluding the financial industry; (4) do not have negative profit values; (5) have their financial reporting period ending on
December 31; (6) during the observation period have an RPT value.
The financial industry is excluded in the sample because of the nature of the composition of its financial statements, which are different to those of other industries, so they cannot be compared. This research also excluded compa-nies that have negative earnings because it will be difficult to interpret the negative value of
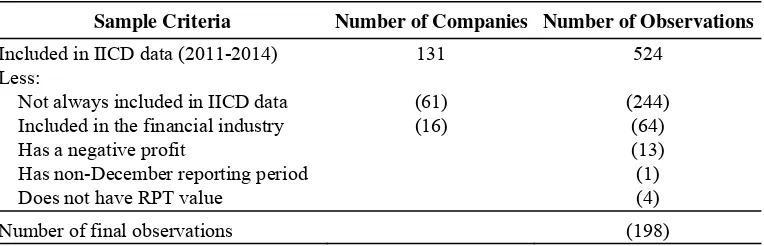
ETR. Based on the criteria that have been mentioned and after removing the outlier observations (3 observations), finally this study used 195 observations. To ensure that the data are normally distributed, this study winsorized the data by making the upper and lower limit 3 times the standard deviation of the mean. A summary of sample’s selection can be seen in Table 1.
2. Descriptive Statistics
Descriptive statistical analysis aims to provide a simple description of the data and results of the research conducted. Table 2 shows that the spread of the companies’ RPT values vary greatly and their magnitude is wide. For exam-ple, the RPTA has a minimum value of 0 and a maximum value of Rp2,908,949,581,498.82. The average dividend payout ratio is 0.33, while the average value of corporate CG is 53.31. From the average value of the big 4 it is seen that as many as 83% of the sample firms are audited by big 4 accounting firms; while for the SOE, it shows that only 14% of the sample are SOE companies. The condition for big 4 and SOE is constant during the observation period (see Figure 1).
Table 1. Sample Selection Procedure
Sample Criteria Number of Companies Number of Observations
Included in IICD data (2011-2014) Less:
Not always included in IICD data Included in the financial industry Has a negative profit
Has non-December reporting period Does not have RPT value
131
(61) (16)
524
(244) (64) (13) (1) (4)
Number of final observations (198)
The largest percentage of ownership in the sample companies is 57%. From the ages of the companies it appears that the average of the sample has been listed on the market for 15 years. This could lead to sample selection bias, in that the sample used in this study are large companies that have proven their survival ability.
Table 3 shows that the disclosure of corporate RPT mostly consists of RPTA and RPTL, respectively at 88.43% and 81.48% of the total observations. While Non-operating RPTS (RPTS-NonOp) and Non-operating RPTE (RPTE-NonOp) data are very small, 23.61% and 30.56% respectively. Therefore, this study does
not investigate the operating RPTS and non-operating RPTE any further.
Table 3: Distribution of RPT data in observation Distribution of
RPT transactions Number of observations
RPTA 88.43%
Source: Primary Data processed, 2017
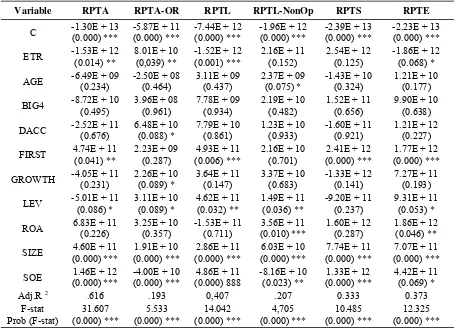
Table 4 Results of Empirical Model Regression Testing Hypothesis 1
Variable RPTA RPTA-OR RPTL RPTL-NonOp RPTS RPTE
ETR = current ETR; RPTA = related party transaction related to assets, RPTA-OR = related party transaction that included in the group of other receivables, RPTL = related parties transactions that included in the group of liabilities, RPTL-NonOp = related parties transaction that included in the group of non-operating debt, RPTS = related parties transaction that included in the group of sales, RPTE = related party transaction that are included in the group of expense.
3. Correlation Test and Normality
As shown in Appendix 1, the correlation test shows that each of the tested variables has correlation with the other tested variables, with an average value below 0.5. This indicates that the test results are free from collinearity problems. Statistical descriptive results also show that the average skewness value of the tested variable is less than 2. This indicates the data is normally distributed.
4. Hypothesis Testing Testing of Hypothesis 1 (H 1)
The result of the empirical model’s regression to test the effect of tax avoidance action on RPT’s quantity (Hypothesis 1) can be seen in Table 4. The table shows that for all the categories of RPT, the F-statistic equations have
Prob. (F-statistic) that are significant (0.0000), this suggests that the independent variables which were tested together proved significant (α = 1%), and they affect the dependent variables
(RPT). But the adjusted R-squared magnitude of each RPT shows different values.
The highest adjusted R-squared value was shown by RPTA (61.6%) and the smallest by
RPTA-OR (19.3%). This means that the amount of RPTA that can be explained by the independent variables tested is 61.6%, while the remaining 38.4% is explained by other variables that are not addressed in this study. As for
RPTA-OR, 19.3% can be explained by the
independent variables that were tested, while the remaining 80.7% is explained by other variables that are also not addressed in this study.
Table 4 also shows that 4 out of the 6 categories of RPT show that ETR significantly affects the RPT. It showed that ETR affected
RPTA, RPTL and RPTE in a negatively
significant manner (with a confidence level of α = 5%, 1% and 10%). But for the RPTA-OR test results, they indicate different direction coefficients, which are positive with a confidence level of α = 5%.
These results indicate moderate support for the hypothesis, that the greater the level of tax avoidance that companies do (shown by the decreasing ETR values), then the amount of related party transactions will be also higher. This is consistent with the results of research conducted by Chan et al. (2016).
Testing of Hypothesis 2 (H2)
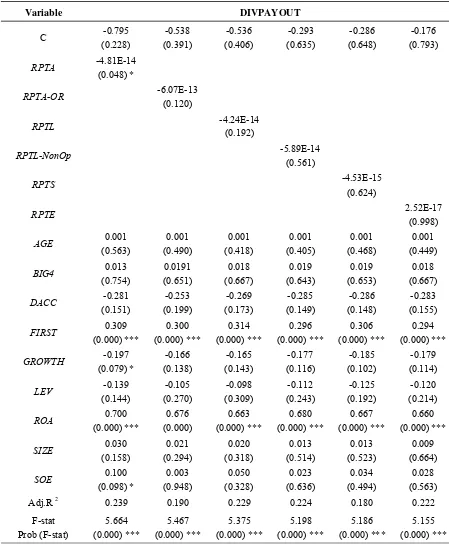
The results of the empirical model’s regression to test the effect of RPT on the companies’ cash dividend policy (DIVPAYOUT)
can be seen in Table 5. The table shows that for all the categories of RPT, the value of the F-statistic equations has Prob. (F-statistic) that are significant (0.0000); it suggests that the independent variables that were tested together are significant (α = 1%), and they affect the dependent variables (DIVPAYOUT). But the value of the adjusted R-squared of each category of RPT shows a relatively small value. As an example, RPTA has a value of adjusted R-squared of 23.9%. This shows that 23.9% of the
DIVPAYOUT can be explained by the
independent variables that were tested, while the remaining 76.1% is explained by other variables that are not addressed in this study.
Table 5 shows that of all the categories of
RPT that were tested, only RPTA negatively and significantly affected DIVPAYOUT. The others,
RPTA-OR, RPTL, RPTL-NonOp, RPTS and
RPTE were not proven to have significantly affected DIVPAYOUT. Although they were not significant, the coefficient RPTA-OR, RPTL, RPTL-NonOp and RPTS showed a negative direction, which is in accordance with the predicted direction.
Table 5 Results of Empirical Model Regression Testing Hypothesis 2
ETR = current ETR; RPTA = related parties transaction included in the group of assets, RPTA-OR = related parties transaction that are included in the group of other receivables, RPTL = related parties transaction that included in the group of liabilities, RPTL-NonOp = related parties transaction that included in the group of non-operating debt, RPTS = related parties transaction that included in the group of sales, RPTE = related party transaction that are included in the group of expense.
Where: *** significant 1%; ** significant 5%; * Significant 10%.
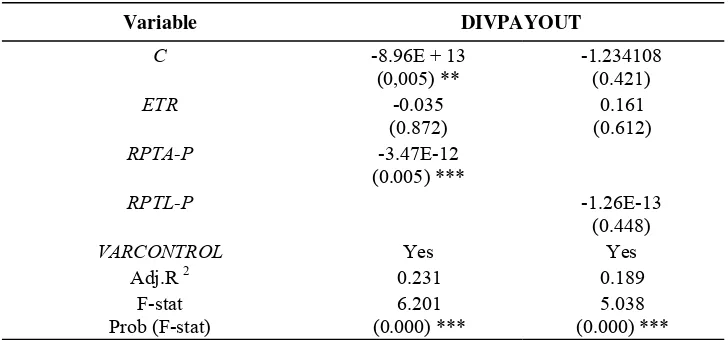
Table 6 Results of Empirical Model Regression Testing Hypothesis 3
Variable DIVPAYOUT
C -8.96E + 13 (0,005) **
-1.234108 (0.421)
ETR -0.035
(0.872)
0.161 (0.612)
RPTA-P -3.47E-12
(0.005) ***
RPTL-P -1.26E-13
(0.448)
VARCONTROL Yes Yes
Adj.R 2 0.231 0.189
F-stat Prob (F-stat)
6.201 (0.000) ***
5.038 (0.000) *** N = 195 observations
ETR = current ETR; RPTA-P = value of predicted related party transaction included in the group of assets, RPTL P = value of predicted related party transaction in the group of liabilities.
Where: *** significant 1%; ** significant 5%; * Significant 10%. Source: Primary Data processed, 2017
Testing of Hypothesis 3 (H3)
The results of the empirical model’s regression to test the mediating effect of RPT on the relationship between tax avoidance (ETR)
and the company's cash dividend policy
(DIVPAYOUT) can be seen in Table 6.
Regression testing of the third hypothesis can only be done for the RPT categories RPTA-P and
RPTL-P (the value of RPT is predictive from the results of Equation 1). This is due to the other
RPT variables having collinearity problems. If we look at Table 6, it is seen that for the categories RPTA and RPTL, the value of the F-statistic equations has Prob. (F-statistic) that are significant (0.0000), it suggests that the independent variables that were tested together were significant (α = 1%), and influenced the dependent variables (DIVPAYOUT). But the value of the adjusted R-squared for each category of RPT shows a relative small value. As an example, RPTA has a value for its adjusted R-squared of 23.1%. This shows that 23.1% of the
DIVPAYOUT can be explained by the
independent variables that were tested, while the other 76.9% is explained by other variables that are not addressed in this study.
Table 6 also shows that the coefficient
RPTA-P has a negative direction and is
significant, and affects DIVPAYOUT. Whereas the coefficient RPTL-P, although not able to show any significant results in influencing
DIVPAYOUT, has a direction that is consistent with the predictions (a negative direction). It indicates that the companies’ tax avoidance can reduce the value of their cash dividends distributed to shareholders, and this act is done through a related party transaction. But overall the study was only able to provide a little evidence for the influence of RPT’s mediation on the relationship between tax avoidance and the companies’ cash dividend policies.
Testing Hypotheses 4a (H4a)
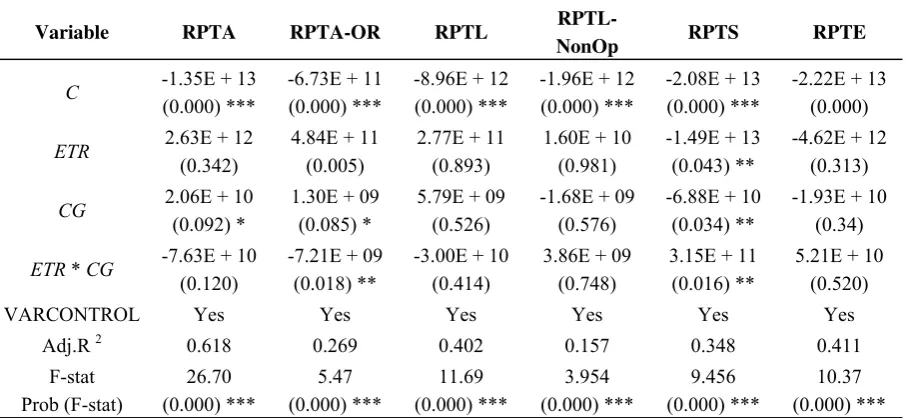
Table 7 shows the results of the empirical model’s regression to test the moderating influence of CG on the relationship between the magnitude of the tax avoidance action and RPT (Hypothesis 4a). The table shows that for all the categories of RPT, the value of the F-statistic
highest adjusted R-squared is RPTA (61.8%) and the smallest is RPTL-NonOp. (15.7%).
The interaction coefficient between ETR and
CG (ETR*CG) shows that the significant value is only visible with the categories RPTA-OR and
RPTS, which both have a significance level of α = 5%. However, the direction coefficients of the two categories look different, RPTA-OR shows a negative direction, while RPTS shows a positive value. It suggests a moderate support for the hypothesis, that CG moderates the relationship between tax avoidance and related party transactions.
The result of Hypothesis 4a testing indicates that strong CG practices will be able to reduce the expropriation actions conducted by a company through RPTA-OR (it supports Chan et al.’s (2016) result), but this effect does not occur in RPTS. It is assumed to occur because the related parties’ sales tend to be for efficiency
purposes, so that the application of good CG will strengthen this relationship.
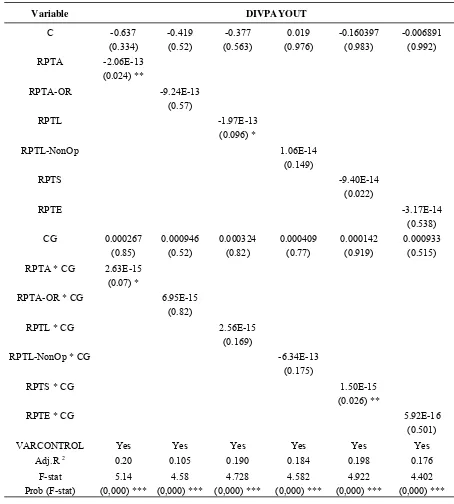
Testing Hypothesis 4b (H4b)
The results of the empirical model’s regression to test the moderating effect of CG on the relationship between the amount of RPT and the company's cash dividend policy (Hypothesis 4b) can be seen in Table 8. The table shows that for all the categories of RPT, the values of the F-statistic equations has Prob. (F-statistic) that are significant (0.0000), this suggests that the independent variables that were tested together are significant (α = 1%) and affect the dependent variables (RPT). But the magnitude of the adjusted R-squared of each RPT shows a relatively small value with different magnitudes. The highest adjusted R-squared is shown by
RPTA (20%) and the smallest is RPTA-OR
(10.5%).
Table 7 Results of Empirical Model Regression Testing Hypothesis 4a
Variable RPTA RPTA-OR RPTL
RPTL-NonOp RPTS RPTE
C -1.35E + 13 (0.000) ***
-6.73E + 11 (0.000) ***
-8.96E + 12 (0.000) ***
-1.96E + 12 (0.000) ***
-2.08E + 13 (0.000) ***
-2.22E + 13 (0.000)
ETR 2.63E + 12 (0.342)
4.84E + 11 (0.005)
2.77E + 11 (0.893)
1.60E + 10 (0.981)
-1.49E + 13 (0.043) **
-4.62E + 12 (0.313)
CG 2.06E + 10 (0.092) *
1.30E + 09 (0.085) *
5.79E + 09 (0.526)
-1.68E + 09 (0.576)
-6.88E + 10 (0.034) **
-1.93E + 10 (0.34)
ETR * CG -7.63E + 10
(0.120)
-7.21E + 09 (0.018) **
-3.00E + 10 (0.414)
3.86E + 09 (0.748)
3.15E + 11 (0.016) **
5.21E + 10 (0.520) VARCONTROL Yes Yes Yes Yes Yes Yes
Adj.R 2 0.618 0.269 0.402 0.157 0.348 0.411 F-stat
Prob (F-stat)
26.70 (0.000) ***
5.47 (0.000) ***
11.69 (0.000) ***
3.954 (0.000) ***
9.456 (0.000) ***
10.37 (0.000) *** N = 195 observations
ETR = current ETR; RPTA = related party transaction included in the group of assets, RPTA-OR = related party transaction that are included in the group of other receivables, RPTL = related party transaction included in the group of liabilities, RPTL-NonOp = related party transaction included in the group of non-operating debt, RPTS = related party transaction included in the group of sales, RPTE = related party transaction included in the group of expense.
Table 8 Results of Empirical Model Regression Testing Hypothesis 4b
Variable DIVPAYOUT
C -0.637 (0.334)
-0.419 (0.52)
-0.377 (0.563)
0.019 (0.976)
-0.160397 (0.983)
-0.006891 (0.992) RPTA -2.06E-13
(0.024) **
RPTA-OR -9.24E-13
(0.57)
RPTL -1.97E-13
(0.096) *
RPTL-NonOp 1.06E-14
(0.149)
RPTS -9.40E-14
(0.022)
RPTE -3.17E-14
(0.538) CG 0.000267
(0.85)
0.000946 (0.52)
0.000324 (0.82)
0.000409 (0.77)
0.000142 (0.919)
0.000933 (0.515)
RPTA * CG 2.63E-15 (0.07) *
RPTA-OR * CG 6.95E-15 (0.82)
RPTL * CG 2.56E-15
(0.169)
RPTL-NonOp * CG -6.34E-13
(0.175)
RPTS * CG 1.50E-15
(0.026) **
RPTE * CG 5.92E-16
(0.501)
VARCONTROL Yes Yes Yes Yes Yes Yes
Adj.R 2 0.20 0.105 0.190 0.184 0.198 0.176
F-stat Prob (F-stat)
5.14 (0,000) ***
4.58 (0,000) ***
4.728 (0,000) ***
4.582 (0,000) ***
4.922 (0,000) ***
4.402 (0,000) ***
N = 195 observations
ETR = current ETR; RPTA = related party transaction included in the group of assets, RPTA-OR = related party transaction included in the group of other receivables, RPTL = related party transaction included in the group of liabilities, RPTL-NonOp = related party transaction parties included in the group of non-operating debt, RPTS = related party transaction included in the group of sales, RPTE = related party transaction included in the group of expense.
Table 8 shows that the interaction variable between CG and RPT (RPT * CG) has a positive and significant value when measured by the categories RPTA and RPTS. This indicates that a strong CG will strengthen the negative correlation between RPT and the companies’ policies on providing cash dividends.
Given that companies in Indonesia generally have a high concentration of ownership (Claessens et al. 2000), then any dividend payments will be greatly enjoyed by the controlling shareholders. The application of a
strong CG can reduce the expropriation of the non-controlling shareholders’ interests.
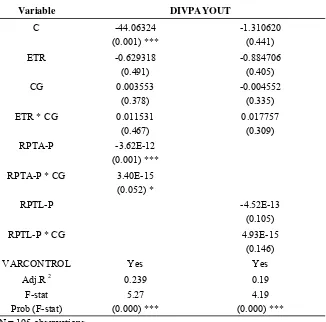
Testing Hypotheses 4c (H4c)
Table 9 shows the results of empirical testing to examine the moderating effect of CG on the relationship between tax avoidance and the companies’ cash dividend policies that are mediated by RPT (Hypothesis 4c). As with the third test, this study is only able to perform regression testing of the RPT on the categories
RPTA-P and RPTL-P. This is due to the other RPT categories having collinearity problems.
Table 9 Results of Empirical Model Regression Testing Hypothesis 4c
Variable DIVPAYOUT
C -44.06324 (0.001) ***
-1.310620 (0.441)
ETR -0.629318 (0.491)
-0.884706 (0.405) CG 0.003553
(0.378)
-0.004552 (0.335) ETR * CG 0.011531
(0.467)
0.017757 (0.309) RPTA-P -3.62E-12
(0.001) ***
RPTA-P * CG 3.40E-15 (0.052) *
RPTL-P -4.52E-13
(0.105)
RPTL-P * CG 4.93E-15
(0.146)
VARCONTROL Yes Yes
Adj.R 2 0.239 0.19
F-stat Prob (F-stat)
5.27 (0.000) ***
4.19 (0.000) *** N = 195 observations
ETR = current ETR; RPTA-P = predicted value of related party transaction included in the group of assets, RPTL P = predicted value of related party transaction in the group of liabilities. CG = CG index.
In accordance with the results of Hypothesis 4b’s testing, Hypothesis 4c’s testing results also show that the application of a strong CG looks to strengthen the negative relationship between tax avoidance and the companies’ cash dividend policies that are made through a RPT. This is indicated by the coefficient of the interaction variable RPTA-P * CG which has a positive direction and is significant (α = 1%). Although the interaction variable RPTL-P * CG does not have a significant effect, it has a positive direction.
5. Sensitivity Test
To ensure that the results of this study are robust, researchers have replaced the measurement of ETR by using the GAAP ETR,
measure, by dividing the total tax expense with earnings before tax. The examination results show they are relatively equal to the main test results. This study has also attempted to replace the companies’ cash dividend policies measures with the amount of cash dividends distributed by the companies. However, the test results show lower significance values than testing using the dividend payouts ratios as a measure of their dividend policies.
CONCLUSION
This study aimed to empirically test the relationship between tax avoidance, the amount of related party transactions and companies’ dividend policies. Furthermore, this study will also investigate the moderating effect of Corporate Governance (CG) on the relationship between tax avoidance, the Related Party Transactions (RPT) and the companies’ dividend policies.
This study has three contributions. First, this study showed a direct relationship between tax avoidance and the payment of cash dividends which are mediated by RPT. Second, the study also sought to examine the moderating effect of CG on the relationship between tax avoidance and RPT, as well as CG’s moderating effect on the relationship between tax avoidance with the payment of a cash dividend, which is mediated by the RPT. Third, this study developed the
measurement of RPT (Utama, 2015) by looking in a more specific manner at RPT’s components (see transactions components outside the main business of the company - the component’s "other" (Chan et al. 2016)). This study uses six categories of RPT, those are RPTA (the RPT category that includes the assets), RPTA-OR (the RPT category that includes a group of other receivables), RPTL (the RPT category that includes a group of liabilities), RPTL-NonOp.
(the RPT category that includes a group of non-operating liabilities), RPTS (the RPT category that includes the sales and revenue) and RPTE
(the RPT category that includes the expenses). This study showed moderate support for the first hypothesis, that the greater that the avoidance of tax is (shown by the decreasing amount of ETR value), then the amount of related party transactions will also be higher. Results from testing the second hypothesis show that the amount of related party transactions by a company is negatively related to the company's cash dividend payment policy, but this is also only partially proven (evidence exists only when testing is done using RPTA categories). The results of the test of the third hypothesis show that the RPT will mediate the relationship between the act of tax avoidance and the cash dividend policy, but this is also only supported by a little evidence, that is, only if the RPT was measured using the RPTA-P categories (RPTA
prediction value results from regression of Equation 1).
Examination of the moderating capabilities of CG on the relationship variables were tested, however this study found only moderate evidence to support the hypothesis. Hypothesis 4a’s testing results indicate that a strong CG will be able to reduce the expropriation actions that companies take through RPTA-OR, but this effect does not occur in RPTS. It is assumed to occur because the related parties’ sales tend to be for efficiency purposes, so that the appli-cation of good CG will strengthen this relationship.
policies to provide cash dividends (the results were obtained when using a RPTA-P category measurement). Given that the companies in Indonesia are companies with high ownership concentrations, then the dividend payment will be greatly enjoyed by the controlling shareholders. The application of a strong CG can reduce the expropriation of the non-controlling shareholders’ interests. Results of hypothesis 4c’s testing also show the same results as Hypothesis 4b, it shows that a strong CG looked to strengthen the negative relationship between tax avoidance and the companies’ cash dividend policies which are made through related party transactions (the results were obtained when using the measurements of the RPTA-P
category).
MANAGERIAL IMPLICATION, LIMITATION AND SUGGESTIONS
The results of this study have several implications. First, the moderate support for the hypotheses suggests that firms carry out tax avoidance through related party transactions. It supports the implementation of PMK No.213/PMK.03/2016, which regulates for the additional documentation and/or information relating to related party transactions. Second, the application of a strong CG looks to reduce the expropriation of the non-controlling shareholders. Therefore, the companies should implement good CG mechanisms.
This study has several limitations. First, the test is only performed on those companies that fall within the 100 largest market capitalizations during the observation period. Increasing the number of samples will increase the ability of the results to be generally acceptable. Second, the regression testing using the full sample does not distinguish whether the observation has a value from a specific category or not. Future studies should include regression testing with a
selected sample, which is tested only with an observation that has its RPT value categories tested. For example, testing RPTA only using the observations that have a RPTA value, and exclude any observations that have had none of their RPT categories tested.
REFERENCES
Chan, K.H., P.L.L. Mo, and T. Tang, 2016. “Tax avoidance and tunneling: Empirical analysis from the agency perspective.” Journal of International Accounting Research, 15 (3). Chen, S., X., Q. Chen, Cheng, and T. Shevlin,
2010. “Are family firms more aggressive tax than non-family firms?” Journal of Financial Economics, 95, 41-61.
Cheung, YL, P.R. Rau, and A. Stouraitis, 2006. “Tunneling, propping, and expropriation: evidence from the connected party transactions in Hong Kong.” Journal of Financial Economic, 82.
Claessens, S., S. Djankov, and L.H.P. Lang, 2000. “The separation of ownership and control in East Asian Corporations.”
Journal of Financial Economics, 58, 81-112.
Desai, M.A, A. Dyck, and L. Zingales, 2007. “Theft and taxes.” Journal of Financial Economics, 84.
Easterbrook, F., 1984. “Two agency cost explanations of dividends.” American Economic Review, 74, 650-659.
Elkelish, W.W., 2017. “IFRS disclosure of related party transactions and valuation firm in the United Arab Emirates emerging markets.” Journal of Accounting in Emerging Economies, 7 (2).
Faccio, M., L.H.P. Lang, and L. Young, 2001. “Dividend and expropriation.” American Economic Review, 91, 54-78.
Ge, W., D.H., S. Drury, F. Fortin, Liu, and D. Tsang, 2010. “Disclosed value relevance of related party transactions.” Advances in Accounting, incorporating Advances in International Accounting, 26, 134-141. Hartati, W., Desmiyawati, and N. Azlina, 2014.
Horngren, C.T., S.M. Datar, and G. Foster, 2012. "Cost Accounting; A Managerial Emphasis. 14th Edition", Prentice Hall.
Johnson, S., R. La Porta, F. Lopez-de-Silanes, and A. Shleifer, 2000. “Tunneling.” The American Economic Review, 90 (2).
Klapper, L.F. and I. Love, 2004. “Corporate governance, investor protection, and performance in emerging markets.” Journal of Corporate Finance, 703-728.
Koetaman E., and V. Diyanty, 2013. “Pengaruh Kepemilikan Pengendali Akhir terhadap Kebijakan Dividen Kas dengan Kepemilikan Keluarga dan Mekanisme Corporate Governance sebagai Variabel Moderasi [The Influence of Final Control Ownership on Cash Dividend Policy with Family Ownership and Corporate Governance Mechanism as Moderating Variables].”
Presented in National Symposium Accounting 16, Manado.
Kohlbeck, M., and B.W. Mayhew, 2010. “Valuation of firms that disclose related party transactions.” J. Account. Public Policy, 29, 115-137.
La Porta, R., R. Lopez-de-Silanes, A. Shleifer, and R. Vishny, 2000. “Investor protection and corporate governance.” Journal of Financial Economics, 58 (1): 1-25
Lestari, N., R. Ward, and V. Anggraita, 2014. “Pengaruh Perencanaan Pajak terhadap Nilai Perusahaan dengan Moderasi Corporate Governance [The Effect of Tax Planning on Company Value with Corporate Governance as a Moderating
Variable].” Presented in National
Symposium Accounting 17, Lombok. Miller, M. And F. Modigliani,. 1961. “Dividend
policy, growth, and the valuation of shares.”
Journal of Business, 34, 411-431.
Prastowo, Y., 2017. Membidik ratusan korporasi dari transfer pricing. [Targeting hundreds of corporations from transfer pricing]
http://nasional.kontan.co.id/news/membidik -ratusan-korporasi-dari-transfer-pricing. Access on May 19th, 2017.
Ryngaert, M., and S. Thomas, 2012. “Not all related party transactions (RPTs) are the same: Ex ante versus ex post RPTs”.
Journal of Accounting Research, 50.
Su, Z.Q., H.G. Fung, D.S. Huang, and C.H. Shen, 2014. “Cash dividends, expropriation, and political connections: Evidence from China.” International Review of Economics and Finance, 260-272.
Utama, CA., 2015. “Penentu Besaran Transaksi Pihak berelasi: Tata Kelola, Tingkat Pengungkapan, dan Struktur Kepemilikan [The magnitude of the Related Party's Transactions Determination: Management, Disclosure Rate, and Ownership Struc-ture].” Jurnal Akuntansi dan Keuangan Indonesia, 12 (1).
Utama, CA, and S. Utama, 2014. “Corporate Governance, Size and Disclosure of Related Party Transactions, and Firm Value: Indonesia evidence.” International Journal of Disclosure and Governance, 11, 4, 341-365.
Utama, S., C.A. Utama, and R. Yuniasih, 2010. “Related Party Transaction - Efficient or Abusive: Indonesia Evidence.” Asia Pacific Journal of Accounting and Finance, 1. Yuniasih, NW, I.K. Sumadi, U. Hesadijaya, and
J
o
urna
l of
Indo
nesi
a
n
Eco
n
omy and Business
Sep
temb
er
Appendix 1
Corre lation matrix