G
• Inspect variables and data structures
• Understand segmentation faults and core dumps • Know why your program crashes or throws exceptions
• Use features like catchpoints, convenience variables,
• Avoid common debugging pitfalls
THE ART OF
DEBUGGING
with GDB, DDD, and Eclipse
by Norman Matloff and Peter Jay Salzman
THE ART OF DEBUGGING WITH GDB, DDD, AND ECLIPSE.Copyright © 2008 by Norman Matloff and Peter Jay Salzman.
All rights reserved. No part of this work may be reproduced or transmitted in any form or by any means, electronic or mechanical, including photocopying, recording, or by any information storage or retrieval system, without the prior written permission of the copyright owner and the publisher.
12 11 10 09 08 1 2 3 4 5 6 7 8 9
ISBN-10: 1-59327-002-X ISBN-13: 978-1-59327-174-9
Publisher: William Pollock Production Editor: Megan Dunchak Cover and Interior Design: Octopod Studios Developmental Editor: Tyler Ortman Technical Reviewer: Daniel Jacobowitz Copyeditor: Neil Ching
Compositor: Riley Hoffman Proofreader: Rachel Kai
Indexer: Fred Brown, Allegro Technical Indexing
For information on book distributors or translations, please contact No Starch Press, Inc. directly: No Starch Press, Inc.
555 De Haro Street, Suite 250, San Francisco, CA 94107
phone: 415.863.9900; fax: 415.863.9950; [email protected]; www.nostarch.com
Library of Congress Cataloging-in-Publication Data
Matloff, Norman S.
The art of debugging with GDB, DDD, and Eclipse / Norman Matloff and P.J. Salzman.
p. cm.
ISBN-13: 978-1-59327-002-5 ISBN-10: 1-59327-002-X
1. Debugging in computer science. 2. Computer software-Quality control. I. Salzman, P.J. II. Title.
QA76.9.D43M35 2008 005.1’4-dc22
2003017566
No Starch Press and the No Starch Press logo are registered trademarks of No Starch Press, Inc. Other product and company names mentioned herein may be the trademarks of their respective owners. Rather than use a trademark symbol with every occurrence of a trademarked name, we are using the names only in an editorial fashion and to the benefit of the trademark owner, with no intention of infringement of the trademark.
B R I E F C O N T E N T S
Preface. . . xi
Chapter 1: Some Preliminaries for Beginners and Pros. . . 1
Chapter 2: Stopping to Take a Look Around. . . 47
Chapter 3: Inspecting and Setting Variables. . . 95
Chapter 4: When a Program Crashes . . . .117
Chapter 5: Debugging in a Multiple-Activities Context. . . .145
Chapter 6: Special Topics. . . .185
Chapter 7: Other Tools. . . .205
Chapter 8: Using GDB/DDD/Eclipse for Other Languages. . . .235
C O N T E N T S I N D E T A I L
PREFACE xi
1
SOME PRELIMINARIES FOR BEGINNERS AND PROS 1
1.1 Debugging Tools Used in This Book . . . 1
1.2 Programming Language Focus. . . 2
1.3 The Principles of Debugging. . . 2
1.3.1 The Essence of Debugging: The Principle of Confirmation. . . 2
1.3.2 Of What Value Is a Debugging Tool for the Principle of Confirmation? 3 1.3.3 Other Debugging Principles. . . 4
1.4 Text-Based vs. GUI-Based Debugging Tools, and a Compromise Between Them. . . 5
1.4.1 Brief Comparison of Interfaces . . . 5
1.4.2 Compromises. . . 12
1.5 Main Debugger Operations . . . 14
1.5.1 Stepping Through the Source Code. . . 14
1.5.2 Inspecting Variables . . . 15
1.5.3 Issuing an “All Points Bulletin” for Changes to a Variable . . . 17
1.5.4 Moving Up and Down the Call Stack . . . 17
1.6 Online Help. . . 19
1.7 Introductory Debugging Session. . . 19
1.7.1 The GDB Approach. . . 22
1.7.2 The Same Session in DDD . . . 36
1.7.3 The Session in Eclipse. . . 38
1.8 Use of Startup Files. . . 43
2 STOPPING TO TAKE A LOOK AROUND 47 2.1 Mechanisms for Pause . . . 47
2.2 Overview of Breakpoints . . . 48
2.3 Keeping Track of Breakpoints. . . 49
2.3.1 Breakpoint Lists in GDB. . . 49
2.3.2 Breakpoint Lists in DDD. . . 50
2.3.3 Breakpoint Lists in Eclipse. . . 51
2.4 Setting Breakpoints . . . 51
2.4.1 Setting Breakpoints in GDB . . . 51
2.4.2 Setting Breakpoints in DDD . . . 55
2.4.3 Setting Breakpoints in Eclipse. . . 56
7.1 Making Good Use of a Text Editor . . . .206
7.1.1 Syntax Highlighting. . . .206
7.1.2 Matching Brackets . . . .208
7.1.3 Vim and Makefiles. . . .209
7.1.4 Makefiles and Compiler Warnings . . . .210
7.1.5 Final Thoughts on a Text Editor as an IDE . . . .211
7.2 Making Good Use of the Compiler. . . .212
7.3 Error Reporting in C . . . .213
7.3.1 Using errno . . . .213
7.4 Better Living with strace and ltrace . . . .217
7.5 Static Code Checkers: lint and Friends. . . .219
7.5.1 How to Use splint. . . .221
7.5.2 Last Words. . . .221
7.6 Debugging Dynamically Allocated Memory . . . .221
7.6.1 Strategies for Detecting DAM Problems . . . .224
7.6.2 Electric Fence . . . .225
7.6.3 Debugging DAM Problems with GNU C Library Tools. . . .228
8 USING GDB/DDD/ECLIPSE FOR OTHER LANGUAGES 235 8.1 Java. . . .236
8.1.1 Direct Use of GDB for Debugging Java. . . .238
8.1.2 Using DDD with GDB to Debug Java. . . .240
8.1.3 Using DDD as a GUI for JDB. . . .241
8.1.4 Debugging Java in Eclipse. . . .241
8.2 Perl . . . .242
8.2.1 Debugging Perl via DDD . . . .244
8.2.2 Debugging Perl in Eclipse. . . .246
8.3 Python. . . .247
8.3.1 Debugging Python in DDD. . . .249
8.3.2 Debugging Python in Eclipse. . . .250
8.4 Debugging SWIG Code . . . .251
8.5 Assembly Language . . . .255
P R E F A C E
“Hey, this thing really works!” So said one of our
stu-dents, Andrew, after he made serious use of a
debug-ging tool for the first time. He had learned about
de-bugging tools three years earlier in his freshman
pro-gramming courses, but he had dismissed them as just
something to learn for the final exam. Now as a
fourth-year student, Andrew’s professor urged him to stop
us-ing print statements for debuggus-ing and make use of
formal debugging tools. To his delight and surprise,
he found that he could greatly reduce his debugging
time by making use of the proper tools.
As this book’s copyeditor pointed out, much knowledge of debugging exists in some communities as kind of folklore, but it is not written in books. Well, this book will change that. We’ll address questions like the following:
• How do you debug threads code?
• Why do breakpoints sometimes end up at slightly different locations than where you set them?
• Why does the GDBuntilcommand sometimes jump to a “surprising” place?
• What cool tricks can be done with DDD and Eclipse?
• In today’s GUI age, do text-based applications such as GDB have any value?
• Why didn’t a segmentation fault occur when your erroneous code ex-ceeded the bounds of an array?
• Why is one of our example data structures namednsp? (Sorry, that’s an inside joke with our publisher.)
This book is neither a glorified user’s manual nor an abstract treatise on the cognitive theory of the debugging process. Instead, it is something intermediate to these two genres. On one hand, we do indeed give informa-tion on the “how-to” for specific commands in GDB, DDD, and Eclipse; but on the other hand, we do set forth and make frequent use of some general principles for the debugging process.
We chose GDB, DDD, and Eclipse as our illustrative tools because of their popularity in the Linux/open source communities. Our examples slightly favor GDB, not only because its text-based nature makes it more compact to present on a page but also because, as alluded to above, we find that text-based commands still play a valuable role in the debugging process.
Eclipse has become quite widely used for much more than simply the debugging role we treat here, and it does provide an attractive, versatile tool for debugging. On the other hand, DDD has a much smaller footprint and includes some powerful features not found in Eclipse.
Chapter 1, “Some Preliminaries for Beginners and Pros,” is an overview. Many experienced programmers may be tempted to skip it, but we urge them to read through it, as we do set forth a number of simple but power-ful general guidelines that we recommend for the debugging process.
Then Chapter 2, “Stopping to Take a Look Around,” covers the workhorse of debugging, the breakpoint, discussing all the ins and outs—setting, delet-ing, and disabling breakpoints; moving from one breakpoint to the next; viewing detailed information on breakpoints; and so on.
present an especially nice DDD feature for graphical display of trees and other linked data structures.
Chapter 4, “When a Program Crashes,” covers the dreaded runtime er-rors arising from segmentation faults. We first present material on what is happening at the lower levels, including memory allocation for a program and the cooperative roles of the hardware and the operating system. Read-ers with a good systems knowledge may skim through this material, but we believe that many others will profit by acquiring this foundation. We then turn to core files—how they are created, how to use them to perform “post mortems,” and so on. We finish the chapter with an extended example of a debugging session in which several bugs produce seg faults.
We chose “Debugging in A Multiple-Activities Context” for the title of Chapter 5 to make the point that we cover not only parallel programming but also network code. Client/server network programming does count as parallel processing, with even our tools being used in parallel—for example, two windows in which we use GDB, one for the client, one for the server. Since network code involves system calls, we supplement our debugging tools with the C/C++errnovariable and the Linuxstracecommand. The next portion of Chapter 5 involves threads programming. Here again we be-gin with a review of the infrastructure: timesharing, processes and threads, race conditions, and so on. We present the technical details of working with threads in GDB, DDD, and Eclipse and again discuss some general princi-ples to keep in mind, such as the randomness of the timing in which threads context switches occur. The final part of Chapter 5 concerns parallel pro-gramming with the popular MPI and OpenMP packages. We end with an extended example in the context of OpenMP.
Chapter 6, “Special Topics,” covers some important miscellaneous top-ics. A debugging tool can’t help you if your code doesn’t even compile, so we discuss some approaches for dealing with this. Then we treat the prob-lem of failure to link, due to missing libraries; once again we felt it was useful here to give some “theory”—types of libraries and how they are linked to your main code, for example. And what about debugging GUI programs? For simplicity, we stick to a “semi-GUI” setting here, that of curses program-ming, and show how to get GDB, DDD, and Eclipse to interact with the events in your curses window.
As noted earlier, the debugging process can be greatly enhanced through the use of supplementary tools, several of which we present in Chapter 7, “Other Tools.” We have additional coverage oferrnoandstrace, some mate-rial onlint, and tips on the effective use of a text editor.
Though the book focuses on C/C++, we have coverage of other lan-guages in Chapter 8, “Using GDB/DDD/Eclipse for Other Lanlan-guages,” treating Java, Python, Perl, and assembly language.
We apologize if we have somehow missed the reader’s favorite debug-ging topic, but we have covered the material that we have found useful in our own programming.
the firm’s founder and editor, Bill Pollock. He had faith in this offbeat project from the beginning and was remarkably tolerant of our many delays.
Daniel Jacobowitz did a truly stellar job of reviewing the manuscript, providing many points of invaluable advice. Neil Ching, ostensibly hired to do copyediting, turned out to actually be a “ringer” with a degree in com-puter science! He brought up a number of important points concerning the clarity of our technical discussions. The quality of the book was greatly en-hanced by the feedback we received from both Daniel and Neil. Of course, the usual disclaimer must be made that any errors are our own.
Norm says: I wish to sayxie xieandtodah rabahto my wife Gamis and daughter Laura, two amazing people whom I feel lucky to be related to. Their approach to problem solving, sparkling humor, andjoie de vivre per-vade this book in spite of their not having read a word of it. I also thank the many students I have taught over the years, who teach me as much as I teach them, and who make me feel that I chose the right profession after all. I’ve always strived to “make a difference,” and hope this book will do so in some small way.
Pete comments: I thank Nicole Carlson, Mark Kim, and Rhonda Salz-man for spending Salz-many hours reading through chapters and making correc-tions and suggescorrec-tions, for no reason other than what you’re reading at this very moment. I’d also like to thank the people of the Linux Users Group of Davis who have answered my questions over the years. Knowing you has made me smarter.Todahgoes to Evelyn, who has improved my life in every way. Special mention goes out to Geordi (“J-Train” from San Francisco) who selflessly used his own feline body weight to make sure pages didn’t blow away, always kept my seat warm, and made sure the room was never empty. You are deeply missed each and every day. Purr on, little one. Hi, Mom! Look what I did!
1
S O M E P R E L I M I N A R I E S F O R
B E G I N N E R S A N D P R O S
Some people, especially professionals, may
be tempted to skip this chapter. We
sug-gest, though, that everyone at least skim through
it. Many professionals will find some material
that is new to them, and in any case it is important that
all readers be familiar with the material presented here,
which will be used throughout the remainder of the
book. Beginners should of course read this chapter
carefully.
In the first few sections of this chapter, we will present an overview of the debugging process and the role of debugging tools, and then walk through an extended example in Section1.7.
1.1 Debugging Tools Used in This Book
GDB
The most commonly used debugging tool among Unix programmers is GDB, the GNU Project Debugger developed by Richard Stallman, a prominent leader of the open source software movement, which played a key role in the development of Linux.
Most Linux sytems should have GDB preinstalled. If it is not, you must download the GCC compiler package.
DDD
Due to the more recent popularity of graphical user interfaces (GUIs), a number of GUI-based debuggers have been developed that run un-der Unix. Most of these are GUIfront endsto GDB: The user issues com-mands via the GUI, which in turn passes them on to GDB. One of these is DDD, the Data Display Debugger.
If your system does not already have DDD installed, you can down-load it. For instance, on Fedora Linux systems, the command
yum install ddd
will take care of the entire process for you. In Ubuntu Linux, a similar command,apt-get, can be used.
Eclipse
Some readers may use integrated development environments (IDEs). AnIDEis more than just a debugging tool; it integrates an editor, build tool, debugger, and other development aids into one package. In this book, our example IDE is the highly popular Eclipse system. As with DDD, Eclipse works on top of GDB or some other debugger.
You can install Eclipse viayumorapt-getas above, or simply down-load the.zipfile and unpack it in a suitable directory, say/usr/local.
In this book, we use Eclipse version 3.3.
1.2 Programming Language Focus
Our primary view in this book is toward C/C++ programming, and most of our examples will be in that context. However, in Chapter 8 we will discuss other languages.
1.3 The Principles of Debugging
Even though debugging is an art rather than a science, there are definite principles that guide its practice. We will discuss some of them in this section.
At least one of our rules, the Fundamental Principle of Confirmation, is rather formal in nature.
1.3.1 The Essence of Debugging: The Principle of Confirmation
The Fundamental Principle of Confirmation
Fixing a buggy program is a process of confirming, one by one, that the many things youbelieveto be true about the code actuallyaretrue. When you find that one of your assumptions isnottrue, you have found a clue to the location (if not the exact nature) of a bug.
Another way of saying this is:
Surprises are good!
When one of the things that you think is true about the program fails to confirm, you are surprised. But it’s a good surprise, because this discovery can lead you to the location of a bug.
1.3.2 Of What Value Is a Debugging Tool for the Principle of Confirmation?
The classic debugging technique is to simply addtrace codeto the program to print out values of variables as the program executes, usingprintf()or coutstatements, for example. You might ask, “Isn’t this enough? Why use a debugging tool like GDB, DDD, or Eclipse?”
First of all, this approach requires a constant cycle of strategically adding trace code, recompiling the program, running the program and analyzing the output of the trace code, removing the trace code after the bug is fixed, and repeating these steps for each new bug that is discovered. This is highly time consuming and fatigue making. Most importantly, these actions distract you from the real task and reduce your ability to focus on the reasoning pro-cess nepro-cessary to find the bug.
In contrast, with graphical debugging tools like DDD and Eclipse, all you have to do in order to examine the value of a variable is move the mouse pointer over an instance of that variable in the code display, and you are shown its current value. Why make yourself even wearier than necessary, for longer than necessary, during an all-night debugging session by doing this usingprintf()statements? Do yourself a favor and reduce the amount of time you have to spend and the tedium you need to endure by using a debugging tool.
You also get a lot more from a debugging tool than the ability to look at variables. In many situations, a debugger can tell you the approximate lo-cation of a bug. Suppose, for example, that your program bombs or crashes with asegmentation fault, that is, a memory access error. As you will see in our sample debugging session later in this chapter, GDB/DDD/Eclipse can im-mediately tell you the location of the seg fault, which is typically at or near the location of the bug.
1.3.3 Other Debugging Principles
Start small
At the beginning of the debugging process, you should run your pro-gram on easy, simple cases. This may not expose all of your bugs, but it is likely to uncover a few of them. If, for example, your code consists of a large loop, the easiest bugs to find are those that arise on the first or second iteration.
Use a top-down approach
You probably know about using atop-downormodularapproach to writ-ing code: Your main program should not be too long, and it should con-sist mostly of calls to functions that do substantial work. If one of those functions is lengthy, you should consider breaking it up, in turn, into smaller modules.
Not only should youwritecode in a top-down manner, you should
alsodebug code from the top down.
For example, suppose your program uses a functionf(). When you step through the code using a debugging tool and encounter a call to f(), the debugger will give you a choice as to where the next pause in ex-ecution will occur—either at the first line within the function about to be called or at the statement following the function call. In many cases, the latter is the better initial choice: You perform the call and then in-spect the values of variables that depend on the results of the call in or-der to see whether or not the function worked correctly. If so, then you will have avoided the time-consuming and needless effort of stepping through the code inside the function, which was not misbehaving (in this case).
Use a debugging tool to determine the location of a segmentation fault The very first step you take when a seg fault occurs should be to run your program within the debugger and reproduce the seg fault. The debugger will tell you the line of code at which the fault occurred. You can then get additional useful information by invoking the debugger’s
backtracefacility, which displays the sequence of function calls leading to
the invocation of the function in which the fault occurred.
In some cases it may be difficult to reproduce the seg fault, but if you have acore file, you can still do a backtrace to determine the situa-tion that produced the seg fault. This will be discussed in Chapter4. Determine the location of an infinite loop by issuing an interrupt
If you suspect your program has an infinite loop, enter the debugger and run your program again, letting it execute long enough to enter the loop. Then use the debugger’s interrupt command to suspend the pro-gram, and do a backtrace to see what point of the loop body has been reached and how the program got there. (The program has not been killed; you can resume execution if you wish.)
Use binary search
ascend-ing order, and you wish to determine where to insert a new number,y. Start by comparingytox[250]. Ifyturns out to be smaller than that ele-ment, you’d next compare it tox[125], but ifyis larger thanx[250], then the next comparison would instead be withx[375]. In the latter case, if yis smaller thanx[375], you then compare it tox[312], which is halfway betweenx[250]andx[375], and so on. You’d keep cutting your search space in half at each iteration, and so find the insertion point quickly. This principle can be applied while debugging too. Suppose you know that the value stored in a certain variable goes bad sometime dur-ing the first 1,000 iterations of a loop. One way that might help you track down the iteration where the value first goes bad is to use a
watch-point, an advanced technique that we will discuss in Section1.5.3.
An-other approach is to use binary search, in this case in time rather than in space. You’d first check the variable’s value at the 500th iteration; if it is still all right at that point, you’d next check the value at the 750th iteration, and so on.
As another example, suppose one of the source files in your pro-gram will not even compile. The line of code cited in the compiler mes-sage generated by a syntax error is sometimes far from the actual tion of the error, and so you may have trouble determining that loca-tion. Binary search can help here: You remove (or comment out) one half of the code in the compilation unit, recompile the remaining code, and see if the error message persists. If it does, then the error is in that second half; if the message does not appear, then the error is in the half that you deleted. Once you determine which half of the code contains the bug, you further confine the bug to half of that portion, and keep going until you locate the problem. Of course, you should make a copy of the original code before starting this process or, better yet, use your text editor’s undo feature. See Chapter7for tips on making good use of an editor while programming.
1.4 Text-Based vs. GUI-Based Debugging Tools, and a
Com-promise Between Them
The GUIs discussed in this book, DDD and Eclipse, serve as front ends to GDB for C and C++ and to other debuggers. While the GUIs have eye appeal and can be more convenient than the text-based GDB, our point of view in this book will be that text-based and GUI-based debuggers (including IDEs) are all useful, in different contexts.
1.4.1 Brief Comparison of Interfaces
1.4.1.1 GDB: Plain Text
To initiate a debugging session on this program with GDB, you would type
$ gdb insert_sort
at the Unix command line, after which GDB would invite you to submit com-mands by displaying its prompt:
(gdb)
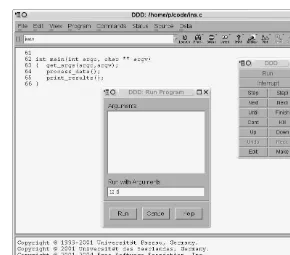
1.4.1.2 DDD: a GUI Debugging Tool
Using DDD, you would begin your debugging session by typing
$ ddd insert_sort
at the Unix command line. The DDD window would come up, after which you would submit commands through the GUI.
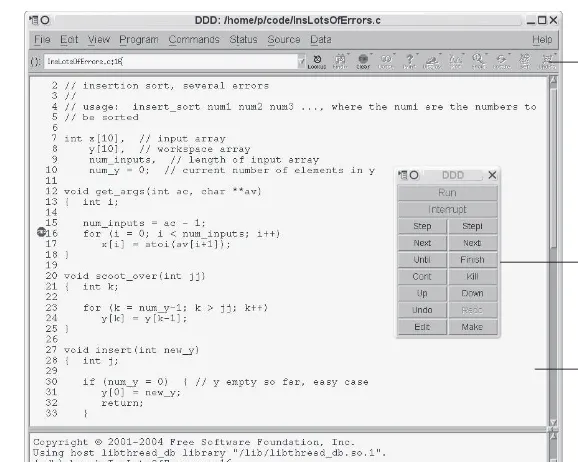
The typical appearance of a DDD window is shown in Figure1-1. As you see, the DDD window lays out information in various subwindows:
• The Source Text window displays your source code. DDD begins its dis-play at yourmain()function, but you can of course move to other parts of the source file by using the scroll bar at the right edge of the window. • The Menu Bar presents various menu categories, including File, Edit,
and View.
• The Command Tool lists the most common DDD commands (such as Run, Interrupt, Step, and Next), so that you can access them quickly. • The Console: Recall that DDD is simply a GUI front end to GDB (and
to other debuggers). DDD translates selections made with the mouse to the corresponding GDB commands. These commands and their output are displayed in the Console. In addition, you can submit commands to GDB directly via the Console, which is a handy feature because not all GDB commands have DDD counterparts.
• The Data window shows the values of variables that you have requested to be continuously displayed. This subwindow will not appear until you have made such a request, so it does not appear in this figure.
Here is a quick example of how a typical debugging command is sub-mitted to the debugger under each type of user interface. When debugging
insert_sort, you may wish to pause execution of the program—to set a
break-point—at line 16 (say) of the functionget_args(). (You will see the full source
code forinsert_sortin Section1.7.) To arrange this in GDB, you would type (gdb) break 16
Menu Bar
Command Tool
Source Text Window
Console
Figure 1-1: DDD layout
The full command name isbreak, but GDB allows abbreviations as long as there is no ambiguity, and most GDB users would typeb 16here. In order to facilitate understanding for those new to GDB, we will use full command names at first, and switch to abbreviations later in the book, after the com-mands have become more familiar.
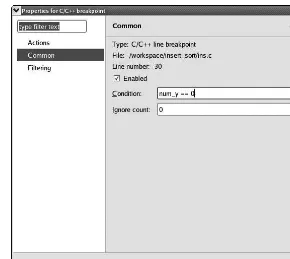
Using DDD, you would look at the Source Text window, click at the beginning of line 16, and then click the Break icon at the top of the DDD screen. You could also right-click at the beginning of the line, and then se-lect Set Breakpoint. Yet another option is to simply double-click the line of code, anywhere to the left of the start of the line. In any case, DDD would confirm the selection by displaying a little stop sign at that line, as shown in Figure1-2. In this way you can see your breakpoints at a glance.
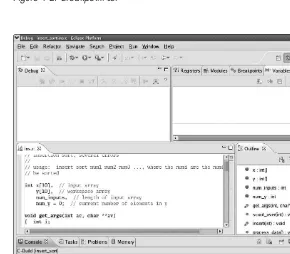
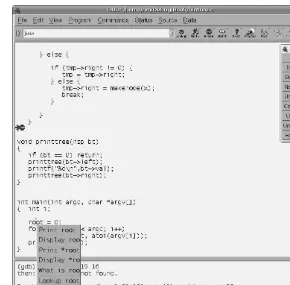
1.4.1.3 Eclipse: A GUI Debugger and Much More
Figure 1-2: Breakpoint set
The C/C++ perspective is part of the CDT plugin. Behind the scenes CDT invokes GDB, similar to the case of DDD.
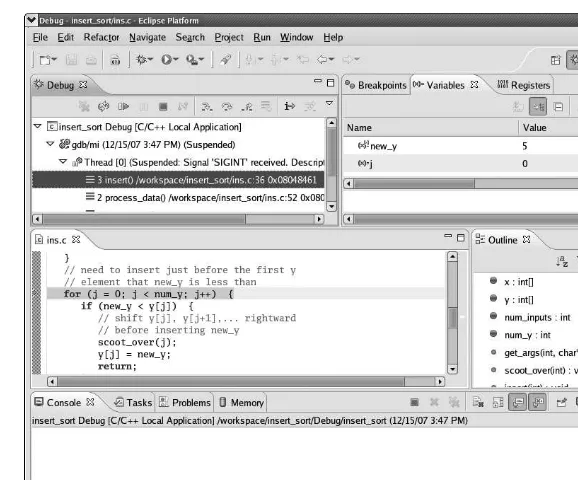
The details of that figure are generally similar to what we described for DDD above. A perspective is broken into tabbed windows calledviews. You can see a view for the source file,ins.c, on the left; there is the Variables view for inspecting the values of the variables (none so far in the picture); there is a Console view, whose function is quite similar to the subwindow in DDD of the same name; and so on.
You can set breakpoints and so on visually as in DDD. In Figure1-4, for example, the line
for (i = 0; i < num_inputs; i++)
in the source file window has a blue symbol in the left margin, symbolizing that there is a breakpoint there.
Figure 1-4: Removing a breakpoint in Eclipse
1.4.1.4 Eclipse vs. DDD
you are doing your editing and compiling for this project (not shown), the Outline view is at your disposal there too. This can be quite helpful in large projects.
Eclipse also better integrates the editing and compiling processes. If you have compilation errors, they are clearly marked within the editor. This can be done with the Vim editor, which both authors of this book tend to prefer over an IDE, but an IDE does it much better.
On the other hand, you can see that Eclipse, as with most IDEs, does have a major footprint on your screen (and indeed, on the pages of this book!). That Outline view is occupying precious space on the screen whether you use it much or not. Granted, you can hide the Outline by clicking the X in its right-hand corner (and if you want to get it back, select Window|Show Views|Outline), which reclaims some space, and you can also drag tabs to different locations within the Eclipse window. But in general, it may be diffi-cult to make good use of screen space in Eclipse.
Remember that you can always execute GDB commands directly in DDD’s Console. You thus have the flexibility to perform debugging commands in the most convenient way available, which is sometimes through the DDD in-terface and sometimes through the GDB command line. At various points in this book, you will see that there are a number of actions you can take with GDB that can make your debugging life much more convenient.
By contrast, GDB is mostly transparent to Eclipse users, and while the old saying “Ignorance is bliss” may often apply, the transparency means you lose easy access to the labor-saving actions made possible by direct usage of GDB. As of this writing, a determined user can still directly access GDB by clicking the GDB thread in Debug and then using the Console, though mi-nus the GDB prompts. However, this “undocumented feature” may not sur-vive in future versions.
1.4.1.5 Advantages of the GUIs
The GUI interfaces provided by DDD and Eclipse are more visually appeal-ing than that of GDB. They also tend to be more convenient. For instance, suppose that you no longer want execution to pause at line 16 ofget_args(), that is, you wish toclear the breakpoint. In GDB you would clear the break-point by typing
(gdb) clear 16
However, in order to do this, you need to remember the line number of the breakpoint—not an easy task if you have many breakpoints active at once. You could refresh your memory by using GDB’sinfo break com-mand to get a list of all the breakpoints, but it would still be a bit of work and would distract from the focus on finding the bug.
In Eclipse, you would go to the Breakpoints view, highlight the break-point(s) you want to remove, and then move the mouse cursor to the gray X, which symbolizes the Remove Selected Breakpoints operation (see Fig-ure1-4). Alternatively, you can right-click the blue breakpoint symbol in the source code window and select Toggle Breakpoint.
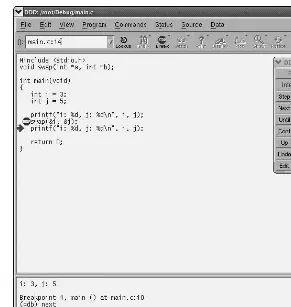
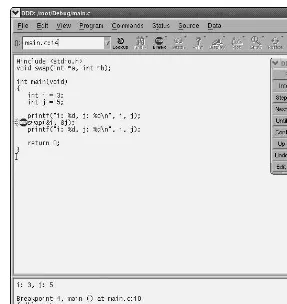
One task for which the GUIs are clear winners is stepping through code. It is much easier and more pleasant to do this using DDD or Eclipse rather than GDB, because you can watch your movement through the code in the GUI’s source code window. The next line in your source code to be exe-cuted is indicated by an arrow, as shown for DDD in Figure1-5. In Eclipse, your next line is highlighted in green. You can thus tell at a glance where you are relative to other program statements of interest.
1.4.1.6 Advantages of GDB
So, the GUIs have many advantages over the text-based GDB. Yet a sweeping conclusion based on this example that the GUIs are better than GDB would be unjustified.
Younger programmers who have grown up using GUIs for everything they do online naturally prefer GUIs to GDB, as do many of their older col-leagues. On the other hand, GDB has some definite advantages, too:
• GDB starts up more quickly than DDD, a big advantage when you just need to quickly check something in your code. The difference in startup times is even greater in the case of Eclipse.
• In some cases, debugging is performed remotely via an SSH (or a tel-net) connection, say from a public terminal. If you lack an X11 setup, the GUIs cannot be used at all, and even with X11, the screen refresh operations of the GUIs may be slow.
• When debugging several programs that work in cooperation with each other—for example, a client/server pair in a networked environment— you need a separate debugging window for each program. It is a little better in Eclipse than in DDD, as Eclipse will allow you to debug two programs simultaneously in the same window, but this does compound the space problems cited earlier. Thus the small visual footprint that GDB occupies on the screen compared to the GUI’s larger footprint is a big advantage.
• If the program you are debugging has a GUI, and you use a GUI-based debugger such as DDD, they can clash. The GUIevents—keystrokes, mouse clicks, and mouse movements—of one can interfere with those of the other, and the program may behave differently when run under the debugger than it does when run independently. This can seriously complicate finding bugs.
short abbreviations, and most people use these instead of the full forms. Also, theCTRL-P andCTRL-N key combinations allow you to scroll through previous commands and edit them if you wish. Simply hitting theENTERkey repeats the last command issued (which is very useful when repeatedly per-forming thenextcommand to step through code one line at a time), and there is adefinecommand that allows the user to define abbreviations and macros. Details of these features will be presented in Chapters2and3.
1.4.1.7 The Bottom Line: Each Has Its Value
We consider both GDB and the GUIs to be important tools, and this book will present examples of GDB, DDD, and Eclipse. We will always begin treat-ment of any particular topic with GDB, as it is the commonality among these tools, then show how the material extends to the GUIs.
1.4.2 Compromises
Since version 6.1, GDB has offered a compromise between text-based and graphical user interaction in the form of a mode named TUI (Terminal User Interface). In this mode, GDB splits the terminal screen into analogs of DDD’s Source Text window and Console; you can follow the progress of your program’s execution in the former while issuing GDB commands in the latter. Alternatively, you can use another program, CGDB, which offers similar functionality.
1.4.2.1 GDB in TUI Mode
To run GDB in TUI mode, you can either specify the option-tuion the command line when invoking GDB or typeCTRL-X-A from within GDB while in non-TUI mode. The latter command also toggles you out of TUI mode if you are currently in it.
In TUI mode, the GDB window is divided into two subwindows—one for GDB commands and one for viewing source code. Suppose you start GDB in TUI mode oninsert_sortand then execute a couple of debugging com-mands. Your GDB screen may then look like this:
11
12 void get_args(int ac, char **av)
File: ins.c Procedure: get_args Line: 17 pc: 0x80484b8 ---(gdb) break 16
Breakpoint 1 at 0x804849f: file ins.c, line 16. (gdb) run 12 5 6
Starting program: /debug/insert_sort 12 5 6
Breakpoint 1, get_args (ac=4, av=0xbffff094) at ins.c:16 (gdb) next
(gdb)
The lower subwindow shows exactly what you would see if you were us-ing GDB without TUI. Here, this subwindow shows the followus-ing thus-ings:
• We issued abreakcommand to set a breakpoint at line 16 in the current source file.
• We executedrunto run the program, passing it the command-line ar-guments 12, 5, and 6, after which the debugger stopped execution at the specified breakpoint. (runand the other GDB commands will be explained later.) GDB reminds us that the breakpoint is at line 16 of
ins.cand informs us that the machine code for that source line resides at
memory address0x804849f.
• We issued anextcommand to step to the next line of code, line 17.
The upper subwindow offers some extra, visually helpful information. Here TUI shows us the source code surrounding the line currently being executed, just as DDD and Eclipse would. This makes it much easier to see where we are in the code. The breakpoint and the line currently being exe-cuted are indicated with an asterisk and a>sign, respectively, analogous to
DDD’s stop sign and green arrow icons.
We can move to other parts of the code by using the up and down arrow keys to scroll. When not in TUI mode, you can use the arrow keys to scroll through previous GDB commands, in order to modify or repeat them. In TUI mode, the arrow keys are for scrolling the source code subwindow, and you scroll through previous GDB commands by usingCTRL-P andCTRL-N. Also, in TUI mode, the region of code displayed in the source code subwin-dow can be changed using GDB’slistcommand. This is especially useful when working with multiple source files.
By making use of GDB’s TUI mode and its typing shortcuts, we can at-tain a lot of the GUIs’ extra functionality without incurring the GUIs’ disad-vantages. Note, however, that in some circumstances TUI may not behave quite as you want it to, in which case you will need to find a workaround.
1.4.2.2 CGDB
Another interface to GDB that you may wish to consider is CGDB, available
text-based and a GUI approach. Like the GUIs, it serves as a front end to GDB. It’s similar to the terminal-based TUI concept, but with the additional en-ticements that it is in color and you can browse through the source code sub-window and set breakpoints directly there. It also seems to handle screen refresh better than GDB/TUI does.
Here are a few of CGDB’s basic commands and conventions:
• HitESCto go from the command window to the source code window; hit i to get back.
• While in the source window, move around by using the arrow keys or vi-like keys (j for down, k for up, / to search).
• The next line to be executed is marked by an arrow.
• To set a breakpoint at the line currently highlighted by the cursor, just hit the spacebar.
• Breakpoint lines have their line numbers highlighted in red.
1.5 Main Debugger Operations
Here we give an overview of the main types of operations that a debugger offers.
1.5.1 Stepping Through the Source Code
You saw earlier that to run a program in GDB, you use theruncommand, and that in DDD you click Run. In details to be presented later, you will see that Eclipse handles things similarly.
You can also arrange for execution of the program to pause at certain points, so that you can inspect the values of variables in order to get clues about where your bug is. Here are some of the methods you can use to do this:
Breakpoints
As mentioned earlier, a debugging tool will pause execution of your pro-gram at specified breakpoints. This is done in GDB via thebreak com-mand, together with the line number; in DDD you right-click anywhere in white space in the relevant line and choose Set Breakpoint; in Eclipse you double-click in the margin to the left of the line.
Single-stepping
Resume operation
In GDB, thecontinuecommand tells the debugger to resume execution and continue until a breakpoint is hit. There is a corresponding menu item in DDD, and Eclipse has a Resume icon for it.
Temporary breakpoints
In GDB thetbreakcommand is similar tobreak, but it sets a breakpoint that only stays in effect until the first time the specified line is reached. In DDD this is accomplished by right-clicking anywhere in the white space in the desired line in the Source Text window, and then select-ing Set Temporary Breakpoint. In Eclipse, highlight the desired line in the source window, then right-click and select Run to Line.
GDB also hasuntilandfinishcommands, which create special kinds of one-time breakpoints. DDD has corresponding Until and Finish menu items in its Command window, and Eclipse has Step Return. These are discussed in Chapter2.
A typical debugging pattern for program execution is as follows (us-ing GDB as an example): After you hit a breakpoint, you move through the code one line at a time orsingle-stepfor a while, via GDB’snextandstep com-mands. This allows you to carefully examine the program’s state and behav-ior near the breakpoint. When you are done with this, you can tell the de-bugger to continue to execute the program without pausing until the next breakpoint is reached, by using thecontinuecommand.
1.5.2 Inspecting Variables
After the debugger pauses execution of our program, you can issue com-mands to display the values of program variables. These could be local vari-ables, globals, elements of arrays and Cstructs, member variables in C++ classes, and so on. If a variable is found to have an unexpected value, that typically is a big clue to the location and nature of a bug. DDD can even graph arrays, which may reveal, at a glance, suspicious values or trends oc-curring within an array.
The most basic type of variable display is simply printing the current value. For example, suppose you have set a breakpoint at line 37 of the func-tioninsert()inins.c. (Again, the full source code is given in Section1.7, but the details needn’t concern you for now.) When you reach that line, you can check the value of the local variablejin that function. In GDB you would use theprintcommand:
(gdb) print j
Figure 1-5: Inspecting a variable in DDD
As you will see in Chapter2, in GDB or DDD you can also arrange to continuously display a variable so that you don’t have to repeatedly ask to see the value. DDD has an especially nice feature for displaying linked lists, trees, and other data structures containing pointers: You can click an outgo-ing link of any node in such a structure to find the next node.
1.5.3 Issuing an “All Points Bulletin” for Changes to a Variable
Awatchpointcombines the notions of breakpoint and variable inspection.
The most basic form instructs the debugger to pause execution of the pro-gram whenever the value of a specified variable changes.
For example, suppose that you wish to examine a program’s state dur-ing the points in the course of its execution at which the variablezchanges value. In GDB, you can issue the command
(gdb) watch z
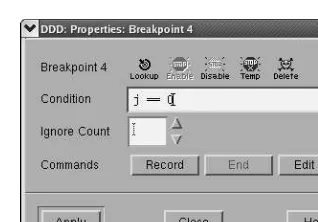
When you run the program, GDB will pause execution whenever the value ofzchanges. In DDD, you would set the watchpoint by clicking any instance ofzin the Source Text window and then clicking the Watch icon at the top of the DDD window.
Even better, you can set watchpoints based on conditional expressions. Say, for example, that you wish to find the first point in the execution of the program at which the value ofzexceeds 28. You can accomplish this by set-ting a watchpoint based on the expression(z > 28). In GDB, you would type
(gdb) watch (z > 28)
In DDD, you would issue this command in DDD’s Console. Recall that in C the expression(z > 28)is of Boolean type and evaluates to eithertrueor
false, wherefalseis represented by 0 andtrueis represented by any nonzero
integer, usually 1. Whenzfirst takes on a value larger than 28, the value of the expression(z > 28)will change from 0 to 1, and GDB will pause execu-tion of the program.
You can set a watchpoint in Eclipse by right-clicking in the source win-dow, selecting Add a Watch Expression, and then filling in the desired ex-pression in the dialog.
Watchpoints are usually not as useful for local variables as they are for variables with wider scope, because a watchpoint set on a local variable is canceled as soon as the variable goes out of scope, that is, when the func-tion in which the variable is defined terminates. However, local variables in main()are an obvious exception, as such variables are not deallocated until the program finishes execution.
1.5.4 Moving Up and Down the Call Stack
of the function’s local variables and its parameters and a record of the loca-tion from which the funcloca-tion was called. Each time a funcloca-tion call occurs, a new frame is created and pushed onto a stack maintained by the system; the frame at the top of the stack represents the currently executing function, and it is popped off the stack and deallocated when the function exits.
For example, suppose that you pause execution of your sample pro-gram,insert_sort, while in theinsert()function. The data in the current stack frame will state that you got there via a function call at a specific lo-cation that turns out to be within theprocess_data()function (which invokes insert()). The frame will also store the current value ofinsert()’s only local variable, which you will see later isj.
The stack frames for the other active function invocations will contain similar information, and you can also examine these if you wish. For in-stance, even though execution currently resides ininsert(), you may wish to take a look at the previous frame in the call stack, that is, atprocess_data()’s frame. You can do so in GDB with the command
(gdb) frame 1
When issuing GDB’sframecommand, the frame of the currently execut-ing function is numbered 0, its parent frame (that is, the stack frame of the function’s caller) is numbered 1, the parent’s parent is numbered 2, and so on. GDB’supcommand takes you to the next parent in the call stack (for ex-ample, to frame 1 from frame 0), anddowntakes you in the other direction. Such operations are very useful, because the values of the local variables in some of the earlier stack frames may give you a clue as to what caused a bug.
Traversing the call stack does not change the execution path—in this example, the next line ofinsert_sortto be executed will still be the current one ininsert()—but it does allow you to take a look at the ancestor frames and so examine the values of the local variables for the function invocations leading up to the current one. Again, this may give you hints about where to find a bug.
GDB’sbacktracecommand will show you the entire stack, that is, the en-tire collection of frames currently in existence.
The analogous operation in DDD is invoked by clicking Status| Back-trace; a window will pop up showing all the frames, and you can then click whichever one you wish to inspect. The DDD interface also has Up and Down buttons that can be clicked to invoke GDB’supanddowncommands.
Figure 1-7: Moving within the stack in Eclipse
1.6 Online Help
In GDB, documentation can be accessed through thehelpcommand. For example,
(gdb) help breakpoints
will give you the documentation on breakpoints. The GDB commandhelp, with no arguments, gives you a menu of command categories that can be used as arguments forhelp.
In DDD and Eclipse, a wealth of material is available by clicking Help.
1.7 Introductory Debugging Session
Now we will present a complete debugging session. As mentioned, the sam-ple program is in the source fileins.cand does an insertion sort. This is not an efficient sorting method, of course, but the simplicity of the code makes it good for illustrating the debugging operations. Here is the code:
//
// insertion sort, several errors //
int x[10], // input array y[10], // workspace array
num_inputs, // length of input array
num_y = 0; // current number of elements in y
void get_args(int ac, char **av) { int i;
num_inputs = ac - 1;
for (i = 0; i < num_inputs; i++) x[i] = atoi(av[i+1]);
}
void scoot_over(int jj) { int k;
for (k = num_y-1; k > jj; k++) y[k] = y[k-1];
}
void insert(int new_y) { int j;
if (num_y = 0) { // y empty so far, easy case y[0] = new_y;
return; }
// need to insert just before the first y // element that new_y is less than for (j = 0; j < num_y; j++) {
if (new_y < y[j]) {
// shift y[j], y[j+1],... rightward // before inserting new_y
scoot_over(j); y[j] = new_y; return; }
} }
void process_data() {
}
void print_results() { int i;
for (i = 0; i < num_inputs; i++) printf("%d\n",y[i]);
}
int main(int argc, char ** argv) { get_args(argc,argv);
process_data(); print_results(); }
Below is a pseudocode description of the program. The function calls are indicated bycallstatements, and the pseudocode for each function is shown indented under the calls:
call main():
set y array to empty call get_args():
get num_inputs numbers x[i] from command line call process_data():
for i = 1 to num_inputs call insert(x[i]):
new_y = x[i]
find first y[j] for which new_y < y[j] call scoot_over(j):
shift y[j], y[j+1], ... to right, to make room for new_y set y[j] = new_y
Let’s compile and run the code:
$ gcc -g -Wall -o insert_sort ins.c
Important: You can use the-goption to GCC to tell the compiler to save
thesymbol table—that is, the list of memory addresses corresponding to your
program’s variables and lines of code—within the generated executable file, which here isinsert_sort. This is an absolutely essential step that allows you to refer to the variable names and line numbers in the source code during a debugging session. Without this step (and something similar would have to be done if you were to use a compiler other than GCC), you could not ask the debugger to “stop at line 30” or “print the value ofx,” for example.
$ insert_sort 12 5
(execution halted by user hitting ctrl-C)
The program did not terminate or print any output. It apparently went into an infinite loop, and we had to kill it by hittingCTRL-C. There is no doubt about it: Something is wrong.
In the following sections, we will first present a debugging session for this buggy program using GDB, and then discuss how the same operations are done using DDD and Eclipse.
1.7.1 The GDB Approach
To track down the first bug, execute the program in GDB and let it run for a while before suspending it withCTRL-C. Then see where you are. In this manner, you can determine the location of the infinite loop.
First, start the GDB debugger oninsert_sort: $ gdb insert_sort -tui
Your screen will now look like this:
63 { get_args(argc,argv);
64 process_data();
65 print_results();
66 }
67 68 69
File: ins.c Procedure: ?? Line: ?? pc: ??
---(gdb)
The top subwindow displays part of your source code, and in the bottom subwindow you see the GDB prompt, ready for your commands. There is also a GDB welcome message, which we have omitted for the sake of brevity.
If you do not request TUI mode when invoking GDB, you would receive only the welcome message and the GDB prompt, without the upper subwin-dow for your program’s source code. You could then enter TUI mode using the GDB commandCTRL-X-A. This command toggles you in and out of TUI mode and is useful if you wish, for example, to temporarily leave TUI mode so that you can read GDB’s online help more conveniently, or so that you can see more of your GDB command history together on one screen.
46
47 void process_data() 48 {
49 for (num_y = 0; num_y < num_inputs; num_y++) 50 // insert new y in the proper place
51 // among y[0],...,y[num_y-1]
File: ins.c Procedure: process_data Line: 52 pc: 0x8048483
---(gdb) run 12 5
Starting program: /debug/insert_sort 12 5
Program received signal SIGINT, Interrupt. 0x08048483 in process_data () at ins.c:52 (gdb)
This tells you that when you stopped the program,insert_sortwas in the functionprocess_data()and line 52 in the source fileins.cwas about to be executed.
We hitCTRL-C at a random time and stopped at a random place in the code. Sometimes it’s good to suspend and restart a program that has stopped responding two or three times by issuingcontinuebetweenCTRL-Cs, in order to see where you stop each time.
Now, line 52 is part of the loop that begins on line 49. Is this loop the infinite one? The loop doesn’t look like it should run indefinitely, but the Principle of Confirmation says you should verify this, not just assume it. If the loop is not terminating because somehow you haven’t set the upper bound for the variablenum_ycorrectly, then after the program has run for a while the value ofnum_ywill be huge. Is it? (Again, it looks like it shouldn’t be, but you need to confirm that.) Let’s check what the current value of num_yis by asking GDB to print it out.
(gdb) print num_y $1 = 1
chapters.) So we seem to be on only the second iteration of the loop on line 49. If this loop were the infinite one, it would be way past its second it-eration by now.
So let’s take a closer look at what occurs whennum_yis 1. Tell GDB to stop ininsert()during the second iteration of the loop on line 49 so that you can take a look around and try to find out what’s going wrong at that place and time in the program:
(gdb) break 30
Breakpoint 1 at 0x80483fc: file ins.c, line 30. (gdb) condition 1 num_y==1
The first command places a breakpoint at line 30, that is, at the begin-ning ofinsert(). Alternatively, you could have specified this breakpoint via the commandbreak insert, meaning to break at the first line ofinsert() (which here is line 30). This latter form has an advantage: If you modify the program code so that the functioninsert()no longer begins at line 30
ofins.c, your breakpoint would remain valid if specified using the function
name, but not if specified using the line number.
Ordinarily abreakcommand makes execution pauseeverytime the pro-gram hits the specified line. However, the second command here,condition 1 num_y==1, makes that breakpointconditional: GDB will pause execution of the program at breakpoint 1 only when the conditionnum_y==1holds.
Note that unlike thebreakcommand, which accepts line numbers (or function names),conditionaccepts a breakpoint number. You can always use the commandinfo breakto look up the number of the desired breakpoint. (That command gives you other useful information too, such as the number of times each breakpoint has been hit so far.)
We could have combined thebreakandconditioncommands into a sin-gle step by usingbreak ifas follows:
(gdb) break 30 if num_y==1
Then run the program again, using theruncommand. You do not have to restate the command-line arguments if you just wish to reuse the old ones. This is the case here, and so you can simply typerun. Since the program is already running, GDB asks us if you wish to restart from the beginning, and you answer “yes.”
The screen will now look like this:
32 return;
33 }
34 // need to insert just before the first y 35 // element that new_y is less than 36 for (j = 0; j < num_y; j++) {
37 if (new_y < y[j]) {
38 // shift y[j], y[j+1],... rightward .
File: ins.c Procedure: insert Line: 30 pc: 0x80483fc
---(gdb) condition 1 num_y==1
(gdb) run
The program being debugged has been started already. Start it from the beginning? (y or n)
Starting program: /debug/insert_sort 12 5
Breakpoint 1, insert (new_y=5) at ins.c:30 (gdb)
We apply the Principle of Confirmation again: Sincenum_yis 1, line 31 should be skipped over and execution should go to line 36. But we need to
confirmthis, so we issue thenextcommand to go on to the next line:
24 y[k] = y[k-1];
34 // need to insert just before the first y 35 // element that new_y is less than > 36 for (j = 0; j < num_y; j++) {
37 if (new_y < y[j]) {
38 // shift y[j], y[j+1],... rightward .
File: ins.c Procedure: insert Line: 36 pc: 0x8048406
---(gdb) run
The program being debugged has been started already. Start it from the beginning? (y or n)
Starting program: /debug/insert_sort 12 5
Breakpoint 1, insert (new_y=5) at ins.c:30 (gdb) next
The arrow in the upper subwindow is now at line 36, so our expecta-tion is confirmed; we did indeed skip line 31. Now let’s continue to single-step through the program, confirming assumptions about the code along the way. You are now at the beginning of a loop, so issue thenextcommand again a few times and see how the loop progresses, line by line:
39 // before inserting new_y
40 scoot_over(j);
49 for (num_y = 0; num_y < num_inputs; num_y++) 50 // insert new y in the proper place
51 // among y[0],...,y[num_y-1]
52 insert(x[num_y]);
53 } .
File: ins.c Procedure: insert Line: 45 pc: 0x804844d
---The program being debugged has been started already.
Start it from the beginning? (y or n) Starting program: /debug/insert_sort 12 5
Breakpoint 1, insert (new_y=5) at ins.c:30 (gdb) next
(gdb) next (gdb)
Look at where the arrow is now in the upper subwindow—we went di-rectly from line 37 to line 45! This is quite a surprise. We did not execute even one iteration of the loop. Remember, though, that surprises are good, because they give you clues as to where bugs are.
The only way that the loop at line 36 could have executed no iterations at all is if the conditionj < num_yin line 36 did not hold even whenjwas 0. Yet you know thatnum_yis 1, because you are in this function now after having imposed the conditionnum_y==1on the breakpoint. Or at least you
thinkyou know this. Again, you haven’t confirmed it. Check this now:
(gdb) print num_y $2 = 0
As mentioned earlier, the Principle of Confirmation doesn’t tell you
whatthe bug is, but it does give us clues towherethe bug likely resides. In this case, you have now discovered that the location is somewhere between lines 30 and 36. And you can narrow down that range further, because you saw that lines 31 through 33 were skipped, and lines 34 through 35 are com-ments. In other words, the mysterious change of value innum_yoccurred ei-ther at line 30 or at line 36.
After taking a short break—often the best debugging strategy!—we sud-denly realize that the fault is a classic error, often made by beginning (and, embarrassingly, by experienced) C programmers: In line 30 we used= in-stead of==, turning a test for equality into an assignment.
Do you see how the infinite loop thus arises? The error on line 30 sets up a perpetual seesaw situation, in which thenum_y++portion of line 49 re-peatedly incrementsnum_yfrom 0 to 1, while the error in line 30 repeatedly sets that variable’s value back to 0.
So we fix that humiliating bug (which onesaren’thumiliating?), recom-pile, and try running the program again:
$ insert_sort 12 5 5
0
We don’t have an infinite loop anymore, but we don’t have the correct output either.
Recall from the pseudocode what your program is supposed to do here: Initially the arrayyis empty. The first iteration of the loop at line 49 is supposed to put the 12 intoy[0]. Then in the second iteration, the 12 is supposed to be shifted by one array position, to make room for insertion of the 5. Instead, the 5 appears to have replaced the 12.
The trouble arises with the second number (5), so you should again focus on the second iteration. Because we wisely chose to stay in the GDB session, rather than exiting GDB after discovering and fixing the first bug, the breakpoint and its condition, which we set earlier, are still in effect now. Thus we simply run the program again, and stop when the program begins to process the second input:
24 y[k] = y[k-1];
36 for (j = 0; j < num_y; j++) {
37 if (new_y < y[j]) {
38 // shift y[j], y[j+1],... rightward .
File: ins.c Procedure: insert Line: 30 pc: 0x80483fc
---The program being debugged has been started already.
Start it from the beginning? (y or n)
`/debug/insert_sort' has changed; re-reading symbols. Starting program: /debug/insert_sort 12 5
Breakpoint 1, insert (new_y=5) at ins.c:30 (gdb)
Notice the line that announces
`/debug/insert_sort' has changed; re-reading symbols.
This shows that GDB saw that we recompiled the program and automat-ically reloaded the new binary and the new symbol table before running the program.
Again, the fact that we did not have to exit GDB before recompiling our program is a major convenience, for a few reasons. First, you do not need to restate your command-line arguments; you just typerunto re-run the pro-gram. Second, GDB retains the breakpoint that you had set, so that you don’t need to type it again. Here you only have one breakpoint, but typically you would have several, and then this becomes a real issue. These conve-niences save you typing, and more importantly they relieve you of practical distractions and allow you to focus better on the actual debugging.
Likewise, you should not keep exiting and restarting your text editor during your debugging session, which would also be a distraction and a waste of time. Just keep your text editor open in one window and GDB (or DDD) in another, and use a third window for trying out your program.
Now let’s try stepping through the code again. As before, the program should skip line 31, but hopefully this time it will reach line 37, as opposed to the situation earlier. Let’s check this by issuing thenextcommand twice:
31 y[0] = new_y;
32 return;
33 }
34 // need to insert just before the first y 35 // element that new_y is less than 36 for (j = 0; j < num_y; j++) { > 37 if (new_y < y[j]) {
38 // shift y[j], y[j+1],... rightward
39 // before inserting new_y
40 scoot_over(j);
42 return;
43 }
44 }
45 } .
File: ins.c Procedure: insert Line: 37 pc: 0x8048423
---`/debug/insert_sort' has changed; re-reading symbols.
Starting program: /debug/insert_sort 12 5
Breakpoint 1, insert (new_y=5) at ins.c:30 (gdb) next
(gdb) next (gdb)
We have indeed reached line 37.
At this point, we believe the condition in theifin line 37 should hold, becausenew_yshould be 5, andy[0]should be 12 from the first iteration. The GDB output confirms the former assumption. Let’s check the latter:
(gdb) print y[0] $3 = 12
Now that this assumption is also confirmed, issue thenextcommand, which brings you to line 40. The functionscoot_over()is supposed to shift the 12 to the next array position, to make room for the 5. You should check to see whether or not it does. Here you face an important choice. You could issue thenextcommand again, which would cause GDB to stop at line 41; the functionscoot_over()would be executed,but GDB would not stop within
that function. However, if you were to issue thestepcommand instead, GDB
would stop at line 23, and this would allow you to single-step withinscoot_over(). Following the Top-Down Approach to Debugging described in
Sec-tion1.3.3, we opt for thenextcommand instead ofstepat line 40. When GDB stops at line 41, you can take a look atyto see if the function did its job correctly. If that hypothesis is confirmed, you will have avoided a time-consuming inspection of the detailed operation of the functionscoot_over() that would have contributed nothing to fixing the current bug. If you fail to confirm that the function worked correctly, you can run the program in the debugger again and enter the function usingstepin order to inspect the function’s detailed operation and hopefully determine where it goes awry.
So, when you reach line 40, typenext, yielding
31 y[0] = new_y;
32 return;
33 }
34 // need to insert just before the first y 35 // element that new_y is less than 36 for (j = 0; j < num_y; j++) {
38 // shift y[j], y[j+1],... rightward
39 // before inserting new_y
40 scoot_over(j);
File: ins.c Procedure: insert Line: 41 pc: 0x8048440
---(gdb) next
(gdb) next (gdb)
Didscoot_over()shift the 12 correctly? Let’s check:
(gdb) print y
$4 = {12, 0, 0, 0, 0, 0, 0, 0, 0, 0}
Apparently not. The problem indeed lies inscoot_over(). Let’s delete the breakpoint at the beginning ofinsert()and place one inscoot_over(), again with a condition that we stop there during the second iteration of line 49:
(gdb) clear 30 Deleted breakpoint 1 (gdb) break 23
Breakpoint 2 at 0x80483c3: file ins.c, line 23. (gdb) condition 2 num_y==1
Now run the program again:
15 num_inputs = ac - 1;
---(gdb) condition 2 num_y==1
(gdb) run
The program being debugged has been started already. Start it from the beginning? (y or n)
Starting program: /debug/insert_sort 12 5
Breakpoint 2, scoot_over (jj=0) at ins.c:23 (gdb)
Once again, follow the Principle of Confirmation: Think about what you expect to occur, and then try to confirm that it does occur. In this case, the function is supposed to shift the 12 over to the next position in the ar-rayy, which means that the loop at line 23 should go through exactly one iteration. Let’s step through the program by repeatedly issuing thenext com-mand, in order to verify this expectation:
15 num_inputs = ac - 1;
File: ins.c Procedure: scoot_over Line: 25 pc: 0x80483f1 ---The program being debugged has been started already.
Start it from the beginning? (y or n) Starting program: /debug/insert_sort 12 5
Breakpoint 2, scoot_over (jj=0) at ins.c:23 (gdb) next
(gdb) next (gdb)
As with the earlier loop that unexpectedly executed no iterations of its body, it must be that the loop condition was not satisfied at the very begin-ning of the loop. Is this the case here? The loop condition on line 23 isk > jj. We also know from this line thatk’s initial value isnum_y-1, and we know from our breakpoint condition that the latter quantity is 0. Finally, the GDB screen tells us thatjjis 0. So the conditionk > jjwas not satisfied when the the loop began.
Thus, we misspecified either the loop conditionk > jjor the initial-izationk = num_y-1. Considering that the 12 should have moved fromy[0] toy[1]in the first and only iteration of the loop—that is, line 24 should have executed withk = 1—we realize that the loop initialization is wrong. It should have beenk = num_y.
Fix the error, recompile the program, and run the program again (out-side GDB):
$ insert_sort 12 5 Segmentation fault
Segmentation faults, discussed in detail in Chapter4, occur when a
run-ning program attempts to access memory that it does not have permission to access. Typically the cause is an out-of-bounds array index or an errant pointer value. Seg faults can also arise from memory references that do not explicitly involve pointer or array variables. One example of this can be seen in another classic C programmer’s error, forgetting the ampersand in a function parameter that is passed using call-by-reference, for example, writing
scanf("%d",x);
instead of
scanf("%d",&x);
In general, the main value of a debugging tool such as GDB or DDD is to facilitate the process of verifying one’s coding assumptions, but in the case of seg faults a debugging tool gives extra, tangible, immediate help: It tells you where in your program the fault occurred.
To take advantage of this, you need to runinsert_sortin GDB and recre-ate the seg fault. First, remove your breakpoint. As seen earlier, to do this you need to give the line number of the breakpoint. You might already re-member this, but it is easy to look for it: Either scroll through the TUI win-dow (using the up and win-down arrow keys), looking for lines marked with as-terisks, or use GDB’sinfo breakcommand. Then delete the breakpoint using theclearcommand:
(gdb) clear 30