The Benefit of Wind Distribution Analysis for
Coastal Construction Design in East Java
Province
Surya Hermawan1,*, Joko Purnomo2 , and Daniel Tjandra3
1,2,3 Civil Engineering Department, Petra Christian University, Siwalankerto 121-131 Surabaya,
Indonesia
Abstract. To create a safe and durable coastal structures design, a comprehensive data including minimum, maximum, and significant sea wave’s height are needed. Normally, to obtain such massive data, engineers need to elaborate specialized consultant to carry out direct measurement on site, which typically consumes enormous financial resources and involves exceptionally rare experts. In such case, engineers can use a set of 10 to 20 years’ wind data as a substitution. The suggested duration is expected to ensure that the set of data has sufficient information, which includes extreme wind speed and its fluctuation along the respective years. Therefore, it is common to adopt available data at the nearest wind stations, such as airports and harbors, to estimate the wind features on site. This paper presents a normative wind speed distribution model based on 16 years’ wind data at a location obtained from National Oceanic and Atmospheric U.S. Department of Commerce (NOAA). The outcomes of the research show that the maximum sea wave height prediction in Sidoarjo Regency East Java with respect to analytical and graphical method are 0,465 m and 0,840 m, respectively. The results are considered satisfactorily reliable to be used as primary data to design coastal structures.
1 Introduction
To create a safe and durable coastal structures design, a comprehensive data of sea waves is needed. However, particularly in Indonesia, such data is rarely being well recorded because it consumes enormous time to collect and spends expensive cost. As an alternative method, wind data consisting wind speed, direction, and duration as well as fetch length can be used to estimate sea wave’s height.
It is common for local engineers to address for natural phenomenon—which cannot be easily predicted, due to ineffective and inefficient design of coastal structures in Indonesia. Such problem can be avoided if reliable design data exists. Currently in Indonesia, a
well-calibrated data of sea waves’ height is very limited. It, if available, usually covers only one -month or one-year period at max. This also extends similar problems when identical data for new sites are needed.
This paper presents a normative wind speed distribution model based on 16 years’ wind data at a locations of research study: Sidoarjo Regency in the surrounding area near Surabaya.
The data are obtained from National Oceanic and Atmospheric U.S. Department of Commerce (NOAA) [1] to fill the gap between design and construction phase. The data will include a one to six hours-based wind speed measurement from 2000-2006 [2–4]. The data will be rigorously analyzed to further be used as a normative data to estimate sea waves height for designing a safe and durable coastal structures in East Java, Indonesia [5, 6].
2 Study literature
2.1 Fundamental theory of sea wave formation
Sea waves can be mainly generated by five factors, i.e. wind, moon-sun gravitational force interactions, eruption of volcanos, earthquakes, and any physical disturbance in the surrounding area [7]. Wind flowing over the ocean causes normal and tangential stresses, through which wind energy is dissipated to ocean surface. As a result, water particles move in the same direction as wind flow.
2.2 Wind speed
The term wind can be generally defined as a moving mass of air in relatively horizontal direction. This movement is triggered by the potential difference at two locations. Particularly in Indonesia, sea waves are highly affected by two distinct seasonal wind direction, i.e. wet monsoon and dry monsoon. The wet monsoon causes the wind blowing from the southwest between May and September, and conversely the dry monsoon brings the wind blowing from northwest between October and April [7].
2.3 Wind direction
Indonesia is highly affected by two distinct seasonal wind direction caused by the potential difference between Asia continent and Australia continent, i.e. wet and dry monsoon. The wet monsoon causes the wind blowing from the southwest between May and September, and conversely the dry monsoon brings the wind blowing from northwest between October and April [8].
2.4 Wind duration
Wind duration dictates the amount of dissipated energy from wind flow to sea surface, and thus plays a key role to the formation of sea waves. Furthermore, as the duration controls the dissipated energy, the longer the wind blows the height of formed sea wave is also higher. Besides, wind direction also affects the period of sea waves, which is also an important factor to consider in designing coastal structures.
2.5 Fetch length
Fetch length is the distance travelled by air particles during wind blows. In case of sea wave’s
formation, fetch is defined and limited by land, i.e. continents, islands, and mountains, in the surrounding area. Fetch length can be evaluated using empirical equations.
Numerous method to estimate sea wave height are widely available, such as Sverdrup Munk and Bretschneider (further SMB method) method and Darby Shire Method (further DSM method). Both method uses forecasting to estimate the sea wave height based on past meteorological data.
For forecasting the wave height, a typical conversion chart has been provided by CERC to estimate the deep sea wave height [9]. Moreover, for coastal wave height estimation, another chart has also been generated [10]. In order to obtain reliable results, a set of ten years’ consecutive data is needed.
3 Methodology
To achieve reliable results, primary and secondary data was considered. Primary data was obtained by direct measurement at the studied location, while secondary data was obtained from NOAA website [1]. The later data was in one to six-hours based wind speed record for 16 consecutive years’ measurement. Meanwhile, primary data was retrieved to ensure that the secondary data can be representatively used for forecasting and determining correction factors when necessary. Furthermore, the data was analyzed to construct wind rose to obtain dominant wind direction. After the wind direction was confirmed, design wind duration was selected.
After the wind parameters, i.e. speed, direction, and duration, and fetch length were obtained, forecasting method was performed via both graphical and analytical method. Forecasting by graphical method was done using the existing graph in Shore Protection Manual (SPM) [9]. To use the graph, first and foremost, the wind data needs to be converted to wind stress factor (UA). As all graph’s parameters, i.e. fetch length, wind stress factor, as well as wind direction, are known, the wave height forecasting via graphical method can be done. Meanwhile, the analytical method was done by applying shallow water equations.
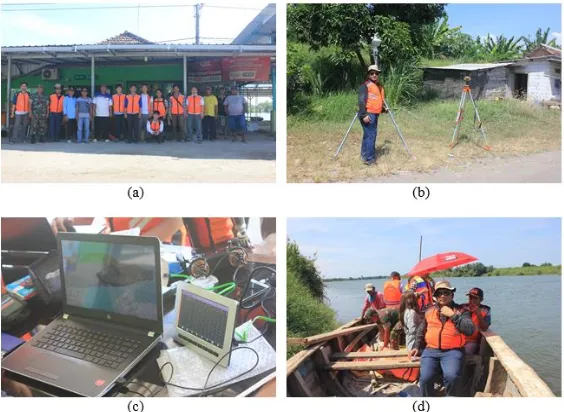
In order to provide reliable data, direct measurement as primary data was carried out. Figure 1a shows the research personnel as well as surveying helper, which includes local officers, army, and local people. Furthermore, Figure 1b shows weather station type AW 003, which was used to monitor real time wind data on site.
Figure 1c shows the process of harvesting the minute-based real time wind data from the weather station probe. The data was further transferred into laptop for advance processing. On the other hand, Figure 1d shows the inspection through the river to identify the key location to the coastal flood problem. In final stage, the data obtained from different spot were combined to produce comprehensive analysis and be used as parameters to decide proper type of coastal flooding structure design.
4 Results and Discussion
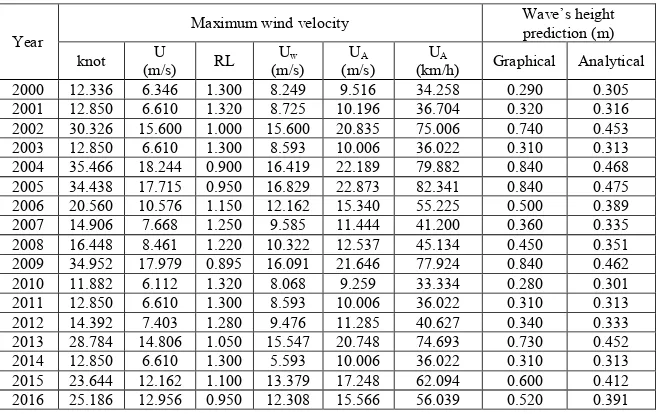
The outcomes of this research is presented by referencing to the accompanying drawings. The identification of research site, at where the maximum sea waves’ height will be predicted, is based on precise full latitude, longitude, and altitude position. Determination of the location can be based on coordinate projection system and World Geodetic System (WGS) 1984-based Cartesian system. For the particular research, projection system is better to be used because it provides higher accuracy as well as presented in standard unit (SI), i.e. meters (m). In identifying the accurate location of the research site, it was important to calibrate the position of the synoptic data recorder station from the anemometer [1,5,7,8,9,10,11]. The synoptic data was periodically sent to National Oceanic and Atmospheric Administration (NOAA) from the station. After the location was confirmed, the number of usable stations for collecting data at the research site was displayed. The available stations were displayed alphabetically, which represented the relative distance to the research site such that representative stations can be selected. The analysis results in effective fetch length of 125.4 km. Furthermore, based on analysis of 16 years’ wind data from 2000 until 2016, analysis based on graphical method (SMB method) and analytical method (DSM method) were performed. It is found that the maximum wind speed is 34.96 knot in 2009.
Table 1 shows the prediction of sea waves’ height via graphical and analytical method. The results clearly show that the maximum wave’s height is 0.840 m and 0.475 m by
5 Conclusion
The lack of sea wave height measurement data in a remote area / research location is identified as one of the main problems for the development of the maritime industry for many years in Indonesia. Then, it is need to have an accurate and effective method for analyzing and determining maximum sea wave height in every territorial waters of Indonesia. The scientist or experts typically carry out the measurements of field data of 2 weeks at research sites / projects which are then used as the basis for planning. Meanwhile, to obtain maximum sea wave height must be based on data in a long time, minimum 10 years so that can be used as guidance design criteria of the coastal construction.
Two methods to predict sea waves’ height, namely SMB and DSM method, was
performed to estimate the sea waves’ height at the research site. Both method was used to predict the sea waves’ height based on 16 years’ synoptic wind data. This method is a new technique which accommodate an accurate procedure to provide realistic and high quality prediction results. It is found that the results obtained from both methods fit the results from previous research. The results also show that the maximum waves’ height are 0.840 m and 0.475 m for graphical and analytical method, respectively. Thus, the results can be used to design a safe coastal structures. In particular, for this research area, in the future the results can be used to decide the best adaptation strategy against coastal flood, which consider another physical hydrodynamic condition, including sea level rise along with topographic and hydrometric data.
The authors would like to express appreciation for the support of the sponsors of Petra Christian University project number: 07/HB-Penel/LPPM-UKP/I/2018 and Directorate General of Higher Education Indonesia and Kopertis VIII, project number: 002/SP2H/LT/K7/KM2017.
References
1. National Oceanic And Atmospheric Administration (NOOA) retrieved from:
https://www.ncdc.noaa.gov/data-access/model-data/model-datasets/reanalysis-1-reanalysis-2, (2017)
2. S. Hermawan, H. Gunawan, JTEC Spec. Ed., (2017) 3. S. Hermawan, Civil Eng. Dim., 18, 2 (2016) 4. S. Hermawan, Adv. Env. Bio., 9, 7 S2 (2015)
5. H. Edy, I.H.N. Yuwono, D. HE, Model distribusi kecepatan angin, (Universitas Gadjah Mada, 2004)
6. J.J. Hidayat, M. Yusuf, E. Indrayanti, J. Ocean., 2, 3 (2013) 7. B. Triatmodjo, Pelabuhan (Beta Offset, Yogyakarta, 1993) 8. B. Triatmodjo, Teknik pantai (Beta Offset, Yogyakarta, 1996) 9. CERC, USA Eng. Waterways Exp. Sta., 2, (1984)