Volume 12 Number 2 2013
Abtract
Research regarding firms life cycle have been carried out for years with varying models and different emphasis. The purpose of this study is to test differences of obstacles in each different stages of firm's life cycle and differences in perceiveing the level obstacles from top managers' different individual background by using Olawale & Garwe (2010) obstacles indicators and Timmons (2007) model of firm's life cycle. Data was taken from 831 firms covering small, medium, and large firms in Indonesia which experienced all thirteen obstacles. Findings show significant differences on obstacles among firms that are in different stages of life cycle,which firms in maturity and stability stage tend to experience greater level of obstacles compare to firms in earlier stages. Findings also found significant differences on top manager's education in perceiving firms obstacles, with manager from higher education background shows higher score in perceiving obstacles, while gender and length of managerial experience shows no significant differences in perceiving obstacles.
Keywords: Small and Medium Enterprise, Firm's Life Cycle, Obstacles, Survival, Individual Background
Abstrak
Penelitian tentang daur hidup perusahaan telah dilakukan selama bertahun tahun dengan menggunakan berbagai model dan penekanan yang berbeda.Tujuan penelitian ini adalah untuk menguji perbedaan hambatan yang dihadapi oleh perusahaan dalam setiap tahapan daur hidup dan perbedaan dalam hal mempersepsi tingkat hambatan berdasarkan latar belakang individu dari
Firm's Obstacles and Survival:
The Study of Firm's Life Cycle and
Obstacles in Indonesia
Retno Ardianti
Petra Christian University Surabaya–Indonesia
pimpinan puncak dengan menggunakan indikator hambatan pertumbuhan usaha dari Olawale dan Garwe (2010) dan model daur hidup perusahaan dari Timmons (2007). Data diambil dari 831 perusahaan kecil, menengah dan besar di Indonesia yang mengalami keseluruhan dari 13 hambatan pertumbuha usaha. Hasil menunjukkan perbedaan yang signifikan dalam hal hambatan usaha dalam setiap tahapan daur hidup yang berbeda, dimana perusahan dalam tahap maturity dan stability menunjukkan tingkat hambatan yang lebih besar dibandingkan dengan perusahaan pada tahapan yang lebih awal. Hasil juga menunjukkan perbedaan yang signifikan dalam hal menilai hambatan berdasarkan latar belakang pendidikan pimpinan puncak, dimana pimpinan dengan latar belakang pendidikan yang lebih tinggi menunjukkan skor hambatan pertumbuhan usaha yang lebih tinggi, sedangkan jenis kelamin dan pengalaman manajerial tidak menunjukkan adanya perbedaan yang signifikan dalam mempersepsi hambatan.
Kata kunci: Usaha Kecil dan Menengah, Daur Hidup Perusahaan, Hambatan, Kelangsungan Hidup, Latar Belakang Individu.
1. Introduction
Over the last 30 years, researchers have carried out significant research regarding firm formation, growth, survival, decline, and closure while focusing on industry and firm characteristics (Headd & Kirchhoff, 2009) The most interesting part from firm's development is the fact that only a fraction of start-ups survive for any appreciable length of time (Fritsch & Schroeter,2011) while those that can not win the market will face a decline and have to leave the market. In each different stages of organizational life cycle, firms will face different pressures and threats that are critical to firm's survival. (Jawahar & Mclaughlin,2001). Therefore firms must acheive high productivity, creating sufficient wealth, value, or satisfaction for all primary stakeholder (Fritsch & Schroeter,2011; Jawahar & Mclaughlin,2001).
Pressures and threats that firms may face can come internally, such as financial and managerial, as well as externally such as economic, markets and infrastructure (Olawale & Garwe,2010). These obstacles will affect firms performance and survival, that later can cause the loss of millions of jobs. Previous studies on obstacles are mostly found on Eastern European and African countries whose economics are experiencing transition. Studies in Asian countries including in Indonesia are still not much to be found. One of the study in Asia, is a research by Moy & Luk (2003) on Small and Medium-size Enterprises (SMEs) in Hong Kong to explore dominant obstacle in different stages of business growth.
This study is conducted in Indonesia, a country with 53.823.732 Small and Medium Entreprises (SME) which provide jobs for 102.241.486 or 97,22% of jobs provided from all firms in the country (Ministry of Cooperation, 2010). This shows the importance for firms to survive, to be able to continue providing jobs for millions of people. Realizing the importance of SMEs survival, the purpose of this study is to describe obstacles experienced by SMEs and to test differences of obstacles in each stages of firms growth by using survey data from the World Bank that was collected in Indonesia. The result of the study can be used by SMEs and policy makers to make changes and reforms to create a better business environment for SMEs.
Received: 04 Desember 2012, Revision: 29 Juli 2013, Accepted: 14 Agustus 2013.
2. Literature Review
2.1. Firms Life Cycle
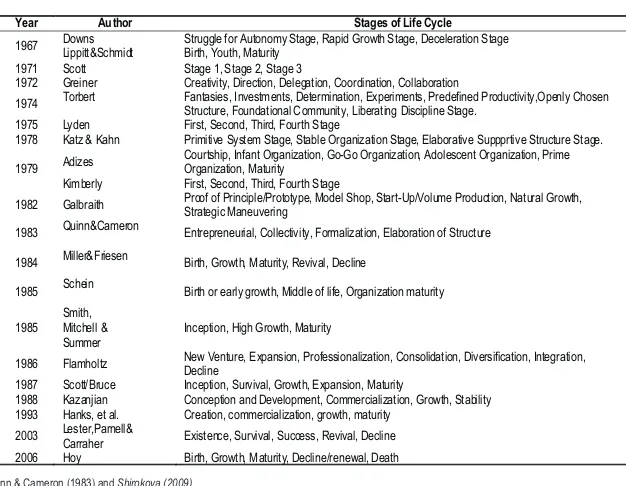
There have been many research on stage models of firms. The number and nature of growth or development stages in these models vary widely from author to author, as do their emphasis (McMahon). Table 1 shows the summary of life cycle models from many different literatures as summarized by Quinn & Cameron (1983) and Shirokova (2009).
Table 1. Life Cycle Model
The high growth stage is a stage when firms starts to get more customer, receiving double even more sales than in the previous stage, and capable to employ 25-75 employee. As with the other stages, the length of time it takes to go through the high growth stage,varies greatly, from 4 to 10 years or even more. From the high growth stage, a company then moves to maturity stage. In this stage, the key issue for the company is no longer survival, rather it is the profitable growth that matters. The last stage of the life cycle is the stability stage, when a company maintain to stay as long as possible in the business.
2.2. Firms Obstacles
There are many factors affecting firms survival and failure. Box (2008) identifities those factors as individual, structural, and environmental factors. Based on their research in Africa, Olawale and Garwe (2010) identified 2 main factors which are internal and external factors. They found that the most important obstacle to the growth is finance and management which are internal factors, followed by economic and market which are external factors. Research in Asia, conducted on 200 small and medium-size enterprises (SMEs) in Hong Kong by Moy&Luk (2003) found five problem categories which are
increase and decrease at different stages of firms life cycle, showing significant relationship between obstacles and development.
Individual background as a part of internal factor can be considered to explain a great part of why some firms fail while others survive and grow (Box,2008). Moreover (Watson&Hogarth-Scott,1998) explain that the influence of founder (individual) in defining the business concept and mode of operation is of paramount importance. In their research on SME success factor in England, the conceptual framework used to explain the business enterprise consists of both the founder and the business entity.
External factors are environmental forces that may support or hinder firm's performance and survival. As mentioned by Box (2008) Firms founded during times of economic crisis exhibit lower survival rates. Environmental forces may vary widely, from goverment regulation to economic and political situation. Olawale and Garwe (2010) found economic environment, markets, infrastructure, crime, corruption, labour and regulations as external factors in their research. Doern (2009) summarized studies on small and medium entreprises in European economies which experience great transition in recent years. As shown in table 2 below, external factors which are mainly come from goverment policies in the form of tax rate and interest rate are found in most of the studies as the obstacles to the growth of the firms.
Table 2. Barriers of SME in European Economies
competition, people, capital, product/marketing management, and owner. The obstacles found showed an
Year Author Stages of Life Cycle
1967 Downs Lippitt&Schmidt Struggle for Autonomy Stage, Rapid Growth Stage, Deceleration Stage Birth, Youth, Maturity 1971 Scott Stage 1, Stage 2, Stage 3
1972 Greiner Creativity, Direction, Delegation, Coordination, Collaboration
1974 Torbert Fantasies, Investments, Determination, Experiments, Predefined Productivity,Openly Chosen Structure, Foundational Community, Liberating Discipline Stage.
1975 Lyden First, Second, Third, Fourth Stage
1978 Katz & Kahn Primitive System Stage, Stable Organization Stage, Elaborative Suppprtive Structure Stage. 1979 Adizes
Courtship, Infant Organization, Go-Go Organization, Adolescent Organization, Prime Organization, Maturity
Kimberly First, Second, Third, Fourth Stage
1982 Galbraith Proof of Principle/Prototype, Model Shop, Start-Up/Volume Production, Natural Growth, Strategic Maneuvering 1983 Quinn&Cameron Entrepreneurial, Collectivity, Formalization, Elaboration of Structure
1984 Miller&Friesen Birth, Growth, Maturity, Revival, Decline
1985 Schein Birth or early growth, Middle of life, Organization maturity 1985
Smith, Mitchell & Summer
Inception, High Growth, Maturity
1986 Flamholtz New Venture, Expansion, Professionalization, Consolidation, Diversification, Integration, Decline 1987 Scott/Bruce Inception, Survival, Growth, Expansion, Maturity
1988 Kazanjian Conception and Development, Commercialization, Growth, Stability 1993 Hanks, et al. Creation, commercialization, growth, maturity
2003 Lester,Parnell&
Carraher Existence, Survival, Success, Revival, Decline 2006 Hoy Birth, Growth, Maturity, Decline/renewal, Death
Quinn & Cameron (1983) and Shirokova (2009)
Table shows that for more than 40 years, researchers have tried to model firms development as a life cycle that is based on firm's internal characteristics. Although there are variability among models, all included some dimensions related to the organization context and structure. Common dimensions included organization age, size, growth rate, and focal tasks or challenges the firm faced (Shirokova,2009)
Timmons (2007) explains life cycle model of a firm in terms of time, sales, and number of employees. The model explained is devided into four stages which are R&D, start up, high growth, maturity and stability. The research and development stage (R&D) is a stage when a single entrepreneur, or small team, doing the research and development for their business idea. This stage can be as short as a few months or can last years. The startup stage, a stage that usually covers the first two or three years but perhaps as many as seven. It is characterized by the direct and exhaustive drive, energy, and entrepreneurial talent of the entrepreneur to develop the business in entering the market. .
Year Author Country Barriers Found
2007 Kraznigi Kosova Tax rate, unfair competition, financial (access to and cost of fund)
2003
Pissarides, Singer& Svenjar
Russia &
Bulgaria Financial barriers (obtaining external financing and high cost of financing Aidis Lithuania Tax rate & policies, low purchasing power, lack of fund
2001
Hashi Albania Financial barriers, political instability, frequent cahnges in law and regulation Bartlett & Bukvic Slovenia Financial & bureaucracy
6. Tax rate Obstacle.
7. Tax administration Obstacle.
8. Crime, theft and disorder Obstacle.
9. Acess to finance which includes availability and cost, interest rates, fees and collateral requirements.
10. Business licence Obstacle. 11. Political Obstacle. 12. Corruption Obstacle. 13. Labour regulations Obstacle.
Respondents from this survey are firm managers and owners. They are asked to indicate the severity of these obstacles based on their experiences to the current operations of the firms by using these following scale: 0 for no obstacle, 1 for minor obstacle, 2 for moderate obstacle, 3 for major obstacle and 4 for very severe obstacle. For the purposes of this study, analysis of obstacles to describe differences among obstacles in each different stages of firms life cycle by using Timmons' stages of venture growth model (2007) to classify each firms based on their stages of life cycle.
Descriptive analyses will also be perform to describe firms profile and business environment indicators that later become obstacles of the firms. Following the analyses, Analysis of Variance (ANOVA) would be conducted to reveal signifance differences among obstacles in each different stages and differences on individual factors in perceiving obstacles.
4. Discussion
4.1. Firms Life Cycle
From data collection, firms in stability stage dominates with 418 firms, followed by high growth (190), maturity (182) and start up (41). In all stages, male top managers always out number their female counterparts with only 201 from 831 or 24% from all firms involved in this analysis. This reveals the same results from the survey conducted by Global Entrepreneurship Monitor which shows that women's participation in entrepreneurial activity varies widely around the globe, ranging from slightly more than 1.5% of population to as high as 45.4%. (Kelley, Brush, Greene, & Litovsky, 2010).
While managerial experience that dominates may vary in each stages of life cycle, education background shows similarity with secondary school graduates become the highest percentage for all stages.
2.3. Individual Factors
Past research on individual factors that contribute to firm's performance and survival have been explored from many perspectives, such as personality and demographic trait of the entrepreneur. Demographic trait which consists of age, education, gender and ethnicity have been identified to distinguish between successfull and not successefull business organization.
Cooper, Gimeno-Gascon and Woo (1994) found that measures of general human capital influenced both survival and growth, except for gender, with women-owned ventures being less likely to grow, but just as likely to survive. This research also found that industry specific know how contribute to both survival and growth. Kalleberg and Leicht (1991) found that businesses headed by women were not more likely to go out of business, nor less successful, than those owned by men. In more detailed analysis, Boden&Nuccib (2000) found that the survival prospects of both male and female owned businesses are greater for owners with 10 or more years of prior work experience and/or 4 or more years of college.
Overall, the mean survival rates of male-owned businesses in these two cohorts are 4 to 6% higher, respectively, that those of businesses owned by women. Rosa, Carter & Hamilton (1996) argued that women perform less well on some business quantitative financial measures such as jobs created, sales turnover, profitability is usually because women do not enter business for financial gain, but to pursue intrinsic goals (e.g. independence, flexibility to interface family and work commitments). Women thus assess their success in relation to their achievement in attaining these goals rather than on the more usual economic or financial measures
3. Research Methodology
This study uses data taken from 831 firms covering small, medium, and large firms in Indonesia which experience all thirteen obstacles. Data are taken from The Enterprise Surveys, a survey by the world bank and its partners that focus on factors that shape the business environment such as infrastructure, trade, finance, regulations, taxes & business licensing, corruption, and crime. It is aimed to collect panel data to be used to track changes in the business environment over time. Three levels of stratification were used in this survey; industry (manufacturing and service), size (small, medium and large firms) and region (Bali, Banten, Jakarta, West Java, Central of Java, East Java, Lampung, South Sulawesi, and North Sumatera).
External factors obstacles will be described based on Garwe and Olawale (2010) which are economic environment, markets, infrastructure, crime, corruption, labour and regulations with these following indicators:
1. Electricity Obstacle.
2. Transportation Obstacle.
3. Custom and trade regulations Obstacle.
4. Ports and airports operations and administrations Obstacle. 5. Acces to land (for construction related permit) Obstacle.
4. 2. Obstacles and Life Cycle
By using descriptive statistics, the table below presents ranks of obstacles from four different stages of firms life cycle.
Table 3. Firms Obstacles By Rank from Each Different Stages of Life Cycle
Figure 1. Firms Life Cycle & Individual Background
Women involvement in business shows a rising number with more female managers are found leading firms in earlier stages. 34 % of starts up are led by female managers compared to 20% and 23% in maturity and stability stage. In terms of managerial experience, start up and high growth show close similarity with nearly 90% of them are led by managers with lesser than 10 years of managerial experience. Only 23% of firms in stability stage are found to be led by young managers. A figure of 34% of more than 20 years of managerial experience by top manager are found for firms in stability stage, compared to only 2% in start up. This show how managers' experience grow along with the firms they lead.
Managers in maturity and stability stage are not only possessing more managerial experience, but also better education background. As it is seen in the chart, 36% of managers found in maturity stage firms are university graduates, compared to only 12% in start up. Overall, firms in maturity and stability stage show longer experience and better education background from their managers, giving them more advantages compared to other firms in earlier stages.
Start Up High Growth Maturity Stability
1 Crime&Theft 1,17 Crime& Theft 1,19 Electricity 1,18 Electricity 1,30
2 Business License 1,00 Electricity 0,92 Crime& Theft 1,13 Crime& Theft 1,07
3 Electricity 0,88 Access Land 0,66 Business License 0,77 Business License 0,91
4 Access To Land 0,83 Business License 0,65 Transportation 0,72 Transportation 0,83
5 Political 0,71 Transportation 0,63 Tax Administrative 0,58 Political 0,78
6 Transportation 0,66 Political 0,58 Access To Land 0,55 Access to finance 0,59
7 Tax Administrative 0,46 Tax Administrative 0,45 Political 0,51 Labour 0,59
8 Tax Rate 0,41 Labour 0,38 Access To Finance 0,51 Tax Administrative 0,57
9 Access To Finance 0,32 Access To Finance 0,32 Labour 0,51 Tax Rate 0,57
10 Corruption 0,29 Corruption 0,30 Tax Rate 0,41 Access To Land 0,56
11 Custom& Trade 0,22 Tax Rate 0,29 Custom& Trade 0,31 Corruption 0,43
12 Labour 0,20 Custom& Trade 0,14 Corruption 0,24 Custom & Trade 0,35
13 Ports& Airports 0,07 Ports& Airports 0,11 Ports& Airports 0,19 Ports &Airports 0,26
Table shows that all obstacles identified are still in the range of no obstacle to moderate obstacle. No major or severe obtacles found in all stages. The lack of electricity supply and the problem of security are found to be the biggest obstacles. Contrary to land transportation which is found at number 4 to 6, air and sea transportation (port and airport obstacle) is found to be the obstacle with the lowest rank from all stages. This results reveals that firms in Indonesia need a secure environment, better infrastructure and reforms in bureaucracy to grow to the next level. This condition is different from results found in Eastern Europe and Africa where tax administration, tax rate and finance still become dominant obstacles.
To test whether there are significant differences among obstacles for each different stages, the table below shows the result of ANOVA analysis.
Table 4. ANOVA Analysis for Total Obstacles
Stages N Total Obstacle sig.
Stability 418 8,82
0,004
Maturity 182 7,60
high growth 190 6,61
Table 6 shows internal factors which are top manager's length of managerial experience, gender, and educational background and the total score of obstacles perceived by the manager. Result shows that there is significant difference on top manager's education in perceiving firms obstacles, with manager with higher education background shows higher score in perceiving obstacles. Top manager with higher education background tend to show higher awareness on business risk compare to those with lower education background. Gender and length of managerial experience shows no significant differences, but the table also reveals interesting findings which show that top manager with lesser experience tend to score obstacles higher than their more senior counterpart.
Table also shows that male manager tend to see obstacles as greater than those seen by female managers. The result once again shows the importance of education for the entrepreneur or top managers who runs the business, as shown in research by Bates (1990) that years of education is the strongest human capital variable for identifying business continuance.
5. Conclusion
Significant differences on obstacles among firms that are in different stages of life cycle are found, which firms in maturity and stability stage tend to experience greater obstacles compare to firms in earlier stages or firms still in the start up or growth stage. Electricity, custom, ports&airports, access to finance, tax rate, business licence, political, corruption, and labour are found to be obstacles that differentiate among stages of firm's life cycle.
Based on top manager's individual factors, the result show that more mature firms enjoy the benefit of better human capital, as shown by the analysis that firms in maturity and stability stage are led by managers with longer managerial experience and better education background. Research also found significant difference on top manager's education in perceiving firms obstacles, with manager with higher education background shows higher score in perceiving obstacles while gender and length of managerial experience shows no significant differences in perceiving obstacles.
Overall findings indicate that firms regardless of the stages must deal with obstacles come from business environment that may vary and increase in scale along with the growth of the firms. This shows the importance for firms to conduct internal and external analysis, as a part of strategic management practices. Continuous investment in human capital is also needed for all firms, as results also indicate that experience and education as a part of firm's internal factor has shown to bring differences, with bigger and more mature firms are led by individuals with higher education and longer experience.
References
Box, M. (2008).The Death of Firms: Exploring The Effects of Environment And Birth Cohort on Firm Survival In Sweden, Small Business Economics 31(4): 379-393.
Bates, T. (1990). Entrepreneur Human Capital Inputs and Small Business Longevity. The Review of
Economics and Statistics 72 (4):551-559.
Cooper, A. C., Gimeno-Gascon, F. J., and Woo, C. Y. (1994). Initial Human and Financial Capital as
Predictors of New Venture Performance. Journal of Business Venturing 9(5): 371-395.
Table 3 and 4 present the result of Anova analysis. Using 0,05 level of significance, table shows there are significant differences on obstacles among firms in different stages of life cycle. When firm in start up stage is often perceived as firm at the most difficult stage, result shows that more experienced firms (firms in maturity and stability) show higher obstacle score, revealing condition with higher obstacle compare to firm in start up and high growth stage. Table 4 reveals a more detailed analysis, showing that from 13 obstacles identified; transport, access to land, crime&theft and tax administrative obstacle show insignificant results, meaning there are no differences for these obstacles in each different stages.
These all four has relatively same mean score, showing the same level of difficulty for all firms to manage perceived by their top manager regardless of the stages. Electricity, custom, ports & airports, access to finance, tax rate, business licence, political, corruption, and labour obstacles are all showing significant result, with electricity and labour are obstacles that shows an increase in obstacles score from start up to stabilty, showing more mature firms will face more obstacles on labour and electricity due to an ever increasing firm's capacity.
Table 5. ANOVA Analaysis
4.3. Obstacles and Top Manager Individual Background
Table 6. Top manager Individual Background And Obstacles
Managerial Experience N Mean Sig.
Education Background N Mean Sig.
No Education 23 5,65
International Graduate Degree 12 11,67
Obstacle Sig. Obstacle Sig.
electricity obstacle .005 tax rate obstacle .001 transport obstacle .172 tax administrative obstacle .367 custom trade .007 businesslicence obstacle .039 Ports&& airports .035 political obstacle .031
Access to land .331 Corruption .043
Crime&theft .643 labour obstacle .009
Departemen Koperasi dan Usaha Kecil (2010). Perkembangan Data Usaha Mikro, Kecil, Menengah ( U M K M ) D a n U s a h a B e s a r ( U B ) Ta h u n 2 0 0 9 – 2 0 1 0 . Av a i l a b l e a t : h t t p : / / w w w . d e p k o p . g o . i d / I n d e x . P h p ? O p t i o n = C o m P h o c a d o w n l o a d &View=Sections&Itemid=93[Accessed 20 July 2012]
Kelley, D.J., Brush, C.G., Greene, P.G. , and Litovsky, Y.( 2011).Women's Report 2010., Global Entrepreneurship Monitor, Available at: http://www.gemconsortium.org/docs/768/gem-2010-womens-report. [Accessed 2 July 2013].
Timmons, J. And Spinell, S. (2007). New Venture Creation: Entrepreneurship For The 21st Century. Mc.Graw Hill Education. ISBN 0071254382.
Doern, R. (2009). Investigating Barriers to SME Growth and Development in Transition Environments A
Critique and Suggestions for Developing the Methodology. International Small Business
Journal27 (3): 275-305.
Fritsch, M., and Schroeter, A. (2011). Why Does the Effect of New Business Formation Differ Across
Regions?. Small Business Economics36(4): 383-400.
Headd, B., and Kirchhoff, B. (2009). The Growth, Decline and Survival of Small Businesses: An
Exploratory Study of Life Cycles. Journal of Small Business Management47 (4):531-550.
Jawahar, I. M., and McLaughlin, G. L. (2001). Toward a Descriptive Stakeholder Theory: An
Organizational Life Cycle Approach. Academy of Management Review26 (3):397-414.
Kalleberg, A. L., and Leicht, K. T. (1991). Gender and organizational performance: Determinants of small
business survival and success. Academy of Management Journal34 (1): 136-161.
McMahon, R. G. (1998). Stage Models of SME Growth Reconsidered. Small Enterprise Research 6(2):
20-35.
Moy, J. W., and Luk, V. W. (2003). The Life Cycle Model as a Framework for Understanding Barriers to
SME Growth in Hong Kong. Asia Pacific Business Review10(2): 199-220.
Olawale, F., and Garwe, D. (2010). Obstacles to the Growth of New SMEs in South Africa: A Principal
Component Analysis Approach. African Journal of Business Management4 (5): 729-738.
Boden Jr, R. J., and Nucci, A. R. (2000). On the Survival Prospects of Men's and Women's New Business
Ventures. Journal of Business Venturing15 (4): 347-362.
Rosa, P., Carter, S., and Hamilton, D. (1996). Gender as a Determinant of Small Business Performance:
Insights from a British Study. Small Business Economics8 (6): 463-478.
Shirokova, G. (2009). Organizational Life–Cycle: The Characteristics of Developmental Stages in
Russian Companies Created from Scratch. Journal for East European Management Studies
14 (1): 65-85.
Watson, K., Hogarth-Scott, S., and Wilson, N. (1998). Small Business Start-ups: Success Factors and
Support Implications. International Journal of Entrepreneurial Behaviour & Research4 (3):
217-238.
Yeh, Q. J., and Fang, P. (2011). A Resource-Based Analysis of Organizational Turnaround: The
Contingency Role of Organizational Life Stages. Journal of Management & Organization17