Full Terms & Conditions of access and use can be found at
http://www.tandfonline.com/action/journalInformation?journalCode=vjeb20
Download by: [Universitas Maritim Raja Ali Haji] Date: 11 January 2016, At: 19:44
Journal of Education for Business
ISSN: 0883-2323 (Print) 1940-3356 (Online) Journal homepage: http://www.tandfonline.com/loi/vjeb20
Using the Major Field Test for a Bachelor's Degree
in Business as a Learning Outcomes Assessment:
Evidence From a Review of 20 Years of
Institution-Based Research
Guangming Ling, Jennifer Bochenek & Kri Burkander
To cite this article: Guangming Ling, Jennifer Bochenek & Kri Burkander (2015) Using the Major Field Test for a Bachelor's Degree in Business as a Learning Outcomes Assessment: Evidence From a Review of 20 Years of Institution-Based Research, Journal of Education for Business, 90:8, 435-442, DOI: 10.1080/08832323.2015.1095703
To link to this article: http://dx.doi.org/10.1080/08832323.2015.1095703
Published online: 29 Oct 2015.
Submit your article to this journal
Article views: 14
View related articles
Using the Major Field Test for a Bachelor’s Degree
in Business as a Learning Outcomes Assessment:
Evidence From a Review of 20 Years of
Institution-Based Research
Guangming Ling, Jennifer Bochenek, and Kri Burkander
Educational Testing Service, Princeton, New Jersey, USA
By applying multilevel models with random effects, the authors reviewed and synthesized findings from 30 studies that were published in the last 20 years exploring the relationship between the Educational Testing Service Major Field Test for a Bachelor’s Degree in Business (MFTB) and related factors. The results suggest that MFTB scores correlated moderately with overall grade point average (.45) and ACT or SAT scores (.56) across the studies, before accounting for imperfect reliability or range restriction issues, which supports the claim that the MFTB is a valid assessment tool to gauge information about business-related learning outcomes for a variety of colleges and universities that are similar to those included in the studies.
Keywords: correlation, grade point average, learning outcomes assessment, Major Field Test in Business, multilevel model, validity
INTRODUCTION
Standardized tests have been widely used for gauging infor-mation about college students’ learning outcomes in the last several decades, accompanied by a variety of assessment tools typically developed by local institutions. Discovering the test’s reliability and validity for such uses, such as to what extent these tests can truly reflect what students have learned during their college educations, and whether the test scores can objectively and reliably reflect the knowl-edge and skills students have mastered, is critical to the assessment of college learning outcomes and to the under-standing of consequences of using test scores.
Among the standardized tests that are used in practice, the Educational Testing Service (ETS) Major Field Test for a Bachelor’s Degree in Business (MFTB) is probably the most popular (e.g., Green, Stone, & Zegeye, 2012). A brief survey in the literature revealed that many researchers have investigated the MFTB scores and different factors (e.g., students’ characteristics) related to the test scores (see
Bielinska-Kwapisz, Brown, & Semenik, 2012; Green et al., 2012). However, these studies differed greatly from each other in terms of institutions and samples included, types of factors or characteristics, and statistical methods. Most of these studies focused on the relationship between the MFTB and student characteristics, but no study was found to synthesize published studies and provide evidence that could support the use of MFTB as a valid learning out-comes assessment tool. If we assume grade point average (GPA) as an adequate indicator of college learning out-comes, as seen in the literature of test validity research, a moderate or high level of correlation between the MFTB score and students’ senior year or graduating GPA would be plausible supporting evidence for such purposes. Thus, summarizing published studies regarding such a relation-ship would provide useful evidence in support of the use of MFTB as a learning outcomes assessment tool.
With this in mind, we searched the literature and recoded and summarized those studies in which the relationship between the MFTB and GPA was reported, applying multi-level models. We expect that such an approach and the sta-tistical summary could inform users and researchers in their practices of using standardized tests for the purpose of mea-suring college business students’ learning outcomes. Correspondence should be addressed to Guangming Ling, Educational
Testing Service, Research & Development, Turnbull R131 (MS 07-R), Princeton, NJ 08541, USA. E-mail: [email protected]
ISSN: 0883-2323 print / 1940-3356 online DOI: 10.1080/08832323.2015.1095703
RELATED BACKGROUND
Measuring Learning Outcomes
The emphasis on measuring learning outcomes of higher education can be traced back to at least the 1970s (Barak, 1977; Folger, 1977; Peterson, Erwin, & Wilson, 1977). Since then, institutional effectiveness and its assessment and evaluation have gained in importance with the push from federal agencies, national and regional governing boards, accreditation agencies, and other higher education stakeholders (U.S. Department of Education, 2006). In 1988 the U.S. Secretary of Education, William Bennett, issued an executive order requiring all federally approved regional accreditation organizations to include evidence of institutional effectiveness in their accreditation criteria (Palomba & Banta, 1999). As a result, six regional accredi-tation organizations, including the international Association to Advance Collegiate Schools of Business (AACSB), began to review the program’s learning outcomes for accreditation purposes. In 2002 the AACSB explicitly included in its accreditation criteria the assurance of learn-ing and assessment of learnlearn-ing outcomes (Black & Duhon, 2003; see also AACSB, 2013; Shaftel & Shaftel, 2007).
These changes in related policies and accreditation crite-ria have also contributed to the development and adoption of standardized large-scale outcomes assessment. Among the approaches that could directly assess or evaluate learn-ing outcomes, standardized test seems to be the most popu-lar choice across disciplines (Black & Duhon, 2003). Standardized tests provide objective and reliable measures about what individuals know and can do, and help stake-holders allocate educational resources or opportunities effi-ciently and appropriately. Standardized tests help to put everyone, regardless of their educational experience, socio-economic background, and schools or programs, on the same scale to facilitate an objective comparison among institutions and cohorts. They reportedly also have been used as the external criteria for evaluating the learning out-comes of students in a given school or program, in contrast to GPA, which is subject to grade inflation and difficult to compare across institutions (Ewell, 1987; Nichols & Nichols, 2000).
Among the few standardized direct assessment tools of business-learning outcomes, the MFTB (ETS, 2014a) is widely used by business programs in the United States and around the world (e.g., Martell, 2007; Pringle & Michel, 2007). Green et al. (2012) reported that more than 180,000 students from 685 business programs took the MFTB between 2006 and 2010. About two thirds of these programs were accredited by the AACSB. The official website lists 385 U.S.-based business programs using the MFTB during the 2013–2014 academic year (ETS, 2014b); most of these programs are AACSB-accredited programs.
About the MFTB
The MFTB is a comprehensive outcomes assessment designed to measure the critical business-related knowledge and skills commonly obtained by college students in a busi-ness major. The test also evaluates students’ ability to ana-lyze and solve problems, understand relationships, and interpret material typically seen in the business context (ETS, 2014a). The MFTB covers nine subdomains of busi-ness-related knowledge and skills, including accounting, economics, management, quantitative business analysis, information systems, finance, marketing, legal and social environment, and international issues. Each of these nine subdomains is measured by 12–18 multiple-choice items, totaling 120 items for the whole test. Each question has four choices, among which only one is correct (there is no penalty for guessing the answer). The total number of cor-rect answers (between zero and 120) are converted to a scale score between 120 and 200, with an internal consis-tency of .90 in terms of Cronbach’s alpha. In addition to the total scaled score, scores at the group level (e.g., class, pro-gram, cohort) are also reported for each business subdo-main, named as the assessment indicator. Institutions within and outside of the United States (Ling, 2014) typi-cally use the MFTB to measure students’ mastery of their business study, assess the effectiveness of business pro-grams, improve curricula and student learning (Kimmell, Marquette, & Olsen, 1998), and satisfy specific require-ments set by accrediting agencies.
Earlier Reviews of the MFTB and Related Factors
Two studies were found to summarize across studies and institutions, mainly regarding the relationships between the MFTB scores and student background variables. For exam-ple, Bielinska-Kwapisz et al. (2012) and Green et al. (2012) summarized 17 studies at 14 universities and col-leges. They found that several factors, including the overall GPA (OGPA), the major course–related GPA (MGPA), and ACT or SAT scores were significantly associated with the MFTB scores. A mixed pattern of relationships was found between the MFTB score and gender or age. Great variation (between 29% and 79%) was found in terms of the MFTB score variance being explained by different sets of varia-bles. The wide range of these percentages across studies suggest that the relationship between MFTB score and GPA is likely to vary greatly across studies as well and it is necessary to conduct a meta-analysis study to synthesize such relationship. However, because different sets of fac-tors were included in these studies, it seems challenging to make a direct inference regarding whether the MFTB is a valid assessment of business learning outcomes. From this perspective, it is necessary to focus on the relationship between MFTB score and other measures of college learn-ing outcomes (e.g., GPA) and leave out the other factors
436 G. LING ET AL.
considered in different studies. Finally, there were more than a dozen other studies that were more recently pub-lished but had not yet been synthesized or reviewed.
GPA as a Measure of Learning Outcomes
Measures of learning outcomes can be divided into several categories, including local measures and external or stan-dardized measures. Local measures include student’s GPA based on all courses or a subset of courses (e.g., major-related courses). The GPA is traditionally considered an acceptable measure of college student outcomes (Burton & Ramist, 2001; Means, Toyama, Murphy, Bakia, & Jones, 2009; Prentice & Robinson, 2010; Zwick, 2007), though it is far from a perfect indicator (e.g., Klein, Kuh, Chun, Hamilton, & Shavelson, 2005). For example, GPA is widely considered to be dependent on course-taking pat-terns and grading policies that vary among schools or pro-grams (Rojstaczer & Healy, 2010; Stricker, Rock, Burton, Muraki, & Jerele, 1994). The variations on the course-tak-ing patterns include general education versus major-related courses, basic versus more advanced courses, and courses focusing more on quantitative versus qualitative skills, whereas grading policies may vary by major, institution, and faculty member. The grade inflation effect may also differ among institutions, which makes the comparability of GPA across institutions more questionable.
Local measures such as GPA can be considered to be measures of constructs or content areas similar to those tar-geted by standardized outcomes measures such as the MFTB. The GPA is averaged across course grades provided by multiple faculty members for courses (general education courses and major-related courses) taken in multiple semes-ters, whereas the MFTB covers nine content areas of the business major and is developed by business faculty mem-bers based on periodic large-scale curriculum surveys. The fact that close to 400 business programs use the MFTB as an outcomes assessment also suggests that the test overlaps to a great extent with the curriculum of many programs. In addition, most students take the MFTB during their senior year or near graduation, when their course requirements have been met. Thus the MFTB and senior-year GPA over-lap in terms of the time point at which the student outcomes are measured.
As was suggested by Messick (1989), the validation pro-cess can be realized by surveying the relationships between the test scores and other measures of similar constructs or content. If we acknowledge the GPA as an acceptable mea-sure of college learning outcomes, a moderate-to-high cor-relation between MFTB scores and GPA would help to support the claim that MFTB can also be used to measure learning outcomes (e.g., Ewell, 1987; Nichols & Nichols, 2000). Alternately, evidence could be collected by examin-ing longitudinally whether the MFTB can appropriately capture what students have gained or learned in terms of
business-related knowledge and skills after completing the college-level business education program. However, we did not find a study in our review that took such an approach and decided to focus on the former approach.
With these considerations, we surveyed the literature for MFTB-related studies published over the last 20 years and reviewed and summarized the validity-related evidence. Quite a few studies (see Green et al. (2012) for a summary) also reported the correlations between MFTB scores and other admission test scores (e.g., SAT or ACT). We believed that these admission tests may also overlap to some extent on the skills or knowledge that are required to answer the ques-tions in MFTB, and decided to also include them here.
METHOD
Search and Study Inclusion Criteria
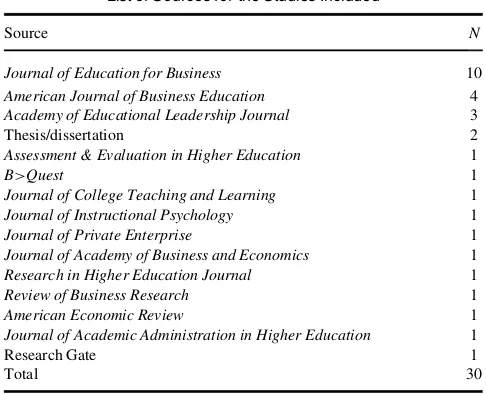
Two different sources were consulted in the first stage of the study, using MFTB as the keyword, through Google Scholar and ResearchGate. The records obtained were then reviewed to screen out those with limited or no empirical data, which left 34 articles that involved the empirical test data of MFTB. Four1of these studies were conducted at the ETS on issues different from those of the other articles and thus were excluded from this article. The review and sum-mary in the next section are based on the remaining 30 articles (see the Appendix for a complete list). Among them, 10 were from theJournal of Education for Business, four were published in the American Journal of Business Education, three were from the Academy of Educational Leadership Journal, two were dissertations, and the remain-ing articles were from other journals (see Table 1). The fact that about a third of the articles came from the same journal (Journal of Education for Business) on the one hand indi-cates that this journal is probably the main channel through which business faculty members share and communicate their views and research related to business education and outcomes assessment; on the other hand, it may lead to find-ings being heavily impacted by these institutions and may add some limitations when generalizing the findings to business schools that differ from those who had faculty members published in this journal.
Study Characteristics
The institutions where these studies were based varied by the Carnegie Classification type, including three from bac-calaureate colleges of arts and science, 15 offering master’s degrees (including 11 with larger master’s-level programs), and seven research universities. Sixteen institutions were public colleges and universities, and nine were private and not for profit. The institutions were located in different regions of the United States, including five from the
Mid-Atlantic region; seven from the Southeast region; three from the Great Lakes, Plains, and Southwest regions; two from the Rocky Mountain region; one from the New England region; and one from the West Coast region. All of these institutions were accredited by regional associations.
There were several types of GPA variables in these stud-ies, all considered as similar measures of general college academic achievement or business-related learning out-comes, a common practice in the context of meta-analysis (Raudenbush & Bryk, 2002). For convenience, we divided the studies into two groups based on the types of GPAs: the first group with OGPA, including cumulative GPA and overall course GPA (12 studies); the second group with OGPA that excludes the transferred credit (OGPAnT; 16 studies). Only one study had the MGPA, we decided to drop it in the synthesis because the interpretation with MGPA would have been different from the interpretation with GPAs that include non–major-related courses. The analyses were based on the 12 studies with OGPA first, then the 16 studies with OGPAnT, and finally the two sets together by adding a study-level indicator of the GPA type.
Twenty-two studies examined the relationship between the MFTB scores and standardized tests such as the SAT (six studies) and ACT (16 studies). We grouped the studies by the test type (SAT or ACT) separately first in the analy-sis and then analyzed all the studies together by adding a dummy variable indicating test type.
Analysis
A two-level unconditional model was applied to estimate the effect size, or the association between MFTB scores and GPAs (Hafdahl & Williams, 2009; Hedges & Vevea, 1998; Raudenbush & Bryk, 2002). The correlation reported in each study was first transformed in the scale of effect size using Fisher’sz transformation and then decomposed
as the sum of study-level effect size and a random residual (see Equation 1).
Unconditional Model (noted as Model hereafter) Level 1 (within study):
djDdjCej (Equation 1)
where j stands for a particular study and dj is the
trans-formed effect size of the correlation between MFTB and the criterion variable GPA.
The school-level effect size was decomposed as an over-all mean effect size across over-all studies plus a study-level ran-dom effect. No predictor at the study level was considered in the unconditional model.
Level 2 (between studies):
djDg0Cuj (Equation 2)
whereg0is the mean effect size across theJstudies anduj
is the study-specific component in terms of the effect size (or deviation of a study’s effect size from the grand mean effect size across studies).
Compared to a simple arithmetic average across all stud-ies on the targeted correlation coefficients, the approach of a multilevel model with random effects has the capacity of accounting for a large number of studies that may differ dramatically in the effect size of interest and can flexibly account for the differences among individual studies in terms of sample size and effect size (e.g., Hafdahl & Williams, 2009; Raudenbush & Bryk, 2002). When the var-iance of the study-level random effect is significantly dif-ferent from zero, a more complex model can be considered to account for study-specific characteristics. For example, study characteristics such as sample size, proportion of male students, or proportion of minority or English learners can be added to Equation 2 as predictors of the within-study effect size and to test if any of them can explain the between-study variation of the effect size.
RESULTS
Overall Effect Size in Terms of Correlation Between MFTB Scores and GPAs
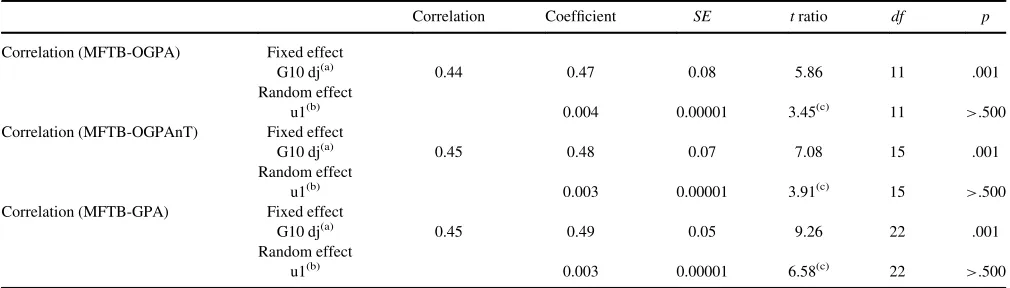
For the 12 studies that reported the correlation between the MFTB scores and OGPA (inclusive of transfer cred-its), the average effect size was estimated as .47 (se D
.08; see Table 2), which was significantly different from zero,t(11)D5.86,p <.001. The effect size of .47 corre-sponds to a correlation of .44, which had a variance esti-mate of .004 that was not significantly different from zero,x2(11)D3.45,p>.500 (see Table 2).
The estimated mean effect size was .48 (seD.07) for the
correlation between MFTB and OGPAnT, which is
TABLE 1
List of Sources for the Studies Included
Source N
Journal of Education for Business 10
American Journal of Business Education 4
Academy of Educational Leadership Journal 3
Thesis/dissertation 2
Assessment & Evaluation in Higher Education 1
B>Quest 1
Journal of College Teaching and Learning 1
Journal of Instructional Psychology 1
Journal of Private Enterprise 1
Journal of Academy of Business and Economics 1
Research in Higher Education Journal 1
Review of Business Research 1
American Economic Review 1
Journal of Academic Administration in Higher Education 1
Research Gate 1
Total 30
438 G. LING ET AL.
significantly different from zero (see Table 2). Again, the variance of this correlation coefficient among the 16 studies was found to be not significantly different from zero (see Table 2). The estimated mean effect size of .48 corresponds to an MFTB-OGPAnT correlation of .45 after transforma-tion, which was slightly higher than that for the MFTB-OGPA correlation.
Based on these results, it seems that there was no large difference between the two types of GPAs (including or excluding the transfer credits). We pooled all 24 studies and dummy-coded the two types of GPA in a variable that was entered as a study-level predictor in the Model. An average effect size was estimated to be .49, regardless of which GPA type was used. The average effect size esti-mated corresponds to a correlation coefficient of .45. No significant difference was found between the two types of GPA, nor was the variance found among the 24 studies in terms of the effect size of the MFTB-GPA correlation (see Table 2).
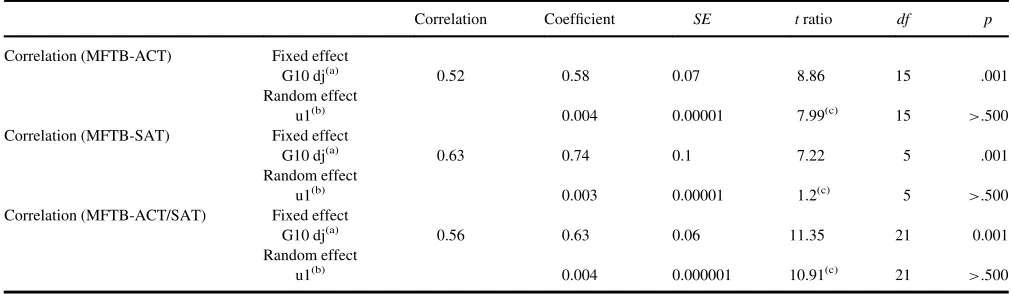
Overall Effect Size (Correlation Between the MFTB and SAT/ACT Scores)
For the 16 studies reported correlation between MFTB and ACT scores, the effect size was estimated as .58 (or .52 in terms of correlation),t(15)D8.86,p<.001. However, its variance was not significantly different from zero,x2(15)D
7.99,p>.500. Similarly, the estimated mean effect size for the MFT-SAT correlation was .74 (or .63 in terms of corre-lation), which is higher than that for the correlation between MFTB scores and ACT scores. (See Table 3).
Finally, the studies using ACT and those using SAT were combined (22 studies), with a dummy variable indi-cating the type of standardized test as the between-study-level predictor. The average effect size was estimated to be
.63 (or .56 in terms of correlation). The coefficient associ-ated with dummy-coded test type (SAT or ACT) was not significantly different from zero, meaning there is no test-type related difference on the effect size associated with the MFTB-SAT/ACT correlation. Again, the variance among these 22 studies was very small,x2(21)D10.91,p>.500,
so we determined that it was unnecessary to move forward with the analysis using the study characteristics as predic-tors added to Equation 2 (See Table 3).
SUMMARY AND DISCUSSIONS
In summary, the MFTB scores appeared to have a moderate level of correlation with GPA (.45), which suggests that the knowledge and skills measured by GPA are also likely to be captured by the MFTB scores to a reasonable extent (with about 20% variance being explained). It needs to be noted that there are several factors that were not considered when summarizing the MFTB-GPA correlations across studies. First, the correlations studied are attenuated because neither the MFTB nor GPA is perfectly reliable. The observed correlation between the MFTB and GPA (or an average estimate across many such correlations among different studies and institutions) is likely to be even higher if taking into account the measurement errors of each vari-able. Second, the GPA, regardless of which courses are included, are likely to have been affected by grade inflation issues as observed in other studies (Rojstaczer & Healy, 2010). A direct effect of grade inflation is that it leads to a smaller range of GPA and a smaller variance of the GPA as well, which in the literature is often called the range restric-tion issue. This range restricrestric-tion issue is also likely to result in an underestimation of the MFTB-GPA correlation. Both types of issues, if taken into account, would have resulted
TABLE 2
Hierarchical Linear Modeling Results for Correlations Between MFTB and GPA
Correlation Coefficient SE tratio df p
Correlation (MFTB-OGPA) Fixed effect
G10 dj(a) 0.44 0.47 0.08 5.86 11 .001
Random effect
u1(b) 0.004 0.00001 3.45(c) 11 >.500
Correlation (MFTB-OGPAnT) Fixed effect
G10 dj(a) 0.45 0.48 0.07 7.08 15 .001
Random effect
u1(b) 0.003 0.00001 3.91(c) 15
>.500
Correlation (MFTB-GPA) Fixed effect
G10 dj(a) 0.45 0.49 0.05 9.26 22 .001
Random effect
u1(b) 0.003 0.00001 6.58(c) 22
>.500
Note.(a)G10 dj is the parameter representing the fixed mean of correlation;
(b)
u1 is the parameter representing a random part of the correlation unique to individual studies;
(c)This is the chi-square value to test whether the variance was significantly different from zero. GPA
Dgrade point average; MFTBDMajor Field Test in Business; MGPADmajor course–related grade point average; OGPADgrade point average; OGPAnTDoverall grade point average that excludes the trans-ferred credit.
in a greater MFTB-GPA correlation, which would provide even stronger support to the validity claim for using the MFTB as an outcomes assessment.
Although both GPA and other standardized test (i.e., SAT and ACT) scores correlated moderately with the MFTB scores, caution is needed when trying to interpret them, as the same or similar coefficient values estimated may have different meanings. First, the ACT and SAT nec-essarily happen before college admission, which is about three to five years earlier than when the MFTB is taken. It seems hardly a convincing argument that the content or construct measured can be carried over for such a long period of time, amid other changes such as the teaching and learning environment. It seems likely that the shared var-iances between the SAT/ACT and MFTB are affected by two sources: the same measurement method using the mul-tiple-choice items and the similar types of reasoning ability required to answer questions. On the other hand, the GPA consist of ratings and grades provided by multiple faculty members for about two dozen (or more) different business and nonbusiness courses. They seem to be more compre-hensive representations of students’ college performance and learning outcomes, beyond the abilities and skills that are measured by the SAT and ACT. Thus, the shared vari-ance between the GPA and MFTB are more likely to be related to the critical skills and knowledge that students have gained during the college business program. Future research may be necessary to control for students’ admis-sion test scores on the SAT and ACT and examine how much extra variance in GPA could be accounted for by the MFTB scores. This type of analysis would help to disentan-gle the relationships among the three variables and help to obtain cleaner and more robust evidence in support of the use of MFTB as an outcomes assessment.
The little variance that was found among the studies in terms of the MFTB-OGPA correlation was different from
meta-analysis studies on the relationship between standard-ized test scores and college GPAs, which seems desirable to have further studies to confirm such findings.
To conclude, based on a review studies published in the last two decades, we found that the MFTB scores are mod-erately correlated with the students’ college academic per-formance as indicated by GPA, which supports the claim that the MFTB is a viable measure of college business learning outcomes. This finding not only helps assure those programs that have already adopted and used the MFTB with regard to the appropriateness of using such a standard-ized test as a learning outcomes measure, but also provides empirical evidence and better inform the other programs that may consider using it in the near future.
Note
1. Two studies were related to the subscore issue; one was about using response time to detect test-taking motivation issues, and the fourth one was a rejoinder article in response to a article by an external researcher. Because these four articles had different objectives from the other studies, we excluded them in this review.
REFERENCES
Association of American Colleges & Universities. (2013).It takes more than a major: Employer priorities for college learning and student suc-cess. Washington, DC: Hart Research Associates. Retrieved from http:// www.aacu.org/publications-research/periodicals/it-takes-more-major-employer-priorities-college-learning-and
Association to Advance Collegiate Schools of Business (AACSB). (2013).
2013 business accreditation standards. Retrieved from http://www. aacsb.edu/accreditation/standards/2013-business/.
TABLE 3
Hierarchical Linear Modeling Results for Correlations Between MFTB and SAT/ACT
Correlation Coefficient SE tratio df p
Correlation (MFTB-ACT) Fixed effect
G10 dj(a) 0.52 0.58 0.07 8.86 15 .001
Random effect
u1(b) 0.004 0.00001 7.99(c) 15
>.500
Correlation (MFTB-SAT) Fixed effect
G10 dj(a) 0.63 0.74 0.1 7.22 5 .001
Random effect
u1(b) 0.003 0.00001 1.2(c) 5
>.500
Correlation (MFTB-ACT/SAT) Fixed effect
G10 dj(a) 0.56 0.63 0.06 11.35 21 0.001
Random effect
u1(b) 0.004 0.000001 10.91(c) 21 >.500
Note.(a)G10 dj is the parameter representing the fixed mean of correlation;
(b)u1 is the parameter representing q random part of the correlation unique to individual studies;
(c)This is the chi-square value to test whether the variance was significantly different from zero. MFTBDMajor Field Test in Business.
440 G. LING ET AL.
Barak, R. J. (1977). Program reviews by statewide agencies. In J. K. Folger (Ed.),Increasing the public accountability of higher education(pp. 67– 90). San Francisco, CA: Jossey-Bass.
Bielinska-Kwapisz, A., Brown, F. W., & Semenik, R. J. (2012). Is higher better? Determinants and comparisons of performance on the major field test-business.Journal of Education for Business,87, 159–169. Black, T., & Duhon, D. (2003). Evaluating and improving student
achieve-ment in business programs: The effective use of standardized assessachieve-ment tests.Journal of Education for Business,79, 90–98.
Burton, N. W., & Ramist, L. (2001).Predicting success in college: SAT studies of classes graduating since 1980 (Research Report 2001–2). New York, NY: College Entrance Examination Board.
Educational Testing Service (ETS). (2014a).Major field test for a bach-elor’s degree in business. Retrieved from https://www.ets.org/mft/ about/content/bachelor_business
Educational Testing Service (ETS). (2014b). 2014 comparative data guide–MFT for business institution list. Retrieved from https://www.ets. org/s/mft/pdf/acdg_business.pdf
Ewell, P. T. (1987).Assessment, accountability and improvement: Managing the contradiction. Washington, DC: American Association for Higher Education. Folger, J. K. (1977).Increasing the public accountability of higher
educa-tion. San Francisco, CA: Jossey-Bass.
Green, J. J., Stone, C. C., & Zegeye, A. (2012).The major field test in busi-ness: A pretend solution to the real problem of assurance of learning assessment(Working Paper Series, Ball State University, Miller College of Business; 201201). Retrieved from http://www.econbiz.de/en/search/ detailed-view/doc/all/the-major-field-test-in-business-a-pretend-solution -to-the-real-problem-of-assurance-of-learning-assessment-green-jeffrey/ 10009658079/?no_cacheD1
Hafdahl, A. R., & Williams, M. A. (2009). Meta-analysis of correlations revisited attempted replication and extension of fields 2001 simulation studies.Psychological Methods,14, 24–42.
Hedges, L. V., & Vevea, J. L. (1998). Fixed and random effects models in meta-analysis.Psychological Methods,3, 486–504.
Kimmell, S. L., Marquette, R. P., & Olsen, D. H. (1998). Outcomes assess-ment programs: Historical perspective and state of the art [Electronic version].Issues in Accounting Education,55, 851–868.
Klein, S. P., Kuh, G. D., Chun, M., Hamilton, L., & Shavelson, R. (2005). An approach to measuring cognitive outcomes across higher education institutions.Research in Higher Education,46, 251–276.
Ling, G. (2014).Repurposing a business learning outcomes assessment to college students outside of the United States: Validity and reliability evi-dence(ETS Research Report RR 14–02). Princeton, NJ: Educational Testing Service.
Martell, K. (2007). Assessing student learning: Are business schools mak-ing the grade?Journal of Education for Business,82, 189–211. Means, B., Toyama, Y., Murphy, R., Bakia, M., & Jones, K. (2009).
Evalu-ation of evidence-based practices in online learning studies. Washing-ton, DC: U.S. Department of Education, Office of Planning, Evaluation, and Policy Development.
Messick, S. (1989). Meaning and values in test validation: The science and ethics of assessment.Educational Researcher,18(2), 5–11.
Nichols, K. W., & Nichols, J. O. (2000).The department head’s guide to implementation in administrative and educational support units. Edison, NJ: Agathon.
O’Neal, K. (2009). The comparison between synchronous online dis-cussion and traditional classroom disdis-cussion in an undergraduate education course. Journal of Online Learning and Teaching, 5, 88–96.
Palomba, C. A., & Banta, T. W. (1999).Assessment essentials: Planning, implementing, and improving assessment in higher education. Higher and Adult Education Series. San Francisco, CA: Jossey-Bass.
Peterson, M. W., Erwin, J. M., & Wilson, R. (1977). State performance based budgeting. In J. K. Folger (Ed.), Increasing public accountability in higher education (vol. 4[A], pp. 1–34). New York, NY: Wiley (New Directions for Institutional Research).
Prentice, M., & Robinson, G. (2010).Improving student learning outcomes with service learning. Washington, DC: American Association of Com-munity Colleges.
Pringle, C., & Michel, M. (2007). Assessment practices in AACSB-accredited business schools. Journal of Education for Business, 82, 202–211.
Raudenbush, S. W., & Bryk, A. S. (2002).Hierarchical linear models: Applications and data analysis methods(2nd ed.). Thousand Oaks, CA: Sage Publications.
Rojstaczer, S., & Healy, C. (2010). Grading in American colleges and uni-versities.Teachers College Record, 15928.
Shaftel, J., & Shaftel, T. L. (2007). Educational assessment and the AACSB.Issues in Accounting Education,22, 215–232.
Stricker, L. J., Rock, D. A., Burton, N. W., Muraki, E., & Jerele, T. J. (1994). Adjusting college grade point average criteria for variations in grading standards: A comparison of methods.Journal of Applied Psy-chology,79, 178–183
U.S. Department of Education. (2006).A test of leadership: Charting the future of U.S. higher education. Washington, DC: Author.
Zwick, R. (2007).College admission testing(White Paper). Arlington, VA: National Association for College Admission Counseling.
APPENDIX: LIST OF PAPERS INCLUDED IN THE HLM ANALYSIS
Bagamery, B. D., Lasik, J. L., & Nixon, D. R. (2005). Determinants of suc-cess on the ETS Business Major Field Exam for Students in an under-graduate multisite regional university business program. Journal of Education for Business,81(1), 55–63.
Barboza, G. (2012). Linking course-embedded assessment measures and performance on the Educational Testing Service Major Field Test in Business.Journal of Education for Business,87, 102–111.
Bean, D. F., & Bernadi, R. A. (2002). Performance on the Major Field Test in Business: The explanatory power of SAT scores and gender.Journal of Private Enterprise,17, 172–178.
Bielinska-Kwapisz, A., & Brown, F. W. (2012). The impact of intellectual heterogeneity on academic performance in business education.Research in Higher Education Journal,16, 1–15.
Bielinska-Kwapisz, A., & Brown, F. W. (2013). Differential gender perfor-mance on the Major Field Test-Business.Journal of Education for Busi-ness,88, 159–166.
Bielinska-Kwapisz, A., Brown, F. W., & Semenik, R. J. (2012a). Is higher better? Determinants and comparisons of performance on the Major Field Test-Business.Journal of Education for Business,87, 159–169.
Bielinska-Kwapisz, A., Brown, F. W., & Semenik, R. J. (2012b). Interpret-ing standardized assessment test scores and settInterpret-ing performance goals in the context of student characteristics: The case of the Major Field Test in Business.Journal of Education for Business,87, 7–13.
Black, T., & Duhon, D. (2003). Evaluating and improving student achieve-ment in business programs: The effective use of standardized assessachieve-ment tests.Journal of Education for Business,79, 90–98.
Bycio, P., & Allen, J. (2007). Factors associated with performance on the Educational Testing Service (ETS) Major Field Achievement Test in Business (MFAT-B).Journal of Education for Business,82, 196–201. Chowdhury, M. I., & Wheeling, B. (2013). Determinants of Major Field Test
(MFT) score for graduating seniors of a business school in a small Midwest-ern university.Academy of Educational Leadership Journal,17, 59–71. Contreras, S., Badua, F., Chen, J., & Adrian, M. (2011). Documenting and
explaining Major Field Test results among undergraduate students. Jour-nal of Education for Business,86, 64–70.
Cox, S. S., Chen, J. S., & Totten, J. (2011). Is it more than just GPA? An examination of work experience and test preparation on MFT-B scores.
Journal of Academic Administration in Higher Education,7, 53–58.
Finnegan, B. R. (2012).Estimating the impact of distance education on student learning outcomes using the ETS Major Field Test in Business
(Doctoral dissertation). Temple University, Philadelphia, PA. Retrieved on March 30,2014, from http://digital.library.temple.edu/cdm/ref/collec tion/p245801coll10/id/164617
Hahn, W., Bowlin, L., & Welch, T. (2011). Outcomes assessment: An examination of the ETS Major Field Test and the comprehensive busi-ness exam.Assessment & Evaluation in Higher Education,37, 259–271. Jones, P. M., Weimer, D., & Herzer, K. (2001). Comparison of traditional and nontraditional (adult education) undergraduate business programs.
Journal of Instructional Psychology,28, 161–170.
Lapinska-Schneider, K. (2010).ACT scores as predictors of success: A correlation study between ACT scores and the Lindenwood University Business Capstone Course(dissertation). ProQuest LLC.
Lee, J., & Anantharaman, S. (2008). Using externally developed standardized tests to control grade inflation.Review of Business Research,8, 79–87. Mason, P. M., Coleman, B. J., Steagall, J., Gallo, A., & Fabritius, M.
(2011). The use of the ETS Major Field Test for assurance of business content learning: Assurance of waste?Journal of Education for Busi-ness,86, 71–78.
Mirchandani, D., Lynch, R., & Hamilton, D. (2001). Using the ETS Major Field Test in Business: Implications for assessment,Journal of Educa-tion for Business,77, 51–56.
Rook, S. P., and Tanyel, F. I. (2009). Value-added assessment using the Major Field Test in Business.Academy of Educational Leadership Jour-nal,13, 87–94.
Settlage, D. M., & Settlage, L. A. (2011). A statistical framework for assessment using the ETS Major Field Test in Business.Journal of Edu-cation for Business,86, 274.
Terry, N., Mills, L., Rosa, D., & Sollosy, M. (2009). Do online students make the grade on the business major field ETS exam?Academy of Edu-cational Leadership Journal,13, 109–118.
Terry, N., Mills, L., & Sollosy, M. (2008). Student grade motivation as a determinant of performance on the business major field ETS exam. Jour-nal of College Teaching & Learning,5(7), 27–32.
Thornton, B., & Arbogast, G. (2012). Analyzing Educational Testing Ser-vice Graduate Major Field Test results.American Journal of Business Education,5, 531–538.
Walstad, W., & Allgood, S. (1999). What do college seniors know about economics? (MFT)American Economic Review,89, 350–354. Ward, C., Yates, D., & Song, J. S. (2009). Exploring the relationship
between student engagement and common business knowledge: A pilot study. American Journal of Business Education, 2(9), 99– 108.
Ward, C., Yates, D., & Song, J. S. (2010). Examining the relationship between the national survey of student engagement and the ETS Busi-ness Major Field Test.American Journal of Business Education,3(12), 33–39.
Ward, C., Yates, D., & Song, J. S. (2012). Blending research and teamwork to enhance undergraduate education: Results from National Survey of Student Engagement and Business ETS Major Field Test.American Journal of Business Education,5(3). 325–330.
Word, W. R., Rook, S. P., & Lancaster, L. M. (2011). An assessment note on the utilization of the Major Field Test in Business.B>Quest, 1–13.
Zeis, C., Waronska, A. K., & Fuller, R. (2009). Value-added program assessment using nationally standardized tests: Insights into internal validity issues.Journal of Academy of Business and Economics,9, 114– 130.
442 G. LING ET AL.