RESEARCH PAPER
Development of a model of the tobacco industry’s
interference with tobacco control programmes
W M K Trochim, F A Stillman, P I Clark, C L Schmitt
. . . .
Tobacco Control 2003;12:140–147
Objective:To construct a conceptual model of tobacco industry tactics to undermine tobacco control programmes for the purposes of: (1) developing measures to evaluate industry tactics, (2) improving tobacco control planning, and (3) supplementing current or future frameworks used to classify and ana-lyse tobacco industry documents.
Design:Web based concept mapping was conducted, including expert brainstorming, sorting, and rating of statements describing industry tactics. Statistical analyses used multidimensional scaling and cluster analysis. Interpretation of the resulting maps was accomplished by an expert panel during a face-to-face meeting.
Subjects:34 experts, selected because of their previous encounters with industry resistance or because of their research into industry tactics, took part in some or all phases of the project.
Results: Maps with eight non-overlapping clusters in two dimensional space were developed, with importance ratings of the statements and clusters. Cluster and quadrant labels were agreed upon by the experts.
Conclusions:The conceptual maps summarise the tactics used by the industry and their relationships to each other, and suggest a possible hierarchy for measures that can be used in statistical modelling of industry tactics and for review of industry documents. Finally, the maps enable hypothesis of a likely progression of industry reactions as public health programmes become more successful, and therefore more threatening to industry profits.
A
substantial peer reviewed literature exists describing the great variety of strategies and tactics the tobacco indus-try uses to undermine public health. A good deal of this work has documented, at least qualitatively, the tobacco industry’s specific actions to prevent or undermine tobacco control programmes and organisations.1–10The tobacco indus-try has been concerned that large scale, comprehensive tobacco control programmes would reduce smoking and thus reduce profits.11 12
A prime example of a programme that the industry perceived as a threat was the American Stop Smoking Intervention Study (ASSIST)13 14
which was the first, large multi-state initiative (1991 to 1999) that sought to reduce tobacco use by changing the sociopolitical environment through media and policy advocacy, and the development of state infrastructure to deliver tobacco control.15
Given its scope, it is not surprising that ASSIST caught the attention of the tobacco industry. For example, Andrew H Tisch, then chairman and CEO of Lorillard Tobacco Company, delivered a speech in 1992 that described how threatening the ASSIST programme was to the industry.16
A major purpose of the ASSIST project was the evaluation of its effects. Detailed measures were collected on both the pro-grammes (including the capacity, resources, and efforts involved in implementing the various programme compo-nents) and outcomes (both intermediate and long term). However, because of the presence of the industry, tobacco control programmes cannot be evaluated like most other pro-grammes. While local, state, and federal governments are expending resources to reduce smoking rates and promote tobacco control, the tobacco industry is expending significant resources to promote sales of their product, influence govern-ments, and undermine these programmes. The industry’s anti-tobacco control efforts constitute a countervailing force to tobacco control programmes that needs to be considered when evaluating programme effectiveness since industry efforts could actually swamp any impact coming from these
programmes, reduce measurable outcomes, and lead to an underestimation and devaluation of the impact and effective-ness of tobacco control efforts.
The ASSIST evaluation was the first major tobacco control evaluation to hypothesise a relationship between the indus-try’s anti-tobacco control efforts and the programme.17
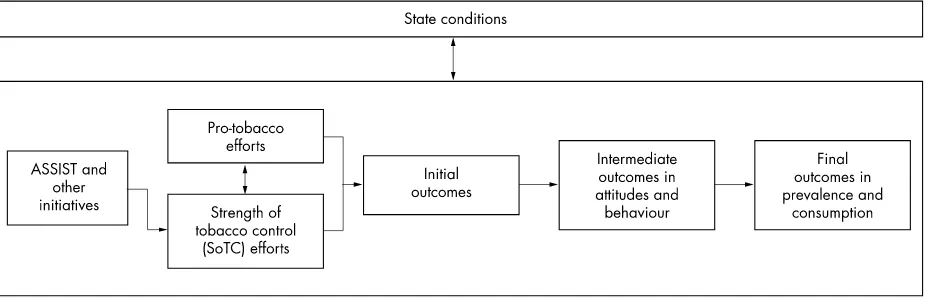
ASSIST included the construct of pro-tobacco efforts in the overall evaluation model (fig 1). However, before this construct can be operationalised, it needs to be conceptualised well. Categoris-ing the dimensions of anti-tobacco control tactics and building a comprehensive model of these actions is a necessary first step toward development of measurable components and indices that can be used in programme evaluation. While originating in connection with the ASSIST initiative, this problem of accounting for industry counter-efforts is not limited to that context alone, but is of relevance in the evaluation of any tobacco control programme.
Currently, there is no overarching conceptual model that could guide operationalisation of measures of industry tactics that might be useful for evaluation. Outside of the informal and anecdotal literature on specific industry tactics, about the clos-est thing to a current standardised framework that might be applicable for describing industry tactics is the UCSF/ANRF Tobacco Documents Thesaurus, a detailed glossary of terms used to index tobacco industry documents.18
However, the The-saurus was not designed to provide a conceptual framework for tobacco industry tactics. It is essentially a vocabulary of stand-ard subject terms, or keywords, used to index and describe all documents in the tobacco control field.19 20
While essential for document research, it has little utility for operationalising measures of industry tactics.
. . . .
Abbreviations:ASSIST, American Stop Smoking Intervention Study; MDS, multidimensional scaling; UCSF/ANRF, University of California San Francisco/American Nonsmokers Rights Foundation
This paper describes the development of a comprehensive conceptual map of the tactics that the tobacco industry uses to undermine tobacco control efforts. The resulting conceptual map, developed in the context of the ASSIST evaluation, has utility beyond that context for the development of measures for programme evaluation, for improving strategic level tobacco control programme planning, and for informing cur-rent or future frameworks used to classify and analyse tobacco industry documents.
METHODS
The concept mapping methodology21
was used to develop the conceptual model of pro-tobacco tactics. Concept mapping is a participatory mixed methods approach that integrates group process activities (brainstorming, unstructured pile sorting, and rating of the brainstormed items) with several multivari-ate statistical analyses (multidimensional scaling and hierar-chical cluster analysis) to yield both statistical and graphic representations of a conceptual domain.
Participants
The participants were selected because they had previously encountered overt industry resistance to tobacco control programming and/or research, had published research arising from searches of the industry documents, or had otherwise demonstrated understanding of industry challenges to tobacco control. Among those represented, all were from the USA, 15 were academics, seven represented advocacy organisations, seven contract research organisations, four government agen-cies, and five were from tobacco control funding organisations (classifications not mutually exclusive). All participants (n=34) utilised a web based program* to participate in the mapping process (brainstorming, or sorting and rating, or both). A subset of this group (n=13) participated in a face-to-face expert panel to interpret the results of the electronic mapping process.
Procedures
The general procedure for concept mapping is described in detail elsewhere.21 There were four distinct phases in the process: brainstorming, sorting and rating, data analyses and generation of the maps, and expert panel interpretation of the maps.
Brainstorming
The experts logged on to a private web page over a four week period. Each brainstormed statement was generated in
response to the prompt: “One specific activity/tactic the tobacco industry uses to oppose tobacco control is . . .” They entered the statements in a list without regard to structure, hierarchy, or clustering of statements. The process resulted in generation of 226 statements.
In preparation for the sorting and rating task, the 226 state-ments were edited and consolidated. The process used was one of grouping statements that were similar, then constructing one statement that captured the content of the group of ments. The goal was to have a set of mutually exclusive state-ments, with only one main idea in each, and with no loss of content from the original list. In this manner, the original 226 statements were consolidated into the final set of 88 statements.†
Sorting and rating
Twenty one of the experts were asked to log on to another web page for the sorting and rating tasks. Each conducted an unstructured sorting of the statements.22–24
They grouped the brainstormed statements into piles “in a way that makes sense to you”. The only restrictions in this sorting task were that each statement could not be its own pile, there could not be a pile consisting of all the statements, and there could be no “miscellaneous” pile (any item thought to be unique was to be put into its own pile). Each expert was asked to supply a brief label that summarised the contents of each of their groups/piles.
Each participant was then asked to rate the 88 statements with these instructions: “Rate each statement on a 1 to 5 scale for its relative importance in undermining tobacco control efforts. Use a 1 if the statement is relatively unimportant (compared to the rest of the statements) in undermining tobacco control efforts; use a 5 if it is extremely important. Although every statement probably has some importance (or it wouldn’t have been brainstormed), try to spread out your ratings and use each of the five rating values at least several times.”
Data analyses and generation of the maps
The analyses‡ began with construction from the sort information of a binary, symmetric matrix of similarities. For any two items, a 1 was assigned if the two items were placed in the same pile by the participant, otherwise a 0 was Figure 1 General conceptual model for the ASSIST evaluation.17
. . . .
*The Concept System Global©web software was used for all web
processes on this project. Further information on the software may be obtained from Concept Systems Inc, http://www.conceptsystems.com/
. . . .
†Detailed and intermediate results, including the original list of 226 brainstormed statements, can be obtained at http://omni.cornell.edu/ tactics/
‡All analyses were accomplished and results produced using the Concept System software, version 1.75. Further information on the software may be obtained from Concept Systems Inc, http://
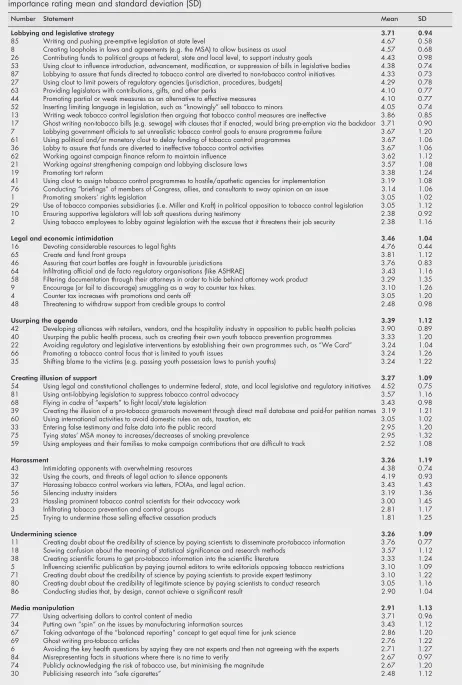
Table 1 Statement numbers, statements within clusters listed in descending order of average importance, and importance rating mean and standard deviation (SD)
Number Statement Mean SD
Lobbying and legislative strategy 3.71 0.94
85 Writing and pushing pre-emptive legislation at state level 4.67 0.58 8 Creating loopholes in laws and agreements (e.g. the MSA) to allow business as usual 4.57 0.68 26 Contributing funds to political groups at federal, state and local level, to support industry goals 4.43 0.98 53 Using clout to influence introduction, advancement, modification, or suppression of bills in legislative bodies 4.38 0.74 87 Lobbying to assure that funds directed to tobacco control are diverted to non-tobacco control initiatives 4.33 0.73 27 Using clout to limit powers of regulatory agencies (jurisdiction, procedures, budgets) 4.29 0.78 63 Providing legislators with contributions, gifts, and other perks 4.10 0.77 44 Promoting partial or weak measures as an alternative to effective measures 4.10 0.77 52 Inserting limiting language in legislation, such as “knowingly” sell tobacco to minors 4.05 0.74 13 Writing weak tobacco control legislation then arguing that tobacco control measures are ineffective 3.86 0.85 17 Ghost writing non-tobacco bills (e.g. sewage) with clauses that if enacted, would bring pre-emption via the backdoor 3.71 0.90 7 Lobbying government officials to set unrealistic tobacco control goals to ensure programme failure 3.67 1.20 61 Using political and/or monetary clout to delay funding of tobacco control programmes 3.67 1.06 36 Lobby to assure that funds are diverted to ineffective tobacco control activities 3.67 1.06 62 Working against campaign finance reform to maintain influence 3.62 1.12 21 Working against strengthening campaign and lobbying disclosure laws 3.57 1.08
19 Promoting tort reform 3.38 1.24
41 Using clout to assign tobacco control programmes to hostile/apathetic agencies for implementation 3.19 1.08 76 Conducting “briefings” of members of Congress, allies, and consultants to sway opinion on an issue 3.14 1.06 1 Promoting smokers’ rights legislation 3.05 1.02 29 Use of tobacco companies subsidiaries (i.e. Miller and Kraft) in political opposition to tobacco control legislation 3.05 1.12 10 Ensuring supportive legislators will lob soft questions during testimony 2.38 0.92 2 Using tobacco employees to lobby against legislation with the excuse that it threatens their job security 2.38 1.16
Legal and economic intimidation 3.46 1.04
16 Devoting considerable resources to legal fights 4.76 0.44 65 Create and fund front groups 3.81 1.12 46 Assuring that court battles are fought in favourable jurisdictions 3.76 0.83 64 Infiltrating official and de facto regulatory organisations (like ASHRAE) 3.43 1.16 58 Filtering documentation through their attorneys in order to hide behind attorney work product 3.29 1.35 9 Encourage (or fail to discourage) smuggling as a way to counter tax hikes. 3.10 1.26 4 Counter tax increases with promotions and cents off 3.05 1.20 48 Threatening to withdraw support from credible groups to control 2.48 0.98
Usurping the agenda 3.39 1.12
42 Developing alliances with retailers, vendors, and the hospitality industry in opposition to public health policies 3.90 0.89 40 Usurping the public health process, such as creating their own youth tobacco prevention programmes 3.33 1.20 22 Avoiding regulatory and legislative interventions by establishing their own programmes such, as “We Card” 3.24 1.04 66 Promoting a tobacco control focus that is limited to youth issues 3.24 1.26 35 Shifting blame to the victims (e.g. passing youth possession laws to punish youths) 3.24 1.22
Creating illusion of support 3.27 1.09
54 Using legal and constitutional challenges to undermine federal, state, and local legislative and regulatory initiatives 4.52 0.75 81 Using anti-lobbying legislation to suppress tobacco control advocacy 3.57 1.16 68 Flying in cadre of “experts” to fight local/state legislation 3.43 0.98 39 Creating the illusion of a pro-tobacco grassroots movement through direct mail database and paid-for petition names 3.19 1.21 60 Using international activities to avoid domestic rules on ads, taxation, etc 3.05 1.02 33 Entering false testimony and false data into the public record 2.95 1.20 75 Tying states’ MSA money to increases/decreases of smoking prevalence 2.95 1.32 59 Using employees and their families to make campaign contributions that are difficult to track 2.52 1.08
Harassment 3.26 1.19
43 Intimidating opponents with overwhelming resources 4.38 0.74 32 Using the courts, and threats of legal action to silence opponents 4.19 0.93 37 Harassing tobacco control workers via letters, FOIAs, and legal action. 3.43 1.43 56 Silencing industry insiders 3.19 1.36 23 Hassling prominent tobacco control scientists for their advocacy work 3.00 1.45 3 Infiltrating tobacco prevention and control groups 2.81 1.17 25 Trying to undermine those selling effective cessation products 1.81 1.25
Undermining science 3.26 1.09
11 Creating doubt about the credibility of science by paying scientists to disseminate pro-tobacco information 3.76 0.77 18 Sowing confusion about the meaning of statistical significance and research methods 3.57 1.12 38 Creating scientific forums to get pro-tobacco information into the scientific literature 3.33 1.24 5 Influencing scientific publication by paying journal editors to write editorials opposing tobacco restrictions 3.10 1.09 71 Creating doubt about the credibility of science by paying scientists to provide expert testimony 3.10 1.22 80 Creating doubt about the credibility of legitimate science by paying scientists to conduct research 3.05 1.16 86 Conducting studies that, by design, cannot achieve a significant result 2.90 1.04
Media manipulation 2.91 1.13
entered.23
The total similarity matrix was obtained by summing across the individual matrices. Thus, any cell in this matrix could take integer values between 0 and 22 (the number of people who sorted the statements); the value indi-cates the number of people who placed the pair in the same pile. In addition, in this analysis the final matrix was filtered by changing any matrix values of 1 to a 0. In effect, this means that there needed to be at least two participants who place any two statements together in order for them to be considered at all similar. This filtering helps minimise the effects of any errors or spuriousness in sorting on the final results.
The total similarity matrix was analysed using non-metric multidimensional scaling (MDS) analysis25with a two dimen-sional solution. The solution was limited to two dimensions because of ease of use considerations.26
The x,y configuration output from MDS was the input for the hierarchical cluster analysis utilising Ward’s algorithm27
as the basis for defining a cluster. Using the MDS configuration as input to the cluster analysis in effect forces the cluster analysis to partition the MDS configuration into non-overlapping clusters in two dimensional space. There is no simple mathematical criterion by which a final number of clusters can be selected. The procedure followed here was to examine an initial cluster solution that was the maximum thought desirable for interpretation in this context. Then, suc-cessively lower cluster solutions were examined, with a judg-ment made at each level about whether the merger seemed substantively reasonable.
The MDS configuration of the statement points was graphed in two dimensions. This “point map” displayed the location of all the brainstormed statements with statements closer to each other generally expected to be more similar in meaning. A “cluster map” was also generated that displayed the original statement points enclosed by polygon shaped boundaries that depict the clusters.
The 1 to 5 importance rating variable was averaged across persons for each item and each cluster. This rating infor-mation was first depicted graphically in a “point rating map” showing the original point map with the average rating per item displayed as vertical columns in the third dimension and, second, in a “cluster rating map” that showed the cluster average rating using the third dimension.
Expert panel interpretation of the maps
A panel of 13 tobacco control experts who were members of the larger group was convened for a face-to-face meeting to review and interpret the results of the mapping process. The interpretation session followed a structured process described in detail in Trochim.21
Participants examined the maps to determine whether they made intuitive sense and to discuss what the maps might imply about the ideas that underlie their conceptualisation. They discussed each cluster until a consen-sus was reached on an acceptable cluster label. Participants then examined the labelled cluster map to identify any inter-pretable groups of clusters or “regions”. These were discussed and partitions drawn on the map to indicate the different regions. Just as in labelling the clusters, the group then arrived at a consensus label for each of the identified regions. This step-by-step interpretation culminated in a discussion of the overall meaning of the various maps and representations, and in the articulation of a conceptual model of pro-tobacco tactics.
RESULTS
The usual statistic that is reported in MDS analyses to indicate the goodness-of-fit of the two dimensional configuration to the original similarity matrix is called the “stress value”. A lower stress value indicates a better fit. In a study of the reli-ability of concept mapping, Trochim reported that the average stress value across 33 projects was 0.285 with a range from 0.155 to 0.352.28
The stress value in this analysis was 0.237, which is better (that is, lower) than average.
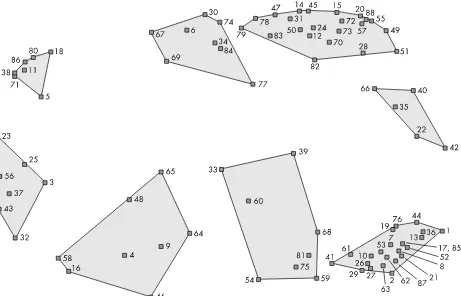
The pattern of judgments of the suitability of different clus-ter solutions was examined and resulted in acceptance of an eight cluster solution as the one that both preserved the most detail and yielded substantively interpretable clusters of statements. The 88 statements are shown in table 1 in descending order by average importance within the eight clusters, along with their standard deviations. The point clus-ter map in fig 2 shows all of the pro-tobacco tactics statements (points) in relation to each other.
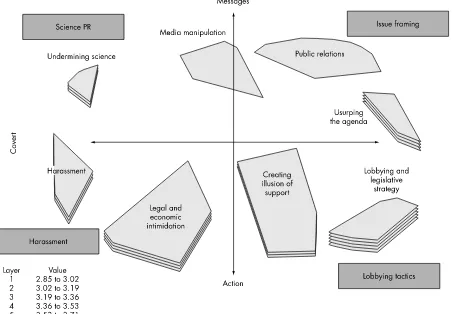
Figure 3 shows the cluster rating map where the layers of each cluster depict the average importance rating, with more layers equivalent to higher importance. Note that the average represented by the layers in the map is actually a double
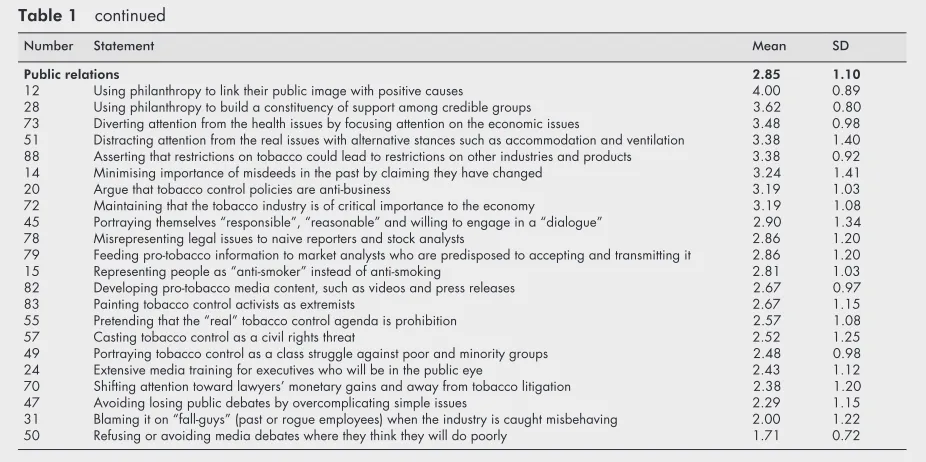
Table 1 continued
Number Statement Mean SD
Public relations 2.85 1.10
12 Using philanthropy to link their public image with positive causes 4.00 0.89 28 Using philanthropy to build a constituency of support among credible groups 3.62 0.80 73 Diverting attention from the health issues by focusing attention on the economic issues 3.48 0.98 51 Distracting attention from the real issues with alternative stances such as accommodation and ventilation 3.38 1.40 88 Asserting that restrictions on tobacco could lead to restrictions on other industries and products 3.38 0.92 14 Minimising importance of misdeeds in the past by claiming they have changed 3.24 1.41 20 Argue that tobacco control policies are anti-business 3.19 1.03 72 Maintaining that the tobacco industry is of critical importance to the economy 3.19 1.08 45 Portraying themselves “responsible”, “reasonable” and willing to engage in a “dialogue” 2.90 1.34 78 Misrepresenting legal issues to naive reporters and stock analysts 2.86 1.20 79 Feeding pro-tobacco information to market analysts who are predisposed to accepting and transmitting it 2.86 1.20 15 Representing people as “anti-smoker” instead of anti-smoking 2.81 1.03 82 Developing pro-tobacco media content, such as videos and press releases 2.67 0.97 83 Painting tobacco control activists as extremists 2.67 1.15 55 Pretending that the “real” tobacco control agenda is prohibition 2.57 1.08 57 Casting tobacco control as a civil rights threat 2.52 1.25 49 Portraying tobacco control as a class struggle against poor and minority groups 2.48 0.98 24 Extensive media training for executives who will be in the public eye 2.43 1.12 70 Shifting attention toward lawyers’ monetary gains and away from tobacco litigation 2.38 1.20 47 Avoiding losing public debates by overcomplicating simple issues 2.29 1.15 31 Blaming it on “fall-guys” (past or rogue employees) when the industry is caught misbehaving 2.00 1.22 50 Refusing or avoiding media debates where they think they will do poorly 1.71 0.72
averaging—across all of the participants and across all of the factors in each cluster. Consequently, even slight differences in averages between clusters are likely to be meaningfully inter-pretable. The map shows that clusters along the bottom are judged more important in undermining anti-tobacco efforts.
Expert panel interpretation
The expert panel interpreted the map and table in terms of several interesting patterns. The four clusters across the top were thought to describe the messages that the tobacco industry issues or tries to control—what the tobacco industry says. This includes attempts to undermine science and legiti-mate messages from scientific quarters (Undermining sci-ence), the manipulation of the media (Media manipulation), the industry’s public relations efforts (Public relations), and the tactics they use to gain control of the public agenda (Usurping the agenda). The four clusters across the bottom describe industry actions—what the tobacco industry does. This includes lobbying efforts (Lobbying and legislative strat-egy), the use of front groups and artificially created “grassroots” movements (Creating the illusion of support), intimidation (Legal and economic intimidation), and harass-ment of tobacco control professionals (Harassharass-ment).
The participants also interpreted a horizontal dimensional-ity. Toward the left on the map are clusters that represent tac-tics that are more hidden or covert in nature. On the right are tactics that tend to be more overt or public in nature. The dimensional interpretation is not meant to suggest that any cluster would be exclusively classifiable into one or the other extreme on a dimension. Undermining science is not exclusively Covert, while Lobbying and legislative strategy is not exclusively public. The relational nature of the map suggests that the clusters vary along the public-covert and message-action dimensions with varying levels of each end point present in each cluster.
Members of the expert panel then suggested that the two dimensions can be viewed as forming four quadrants based on the 2×2 combination of these dimensions and provided a short label for each quadrant: Public + Messages = Issue framing; Public + Action = Lobbying tactics; Covert + Messages = Science PR (public relations); and Covert + Action = Harassment.
Finally, the expert panel discussed these dimensionalities and agreed upon a final labelling for all areas of the map. These features are all depicted in fig 3.
DISCUSSION
The primary purpose of this project was the development of a conceptual framework that describes the tactics the tobacco industry uses to undermine tobacco control programmes. Such a framework may be used in a variety of ways. Here, we discuss the potential utility of the framework for evaluation measurement development, strategic planning, and to support efforts to classify and analyse tobacco industry documents.
Use in measurement development
Figure 3 could be used as the basis for the development of an index of tobacco tactics. To do so would require that each of the clusters be operationalised. The statements within each cluster suggest potential elements that might be measured as part of the index. For instance, one statement in the cluster Lobbying and legislative strategy was “Promoting smokers’ rights legislation”. This could be operationalised at the state level as the number of proposed bills or a measure of the amount of relevant legislative committee activity. Another statement was “Lobby to assure that funds are diverted to ineffective tobacco control activities”. Here, measures of tobacco control programme funding and evidence of lobbying activities might be utilised. In this manner, the statements in each cluster can act as prompts or suggestions for potential operationalisations.
In addition, the overall structure of the map suggests how such an index might be aggregated. For instance, sub-index scores for the clusters Public relations and Usurping the agenda can be aggregated into a total score that represents Issue framing. Moving one level up the hierarchy, the four sub-index scores that represent the quadrants can be aggregated into an overall index of Pro-tobacco tactics.
We know from the map results that the expert panel did not view all of the tactics as equally important. This importance rating information can be incorporated into the development of an index such that sub-index scores for each cluster are weighted by the average importance and the final index aggregation weighted by quadrant importance averages.
Use in tobacco control planning
The conceptual map can provide a high level strategic view of industry tactics that can help tobacco control planners better anticipate the tactics that the industry might use in certain circumstances. For instance, a potentially useful aspect of the map that surfaced in the interpretation can be seen as one moves from the right to the left side. The overt public industry tactics on the right of the map tend to be ongoing activities that the industry does routinely. Like virtually all other major industries, the tobacco industry has ongoing public relations and lobbying efforts as suggested in the clusters on the right. But, how does the industry change its tactics in response to the perceived threat of increasing tobacco control efforts? The map and the expert panel suggested that they probably do so by moving from upper right toward lower left. Initially they most likely augment their public relations and lobbying efforts. If the tobacco control efforts become salient enough, the map suggests that the industry will be pressured increas-ingly to the more covert activities on the left side that include undermining science, legal and economic intimidation, and harassment.
The map thus provides a high level strategic model of the industry’s response to increased tobacco control efforts. This model can be used in tobacco control planning to better anticipate what the industry may do next.
Use in tobacco document analysis
The conceptual framework can be used for classifying industry documents specifically with respect to industry tactics and, as such, would augment and extend existing document classifi-cation and indexing procedures like the UCSF/ANRF Tobacco Documents Thesaurus. For example, each document could be classified for its relevance to the eight cluster areas. Once done, it would be immediately possible to retrieve all documents that provide evidence for a particular type of tactic (for example, cluster), or display all documents that reflect a broader cross-cutting (for example, a column category like “covert”) activity on the part of the industry.
For example, consider the cluster Creating illusion of support in the lower part of the map. The statements in that cluster (table 1) indicate several key sub-topics that are relevant and could help guide both the searching and classify-ing of documents.
For instance, for the statement “Creating the illusion of a pro-tobacco grassroots movement through direct mail data-base and paid-for petition names”, one document identified as relevant is a 1994 Philip Morris presentation that described their efforts to create the illusion of support: “We also are mobilising support among our consumers. Consumers who respond to our brand promotions receive an insert with their fulfillment packages . . .so far, more than 400,000 consumers have responded, and the programme has generated some 80,000 letters to Capital Hill, about 10,000 per month.”29
which states that “as a Brown&Williamson employee, you
can play a major role in influencing elections, the future of our business and, of course, our respective jobs” by “making con-tributions to the B&W Employee Political Action Committee”.
The letter discusses previous contribution levels for 1996 and options for method of contributing (payroll deductions or per-sonal checks) and asks for a $200 contribution from each eli-gible participant.30
Or, for the statement “Flying in cadre of ‘experts’ to fight local/state legislation”, a 1993 Philip Morris document describes the objective “to support the defeat of unwarranted smoking restrictions and to discourage unfair discrimination against smokers”. Goals and tactics were: “promotion of ETS in the context of indoor air quality and use of experts to directly and indirectly influence legislation, rule-making and standards in relation to ETS and workplace smoking issues.”31
These examples are meant to illustrate how the conceptual map can be used both as a suggestive device when searching the documents and as an expert derived hier-archical thematic taxonomy of pro-tobacco tactics that can be useful in coding and organising the documents subsequently identified.
Another document related application would be to develop a cross referencing between the map categories and other classification systems such as the UCSF/ANRF Tobacco Docu-ments Thesaurus. For example, the Thesaurus includes the terms “lobbying”, “industry front group”, and “industry sponsored research” which could be linked with the map cat-egories Lobbying and legislative strategy, Creating illusion of support, and Undermining science, respectively. This type of cross referencing would enable the tobacco documents to be accessed immediately through different conceptual schema that were devised for different purposes, without having to reclassify all documents from scratch.
In addition to its use in addressing the three issues described above, the conceptual framework can act as an organising device that encourages greater synergy between the three activities. For example, if in a local context, tobacco control planners determine that the industry is likely to increase its efforts in creating the illusion of support in the immediate future, the planners could examine that cluster on the map to help determine the specific tactics the industry might use, to think about how to measure or track the indus-try’s effort in this area, and to access the tobacco document evidence relevant to that cluster that describes the history of similar activities in other contexts.
Additional work could enhance the utility of this frame-work for document analysis. In this study, participants were asked to brainstorm industry tactics from their point of view and in their own language. This creates, in effect, a map that is decidedly anti-tobacco in its perspective. But the tobacco documents themselves are generated from an opposing perspective, using euphemisms and industry code terms designed to portray their pro-tobacco efforts in a good public light. Where anti-tobacco researchers might, for instance, talk about the industry “paying scientists to conduct research to create doubt about legitimate science” (statement 80), it is unlikely that industry documents would describe their activi-ties in a similar manner. Document searches that rely directly on the language of the map are unlikely to be fruitful or get at the desired topics. This suggests that it would be useful to develop the type of cross referencing to the Thesaurus that was discussed above.
Finally, there were activities of the tobacco industry, such as manipulating product chemistry or price, that were not included in this map because the focus in this project was on specific activities/tactics the industry uses to undermine tobacco control programmes. The manipulation of chemistry or price were not perceived by participants as “tactics” for undermining tobacco control per se. Despite not being consid-ered industry tactics for undermining tobacco control programmes, the importance of these issues is undeniable and
they need to be addressed in comprehensive evaluations of tobacco control programmes.
Regardless of the real world potential uses for the conceptual map, the structure is an intriguing one in its own right. It summarises a very complex area concisely and provides a compelling theoretical model that needs to be tested and extended empirically in follow up work. Replica-tions of this study could be used to determine the reliability and generalisability of the model. In addition, the model is general enough at its highest level to be a potential framework that might be applied to understanding the tactics of other industries that attempt to undermine the legitimate work of public health programmes.
ACKNOWLEDGEMENTS
This article was supported by contract number N01-CP-95030 from the National Cancer Institute. Its contents are solely the responsibility of the authors and do not necessarily represent the official view of the National Cancer Institute.
. . . . Authors’ affiliations
W M K Trochim,Department of Policy Analysis & Management, Cornell University, Ithaca, New York, USA
F A Stillman,Institute of Global Tobacco Control, Johns Hopkins University, Baltimore, Maryland, USA
P I Clark, C L Schmitt,Battelle Memorial Institute, Centers for Public Health Research and Evaluation, Baltimore, Maryland, USA
REFERENCES
1Saloojee Y, Dagli E. Tobacco industry tactics for resisting public policy on health.Bull World Health Organ 2000;78:902–10.
2Glantz SA, Barnes DE, Bero L,et al. Looking through a keyhole at the tobacco industry.JAMA 1995;274:219–24.
3Cummings KM, Sciandra R, Gingrass A,et al. What scientists funded by the tobacco industry believe about the hazards of cigarette smoking. Am J Public Health 1991;81:894–6.
4Sweda ELJ, Daynard RA. Tobacco industry tactics.Br Med Bull 1996;52:183–92.
5Zeltner T, Kessler D, Martiny A,et al. Tobacco company strategies to undermine tobacco control activities at the World Health Organization. Geneva: World Health Organization, 2000. URL: http://
filestore.who.int∼who/home/tobacco/tobacco.pdf
6Samuels B, Glantz SA. The politics of local tobacco control.JAMA 1991;266:2110–7.
7Goldstein AO, Bearman NS. State tobacco lobbyists and organizations in the United States: crossed lines.Am J Public Health 1996;86:1137– 42.
8Jacobson PD, Wasserman J. The implementation and enforcement of tobacco control laws: policy implications for activists and the industry. Journal of Health Politics, Policy & Law 1999;24:567–98.
9Givel MS, Glantz SA. Tobacco lobby political influence on US state legislatures in the 1990s.Tobacco Control 2001;10:124–34. 10Traynor MP, Begay ME, Glantz SA. New tobacco industry strategy to
prevent local tobacco control.JAMA 1993;270:479–86.
11Aguinaga S, Glantz S. The use of public records acts to interfere with tobacco control.Tobacco Control 1995;4:222–30.
What this paper adds
A major challenge in evaluating tobacco control efforts is the need to measure tobacco industry counter-efforts and their effects. Currently, no overarching conceptual model exists to guide operationalisation of measures of industry tactics that might be useful for evaluation. This study used a web based multivariate concept mapping methodology with a panel of tobacco control experts to develop a con-ceptual model of the tobacco industry interference with tobacco control programmes.
12Bialous SA, Fox BJ, Glantz SA. Tobacco industry allegations of “illegal lobbying” and state tobacco control.Am J Public Health 2001;91:62–7. 13Author unknown. Synar/ASSIST Task Force. Philip Morris. 1993. Bates
No. 2023961347-1359 Accessed 1 November 2001. www.pmdocs.com <http://www.pmdocs.com> Merlo E. Vendor Conference Draft. Philip Morris Corporate Affairs. December, 1993. Draft speech. Bates No. 2040863440-3463.
14Author unknown. (ASSIST program and Synar Amendment to ADAMHA). July 1992. Philip Morris. Bates No. 2048621152-1175. Accessed 5 November 2001. URL: www.pmdocs.com
15Manley M, Lynn W, Epps R,et al. The American Stop Smoking Intervention Study for cancer prevention: an overview.Tobacco Control 1998;6(suppl 2):S5–11.
16Tisch AH. Lorillard article for NY Assoc. of Tobacco and Candy Distributors. Lorillard Tobacco Company.(1992) Bates No. 92761408-9. Accessed 5 August 2001. URL: http://www.lorillarddocs.com 17Stillman F, Hartman A, Graubard B,et al. The American Stop Smoking
Intervention Study: conceptual framework and evaluation design. Evaluation Review 1999;23:259–80.
18University of California San Francisco. URL: http:// www.library.ucsf.edu/tobacco/thesaurus.html
19Malone RE, Balbach ED. Tobacco industry documents: treasure trove or quagmire?Tobacco Control 2000;9:334–8.
20Glantz S. The truth about big tobacco in its own words.BMJ 2000;321:313–4.
21Trochim W. An introduction to concept mapping for planning and evaluation.Evaluation Program Planning 1989;12:1–16.
22Rosenberg S, Kim MP. The method of sorting as a data gathering procedure in multivariate research.Multivariate Behavioral Research 1975;10:489–502.
23Weller SC, Romney AK.Systematic data collection. Newbury Park, California: Sage Publications, 1988.
24Coxon APM. Sorting data: collection and analysis. Sage University Papers on Quantitative Applications in the Social Sciences, 07-127. Thousand Oaks, California: Sage Publications, 1999.
25Davison ML.Multidimensional scaling. New York: John Wiley and Sons, 1983.
26Kruskal JB, Wish M.Multidimensional scaling. Beverly Hills, California: Sage Publications, 1978.
27Everitt B.Cluster analysis, 2nd ed. New York: Halsted Press, a division of John Wiley and Sons, 1980.
28Trochim W. Reliability of concept mapping. Paper presented at the Annual Conference of the American Evaluation Association, Dallas, Texas, November 1993. Accessed 15 August 2001. URL: http://trochim.human.cornell.edu/research/reliable/reliable.htm 29Philip Morris. Final draft: EM presentation 30 March 1994. Philip
Morris. Bates No. 2024007084-7109. Accessed 21 August 2001. URL: http://www.pmdocs.com/
30Brown & Williamson. [Memo: Dear Fellow B&W Employee] Brown & Williamson, 13 February 1997. Bates No. 621960913. Accessed 15 August 2001. URL: http://www.bw.aalatg.com/public.asp 31Philip Morris. Public Smoking. Philip Morris, 1993. Bates No.