USDA Forest Service Technical Assistance Trip
Wami River Resource Assessment
Rapid Assessment of the Interdependence of the Wami River to the Ecosystems and Biodiversity of Saadani National Park, United Republic of Tanzania
Mission Dates: January 27 – February 10, 2007
Jason Gritzner Doreen Sumerlin
Hydrologist Wildlife Biologist
Idaho Panhandle National Forests Arapaho Roosevelt National Forest 1500 Highway 2, Suite 110 9 Tenmile Drive
Sandpoint ID 83864 Granby CO 80446
ACKNOWLEDGEMENTS
We would like to thank the Tanzania Coastal Management Partnership (TCMP) and the University of Rhode Island’s Coastal Resources Center (CRC) for the planning and logistical support of the team through all phases of this mission. Special thanks go to Catherine McNally for her unflagging enthusiasm, kindness and good humor during long, hot field days, as well as for providing GIS support; to Baraka Kalangahe for his endless coordination, courtesy, insightful translation, logistical support to the team in the field, and for keeping the team going with copious amounts of pineapple; and to Jacob Mlula and Ayubu Nanjale for outstanding driving skills on the tarmac and in the bush. We are also grateful to James Tobey for his work in organizing the mission details prior to the team’s arrival in the region.
We are also grateful for the courtesy, and valuable time and information provided us by Tanzania National Parks (TANAPA) and the Rangers and Wardens of Saadani National Park (SANAPA). Special thanks go to Park Ecologist, Halima Ramadhani, who accompanied us throughout our field investigation, and ensured that we were talking to the right people and visiting sites in and around the park that were critical to our mission.
LIST OF ACRONYMS
CRC Coastal Resources Center GDA Global Development Alliance
GIS Geographic Information System
IGERT Integrative Graduate Education and Research and Traineeship NEMC National Environment Management Council
SANAPA Saadani National Park
SUCCESS Sustainable Coastal Communities and Ecosystems TANAPA Tanzania National Parks
TCMP Tanzania Coastal Management Partnership TWRI Tanzania Wildlife Research Institute
URI University of Rhode Island
USAID United States Agency for International Development USDA United States Department of Agriculture
USFS IP United States Forest Service International Programs
Table of Contents
EXECUTIVE SUMMARY ... 1
INTRODUCTION: Scope of Technical Assistance ... 3
1. Background and Context... 6
1.1 Summary of Existing Condition ... 7
2. ISSUES, FINDINGS, CONCERNS AND RECOMMENDATIONS... 8
2.1 Decreasing Baseflow and Mean Annual Water Yield in the Wami River ... 9
2.2 Changes in Channel Morphology ... 13
2.3 Changes in Water Quality... 16
2.4 The Integrity of Wildlife Migration Corridors... 19
2.5 Declining Fish Stock in the Wami River ... 25
2.6 Lack of Continuous Data and Centralization of Resource Information ... 28
3. STEPS TOWARD THE IMPLEMENTATION OF RECOMMENDATIONS ... 32
3.1 Administrative... 32
3.2 Inventory and Monitoring ... 32
3.3 Development of Conservation Strategies... 34
4. POTENTIAL FUTURE ROLE FOR USFS TECHNICAL ASSISTANCE ... 35
BIBLIOGRAPHY... 36
APPENDIX A: MISSION ITINERARY... 38
APPENDIX B: SCOPE OF WORK ... 41
APPENDIX C: PEOPLE CONTACTED ... 44
APPENDIX D: NOTES FROM SAADANI FOCUS GROUP ... 45
APPENDIX E: NOTES FROM MATIPWILI FOCUS GROUP ... 47
APPENDIX F: NOTES FROM PARK RANGER INTERVIEW... 49
EXECUTIVE SUMMARY
The USFS technical resource team visited the Wami River basin in the vicinity of Saadani National Park from 30/01/07 to 06/02/07. Findings from this visit identified a critical relationship between the Wami River and the terrestrial and aquatic ecosystems in Saadani National Park.
Terrestrial ecosystems are influenced by three main components of the Wami River - water quality, water quantity and river morphology. The degree and upstream extent of salinity are the primary water quality components affecting terrestrial ecosystems in the lower Wami. This has affected changes in riparian and floodplain vegetation composition on the reach of the Wami River below the old ferry crossing site at Gama Gate.
The primary water quantity components affecting terrestrial ecosystems are baseflow, average annual water yield, and flooding. Baseflows during the dry season and average annual water yield are the most important of these variables. A decreasing trend in baseflow and water yield can affect changes in the composition and structure of riparian vegetation which can lead to alterations in habitat quality and bank instability. While extremely large floods have decreased over time, the annual occurrence of flooding continues to be important for the maintenance of in-channel characteristics and the distribution of nutrient rich sediment and water to the floodplain.
The morphological components of the Wami River important to terrestrial ecosystems are increasing width-to-depth ratios and channel incision in the reach below Gama Gate, and general bank erosion throughout the Wami River system. Increasing width-to-depth ratios accelerate bank erosion and the loss of riparian habitat. Although the Wami River is not currently confined in its lower reaches, continued channel incision (as observed by members of the local communities) can decrease and ultimately eliminate the services offered by annual flooding to the floodplain, accelerate bank erosion, and alter in-channel characteristics. Incision also contributes to the increasing upstream extent of tidal influence.
In the southern portion of Saadani National Park (historic game reserve) where the Wami flows, there are two separate populations of wildlife (e.g. ungulates, elephants, primates, predators) that travel to two separate dry season refugium where fresh water and forage remain available. The larger of the two populations travels from the coastal plain to the Kinyonga wetland and the Wami River downstream of Gama Gate. The second population travels south to the Mabumo wetland and the wetlands of the Zaraninge Forest (Lake Kiwandi, Msagere wetland and Tubilinyi Kwajumbe wetland) and then to the Wami River near Matipwili. Changes in Wami River water quality, water quantity, and river morphology contribute to potential changes in the location of fresh water and the quality and quantity of forage species available during the dry season, thus have the potential to change animal behavior, migration routes, and viability in this region of the park.
An additional element directly affecting the aquatic ecosystem is anthropogenic in nature. Increased fishing pressure in the river and the use of smaller meshed nets has diminished fish stock. Increased land conversion along the river contributes to bank instability, erosion, downstream sedimentation, and habitat degradation. Agricultural and urban runoff create water quality issues that have been cited as contributing to increased salinity upstream which has affected the distribution of some fish species.
INTRODUCTION: SCOPE OF TECHNICAL ASSISTANCE
The US Forest Service International Programs (USFS IP), within the Department of Agriculture (USDA), has a long history of promoting sustainable forest management and the conservation of biodiversity in Africa. USFS IP provides targeted technical assistance by working in collaboration with host-country government forest and natural resource management institutions, the US Agency for International Development (USAID), and local and international nongovernmental organizations (NGOs). By linking the skills of its field-based staff with partners overseas, the USFS, through the International Programs office, provides its partners with access to the wealth and diversity of skills that the agency possesses. USFS technical experts are able to apply sound natural resources management principles and lessons learned, gleaned from over 100 years of forest and grassland management in the USA to similar issues faced by partners overseas to help them address critical resource issues and concerns.
USFS has a well established history of providing technical support to USAID on projects around the world. In Africa, the USFS is active in over 20 countries, providing assistance on a wide variety of topics, including sustainable use of forest resources, fire prevention and suppression, information management, landscape scale land use planning, protected area management, and institutional strengthening and reform. In Tanzania, the USFS IP is an implementing partner to USAID/Tanzania’s Natural Resources Management program, which aims to conserve biodiversity in targeted landscapes through a livelihood driven approach. The role of the USFS in this program is as a provider of targeted technical and capacity building assistance aimed at assisting lead implementing NGOs and government partners on each of the landscapes to improve natural resource management. More information on USFS programs in Africa can be found at http://www.fs.fed.us/global/globe/africa/welcome.htm.
One of the four focal landscapes for USAID under this program is the Coastal ecosystem, on which the Tanzania Coastal Management Partnership (TCMP) is the lead implementing partner. On this landscape TCMP is pioneering a Landscape to Seascape approach to conservation. This landscape falls within the Pangani and Bagamoyo districts, and includes the Wami River Basin and its estuary, along with Saadani National Park (SANAPA), East Africa’s only combined terrestrial and coastal park. TCMP is a joint initiative between the National Environment Management Council (a Tanzanian Government office), the University of Rhode Island’s Coastal Resources Center and USAID.
The specific objectives for this initial USFS mission to the Wami River basin were to:
• Provide technical assistance to TCMP, Tanzania National Parks (TANAPA), and the Wami River Basin Office in the design and implementation of a rapid resource assessment of the dependence of biodiversity and ecosystems processes in Saadani National Park on the Wami River.
• Assess the current conditions of the Wami River watershed in and around the national park identifying primary threats to the quality and quantity of the river’s flow, and offer recommendations on mitigation measures for these threats.
1. BACKGROUND AND CONTEXT
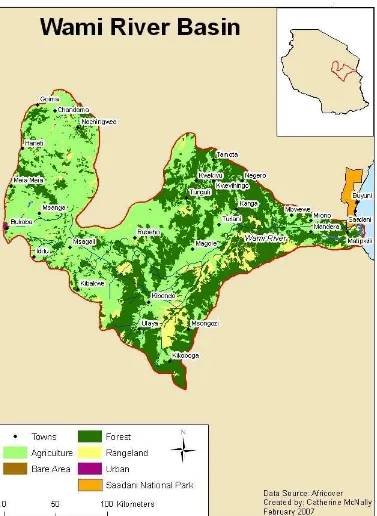
The Wami River Basin (40,000 km2) is situated in eastern Tanzania roughly between 6o and 7 o south latitude and 36.5 o and 38 o east longitude. The watershed has its headwaters in the Nguru, Ukaguru, and Ruhebo Mountains of the Eastern Arc and drains eastward to its mouth at the Indian Ocean. Weather patterns in this region are normally generated in the Indian Ocean. Average precipitation ranges from approximately 500 mm (20 inches) near Dodoma to 1800 mm (71inches) in the Ukaguru Mountains (Shilungushela, date unknown). This precipitation distribution within the watershed along with other physical factors creates a wide range of ecotypes including montane rainforests, dry tropical East African Coastal Forests, humid savanna and mangrove, as well as an array of agro-pastoral land-cover types (Figure 1).
Protected areas within the watershed include the richly diverse Nguru Forest Reserve of the Eastern Arc Mountains, the Wami-Mbiki Wildlife Management Area, the Zaraninge Forest Reserve, and Saadani National Park. Saadani National Park is the newest addition to the national network of parks, being formally established in 2005. Prior to Saadani’s status as a national park, the area was managed as the Saadani Game Reserve, and the Mkwaja Ranch (TANAPA, 2003).
Saadani National Park (SANAPA) is unique because it not only consists of a mosaic of savanna, woodland, forest, and mangrove, but it also contains 70 km2 of ocean with offshore coral reefs and one of two breeding sites in the world for green turtles (Chelonia midas) (TANAPA, 2003). No other park in the TANAPA system contains both terrestrial and marine ecosystems. The terrestrial portion of the park consists of coastal plain and low hills generally below 100 meters elevation with somewhat higher ground to the southwest and the Zaraninge Forest (TANAPA, 2003). In terms of animal diversity, TANAPA (2003) describes at least 40 species of mammals, over 70 species of birds, 27 species of reptiles, at least 20 species of amphibians and an unidentified number of fish and invertebrates for the Zaraninge Forest alone. A separate Checklist of the Birds of Saadani (Baldus, date unknown) lists 266 species of birds for all of SANAPA.
The Wami River valley intersects the park at its southern end. Although it is not a topographically prominent feature on the landscape, it is a significant aspect of ecosystem function for the region. Its riparian areas support riverine forests that are extremely biodiverse both in floral and faunal species (TANAPA 2003). The black and white colobus monkey is one of the hallmark species of this riparian gallery forest ecotype (Africa Wildlife Foundation, 2007). The Wami River is also the only perennial river in the park and thus a primary water source for the diverse wildlife of the park in the dry season.
ecosystems and biodiversity that depend upon perennial flow in the Wami. Should the Wami River run dry in the dry season, the consequences would be severe not only for the biodiversity of the river, estuary and park, but for people whose livelihood strategies depend upon the river.
There is a clear need for conservation and careful planning in the Wami River watershed and Saadani National Park to support viable flows in the river, biodiversity, and livelihood strategies. This need is underscored by the fact that Saadani National Park is now the closest park to the largest urban area in Tanzania, located 80 miles north of Dar es Salaam and 22 miles from Zanzibar. TANAPA officials anticipate that visitors will grow as much as 100 times in the near future. Such growth is indicative of the potential opportunities for economic return to the country. Economic return will depend greatly on natural resource condition in this area.
1.1 Summary of Existing Condition
Climate: Water resources are inextricably linked with climate, so the prospect of global climate change has serious implications for water resources (Riebsame et al. 1995). The Intergovernmental Panel on Climate Change (IPCC 2001) reports a warming of approximately 0.7oC over most of Africa during the 20th century based on historical records. Changes in temperature will be accompanied by changes in rainfall intensity and distribution. Decreasing average seasonal rainfall in the Wami-Ruvu basins occurred from 1964 to 1993 for all seasons except the short rains between October and December (Forestry and Beekeeping Division 2005). In eastern Tanzania and the region of the Wami River watershed, there were several anecdotal reports of drought conditions over the past four years. Rainfall data provided by the Wami-Ruvu Basin Office had records for precipitation stations within the Wami River basin through 2003. Although the data have many gaps and cannot be conclusively analyzed, the latest records did indicate a downward trend in precipitation. Temperature data were available for only one station and only provided monthly maximum temperatures.
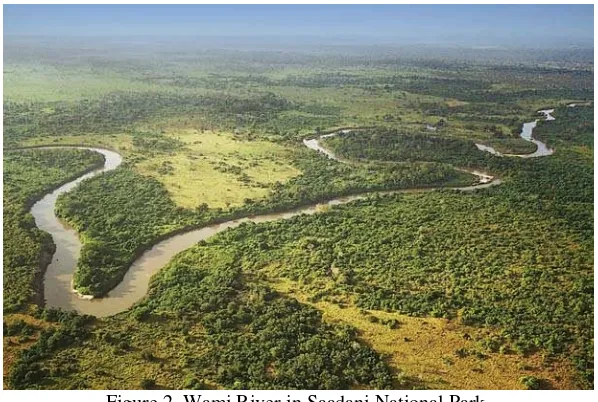
Figure 2. Wami River in Saadani National Park.
A rapid resource assessment of the lower Wami River basin indicates that the river is functioning at risk. Currently the river has access to its floodplain, with decent riparian vegetation grading from good and recovering within the park to poor in isolated areas of active agriculture just outside of the park. The river is not fully supporting beneficial uses of drinking water and a freshwater fishery, but still supports viable populations of wildlife that depend upon it to some extent all year.
Some of the channel dynamics physically observed, or changes to the river that were communicated during various discussions, do not necessarily to a system that is behaving outside the natural historic range of variability. Not enough data or anecdotal information exist to support such a conclusion. Rivers and ecosystems constantly adjust to their changing physical environments. However, as stated earlier, water quantity is diminished, and according to anecdotal information large floods have not been occurring as regularly in the recent past. While this may be a result of regional/global climate change, these changes in combination with changes in water quality and channel morphology indicate a trend toward a non-functioning status. Considering the trends that have been identified and the resources at risk, there is a clear need for careful resource inventory, monitoring, and the implementation of a coordinated conservation strategy.
2. ISSUES, FINDINGS, CONCERNS AND RECOMMENDATIONS
2.1 Decreasing Baseflow and Mean Annual Water Yield in the Wami River
Findings and Concerns: During field investigations, especially along the lower reaches of the Wami River, we found several instances where even slight increases in bank height (vertical departures from bank full, or flood stage) gave rise to an entirely different community of riparian vegetation (Figures 3 and 4). The normally dense riparian (or riverine/gallery) forest that benefit from regular inundation and an influx of sediment and nutrients growing on the active floodplain would transition to a more open grassland/acacia woodland vegetation type with an increase in bank height. On the floodplain of the lower Wami River, these forest assemblages include an array of mangrove and palm species (Nypa fruticans – also known as a mangrove palm) that transition to species compositions included in closed deciduous, ground water, or riverine forest types (Mugasha et al. 2004) as salinity decreases away from the zone of tidal influence (Figure 3). Besides relying on regular periods of inundation, these species all require a high water table (Mugasha et al. 2004). In-stream flow reductions and the depression of groundwater levels have contributed to the decline or alteration of riparian ecosystems throughout the world (Stromberg et al. 1996).
Figure 4. Vegetation transition riparian gallery forest to open woodland with increased bank height. Site of vegetation transect.
If through drought or other anthropogenic mechanisms mean annual water yield, baseflows and related groundwater levels continue to decrease to the point that soils and roots become dry, there is the potential for cascading direct and indirect effects. Diminishing flows can cease to provide adequate water resources to riparian vegetation which can lead to substantial changes in the composition and structure of these vegetation communities. If the basic requirements that support these biologically diverse riparian forests became insufficient, a vegetation composition shift could occur to an acacia woodland that supports limited biodiversity (TANAPA 2003).
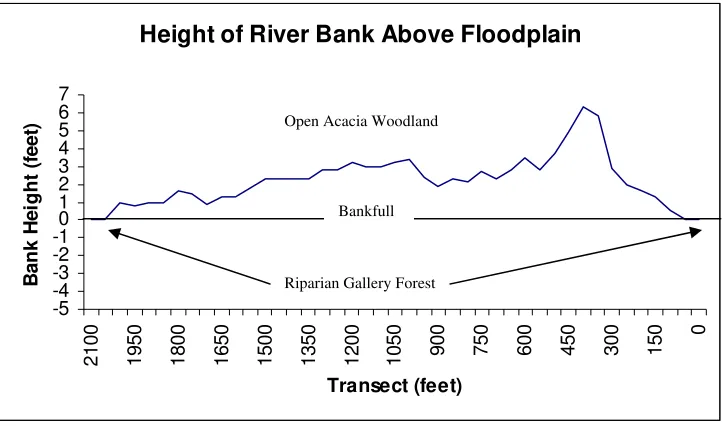
To demonstrate how vegetation reacts to increases in bank height on the lower Wami, we carried out a 2100 foot (640 meters) transect along the bank pictured above (Figure 4) that measured the vertical separation from the active floodplain (bank height) and ground cover in a 10 foot by 10 foot (3x3 meter) square adjacent to the bank. Ground cover was broken down into categories of bare ground, herbaceous species, shrubs, and trees. Tree species were also categorized and grouped into palm, mangrove, acacia, or “other.” Our general findings showed that as bank height increased, ground cover shifted from an almost 100 percent tree cover composition with some recently deposited silts to a ground cover that consisted of a somewhat more xeric composition of herbaceous species, bare ground, and sparse trees or shrubs (Appendix G). The intercepts that had sparser tree compositions were generally composed of acacia species – mostly Acacia zanzibarica
Height of River Bank Above Floodplain
Figure 5. Transect along Wami River measuring bank height and vegetation.
Riparian gallery forests along the Wami River are critical habitats for black and white colobus monkeys in Saadani National Park (Figure 6). Their only other disjunct occurrence is in the Zaraninge Forest. A variety of birds also rely on these areas for fruits, night roosts, hunting perches and nesting habitat. Dense riparian forests provide important hiding cover for ambush predators. Hippopotamus and crocodiles rely on this vegetation to provide cover while outside of the water and as hippopotamus travel corridors to upland feeding sites. A decline or collapse of this vegetation community compromises the viability of these species along the Wami River.
Figure 6. Black and white colobus monkeys in riparian gallery forest.
Bankfull
If a transition from a densely vegetated riparian zone with a dense network of roots to something more sparsely vegetated occurred, a loss of river bank integrity would occur. This causes bank instability, increased erosion, and potential alterations in channel morphology.
In addition to the physical evidence of vegetation transition, elders and other individuals from the villages of Saadani and Matipwili reported decreased dry season base flows in the Wami in recent years. During the lowest flow period, the lower Wami River is reduced to a series of residual pools connected by a shallow stream. Community members reported that during this time wildlife concentrate around pools for watering, refugia, and hunting.
This anecdotal information in combination with information we received during discussions with officials at the Chalinze water pumping station increased our concern regarding low flow periods. Pasco Hamuli, Engineer and Project Manager (pers comm. 2007), said that the lowest flows ever recorded at their gauge were 80 m3/sec (2,825 ft3/sec). These flows do not match the physical description of residual pools linked by shallow streams during low flows in the lowest reach of the Wami River. This information indicates that the lower Wami River is losing surface water as it emerges from of the more bedrock controlled uplands onto the coastal plain, which consists mostly of unconsolidated sands and silt. This phenomenon would be more pronounced at times when ground water levels are low. Increases in water withdrawal in the upper reaches of the Wami could further exacerbate problems of low flows in the lower reaches.
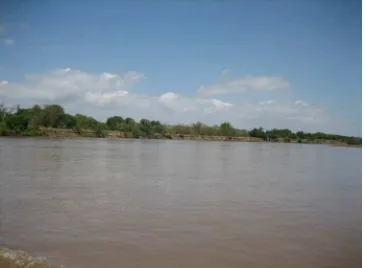
Figure 7. Wami River in a zone of bedrock control (left) and on the coastal plain (right).
Recommendations:
• Install or resurrect dysfunctional gauges on the Wami River, including its lower reaches. Gauging will help to verify trends in runoff, provide quantitative data for use in planning, and to better understand the dynamics of ground and surface water.
• Inventory, map, and monitor riparian vegetation composition and extent. Inventory and monitoring will provide baseline information, and will indicate trends in ecosystem dynamics.
• Contact agencies or companies involved in borehole drilling for data. Analyzing drilling logs would lead to a better understanding of groundwater dynamics in the Wami River basin.
• Continue to recruit cooperators and stakeholders in the Wami River basin to implement conservation activities.
• Work with major water users, SANAPA and/or TANAPA officials, the Wami-Ruvu Basin Office, and other government agencies to develop and implement a water use plan for the Wami River.
2.2 Changes in Channel Morphology
Findings and Concerns: There were several pieces of anecdotal information that we consolidated to describe some of the main morphological processes occurring on the lower reaches of the Wami River. Some of the physical observations made along the course of the river supported the information we received, but without a variety of monitoring data to differentiate natural morphological process from accelerated disequilibrium processes, it is difficult to positively identify any significant channel degradation in the area of the park. As discussed earlier, the river still has access to its floodplain and supports a relatively healthy stand of riparian gallery forest for much of the river length within the park.
In discussions with the group of elders in Saadani, we determined there are two main processes occurring. Elders described the river to be in the process of widening (people used to swim across, now they do not), as well incising itself into its floodplain (bank heights were increasing). While these channel types are susceptible to both lateral and vertical adjustments (Rosgen 1997), the two processes are normally thought to occur for different reasons. The former, widening, normally occurs through the process of aggradation as bed material accumulates in the reach of interest, increasing the width-to-depth ratio of the river. The latter, incision, is a process of degradation as bed material is actively transported out of the reach of interest (Brooks et al 1997). However, each of these processes can contribute to the other, and may take place in relatively rapid succession through changes in flow regime and sediment load occurring as a result of short intense weather systems, watershed disturbance, and/or from regional climate change (Rosgen 1994).
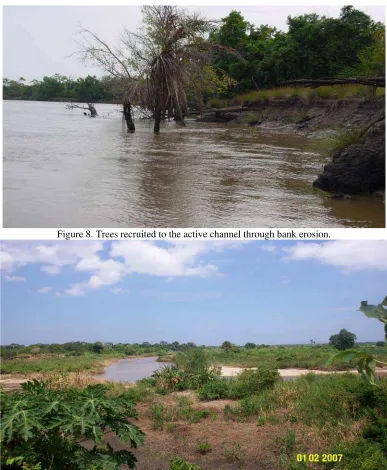
erosion and channel migration is occurring more rapidly in areas where the floodplain is cultivated to the river’s edge.
Figure 8. Trees recruited to the active channel through bank erosion.
Figure 9. Floodplain agriculture near Matipwili.
profound impact on species such as the hippopotamus and crocodile that depend upon various morphological features of the river for refugia, hunting, and access to forage on the floodplain.
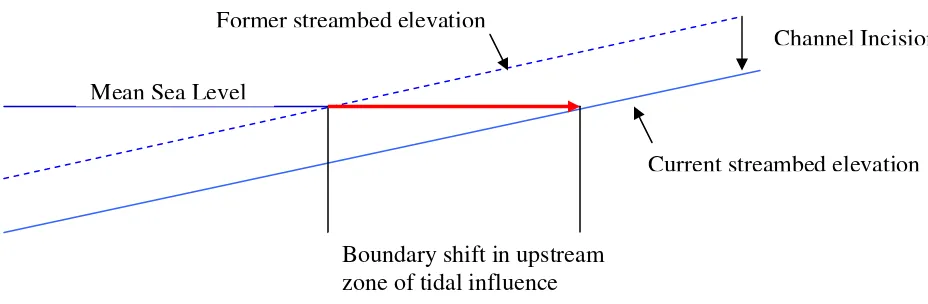
The process of channel incision in the lowest reaches of the Wami was verified by members of both communities and best described in terms of an increase in the upstream distribution of brackish water through tidal influence. As a vertical degradation (incision) of the riverbed occurs near the mouth of a river flowing to the sea, there is an increase in potential for horizontal or inland movement of sea water upriver (Figure 10).
Figure 10. Schematic of the effect of channel incision on upstream zone of tidal influence.
The zone of tidal influence was reported by elders to have moved from the area of the Kinyonga Camp, to Gama Gate (Figure 3) [A more thorough discussion regarding the upstream distribution of brackish water is found in the water quality section below.]
Another concern with channel incision is that the river eventually will have decreased access to the current floodplain. Through the process of incision, the river will become increasingly confined during flood stage. Confinement will lead to accelerated bank erosion as the energy carried by the river during flood stage becomes concentrated on the banks rather than being dissipated over the floodplain. This isolation from the floodplain also decreases the river’s ability to deliver the essential sediment, nutrients, and water to floodplain ecosystems.
Increased bank heights can also limit the hippopotamus’ ability to access the floodplain. Limited access decreases their ability to forage. With other components of degraded habitat from alterations in channel morphology and degraded forage on the floodplain, their viability in SANAPA could be threatened.
Recommendations:
• Establish monumented cross-sections to monitor change in channel morphology. Monitoring will allow the documentation of change, confirmation of trends, and help to develop conservation or mitigation measures in the upper watershed.
Channel Incision
Mean Sea Level
Boundary shift in upstream zone of tidal influence Former streambed elevation
• Conduct a longitudinal profile with monumented end points over an established reach. Monitoring a reach of the lower Wami River will allow for the monitoring of changes in channel morphology and habitat features.
• Monitor bank erosion with bank pins in locations of native vegetation and in areas of agricultural land conversion. Monitoring bank erosion will help gain an understanding of the relative differences in rates of erosion and demonstrate the proportional contributions on sediment to the river.
• Inventory, map, and monitor dry season residual pool number, location, and quality (e.g. relative depth, animal use, degree of shading). Inventory and monitoring will help to assess the potential for dry season refugia for hippopotamus and crocodiles, as well as watering sites for upland species.
• Identify agencies with the capacity to perform agroforestry extension activities and install erosion control and fertility improvement demonstrations throughout the watershed. Give special attention to adapting agroforestry systems that can provide bank stability and a riparian buffer zone, while attending to the socioeconomic needs of people cultivating the floodplains.
• Continue to recruit cooperators and stakeholders in the Wami River watershed to implement soil, water and vegetation conservation measures.
2.3 Changes in Water Quality
Findings and Concerns: Several pieces of anecdotal information and physical observation showed changes in water quality having occurred in the lower Wami River. The reason for changes in water quality were attributed to increases in salinity owing to changes in the upstream extent of tidal influence and the distribution of brackish water (Figure 10), as well as increases in pollutants from the upper watershed.
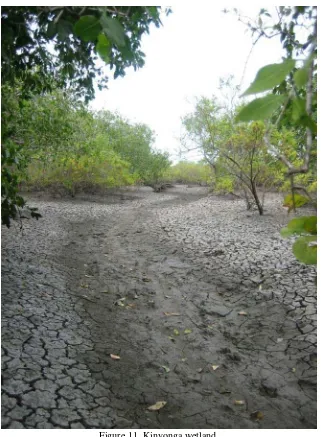
We first observed physical evidence of increased salinity in the Wami River in the Kinyonga wetland. The dominant floral composition area of the Kinyonga wetland presently consists of mangrove species that are more tolerant of high ranges in salinity and varied flood regimes (Figure 11). Historically, land-cover in this area was not a mangrove assemblage. Information gathered from a SANAPA ranger and other members of local communities describe the area as having once been under a grassland land-cover type before the area was converted to a sisal plantation. Following the sisal plantation, vegetation succession changed to a mangrove assemblage. It is unclear if one of the components of this vegetation succession could have been land/soil degradation, but the maintenance of the current land-cover type would require periodic inundation with saline or brackish water. This change in vegetation would indicate that the degree of salinity in floodwaters being delivered to the area in the past was not as great as current levels since grasslands and agricultural crops are not tolerant of a high degree of salinity in their soils and floodwaters.
animals using the area, but there is always some degree of brackishness (Baraka Kalangahe, pers comm.).As described earlier, through channel incision there is a greater upstream distribution of brackish water from tidal influence. The effects of channel incision in the location of the Kinyonga wetland, where flood waters may have always been somewhat brackish, is that a greater quantity of saline water would be in the floodwater mix during spring tides. In combination with decreased fresh water inputs from the Wami, the degree of salinity during these flood events could greatly increase.
Figure 11. Kinyonga wetland.
season. SANAPA Ranger, Doto Masamba, described a recent dry season incident in the Kinyonga wetland when a number of animals were forced to drink brackish water and they subsequently died.
With increased tidal influence and brackishness in the lower Wami River, vegetation transitions may begin to occur on a broader scale over the floodplain. Such a change in forage quality could be a real threat to hippopotamus populations that rely on freshwater grasslands for nocturnal foraging, and could potentially alter migration patterns and dry season refugia for many animals in the park.
Other than a notable progression of changes in riparian vegetation type moving upriver indicating changes in salinity, most of our findings relating to changing condition in water quality were anecdotal. Discussions with the group of elders in Matipwili further confirmed a greater upstream distribution of brackish water from tidal influence on the lower Wami River through a described change in the distribution of a variety of catfish normally found in the estuary. The catfish was originally found as far upstream as Gama Gate, and changes in water quality coming from the upper watershed have brought the fish up as far as the village of Matipwili itself.
In discussions with the people of Matipwili and other individuals further up in the watershed (away from the zone of tidal influence), concerns were raised regarding water quality and a perceived increase in “saltishness” during high flow periods. The people of Matipwili rely entirely upon the Wami River as a source of drinking water. They said that during low flow periods the water is “clear and sweet.” However, during high flow periods it is necessary to boil drinking water. The people reported a period of time when cholera and dysentery from drinking from the river was attributed to increased development upstream. This may be a combination of runoff from urbanizing areas, effluent from agricultural industry, and salt precipitates transported with eroded soil from bare agropastoral lands.
Effluent from the Mtibwa Sugar Factory and Dakawa Rice Project higher in the watershed was originally identified as a source in declining water quality (and quantity from water use) in the Wami. In conversations with officials from the Chalinze water pumping station, we learned that an incident occurred where a large quantity of molasses was discharged into the river causing some fish-kill in the middle watershed. The sugar factory has since tightened control of their waste by routing their effluent through a series of settling ponds. Effluent from the rice paddies, however, is still uncontrolled and exotic annuals from the paddies have been found growing along the banks of the river at the Chalinze water pumping station.
Recommendations:
• Conduct water quality inventory to monument the upstream extent of tidal influence in the lower Wami River.
• Create and implement a long term monitoring plan that would document variations in the extent of tidal influence. Detected changes would indicate adjustments in channel morphology, sea level and potential ecological changes. Ultimately this would help to direct other investigations.
• Conduct a water quality inventory of the water column during the ebb and flow of tides in the Wami River. Such an inventory would provide information on the degree of mixing that occurs between salt and fresh water during tidal fluctuations.
• Inventory water quality during flood events in the Kinyonga wetland during wet and dry seasons. Such an inventory would show the variability in salinity during flood events.
• Inventory, map, and monitor vegetation in the Kinyonga wetland. Such activities will help to demonstrate the effects of salinity on vegetation, the dynamics of this interaction, and to predict changes in ecosystem processes.
• Confirm and monitor animal access points to fresh drinking water during the dry season to detect changes in behavior that might alter migration corridors.
• Continue to recruit cooperators and stakeholders in the Wami River watershed to implement conservation activities to control point and nonpoint sources of pollution.
2.4 The Integrity of Wildlife Migration Corridors
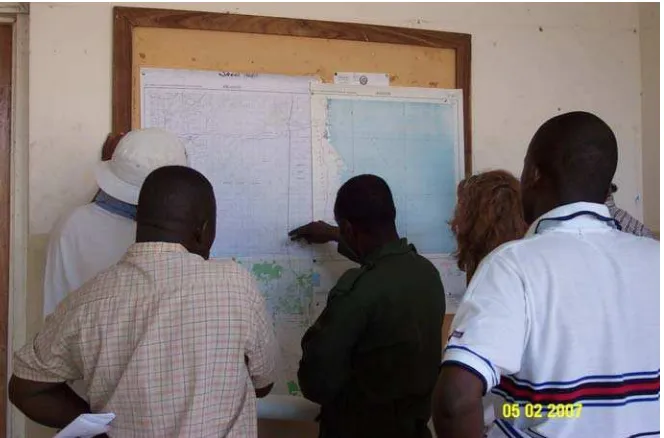
Findings and Concerns: Interviews with Park Rangers (Figure 12) revealed three main multi-species groups of animals that migrate to permanent water sources during the dry season (August – September) (Figure 14). Interviews with elders from Saadani village and Matipwili village confirmed these findings and the elders provided additional information on the seasonal wildlife movements closest to their villages.
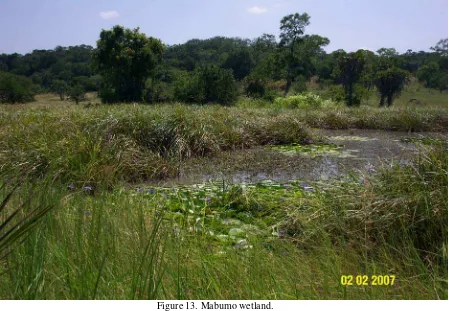
Two of the three groups of animals depend on the Wami River and adjacent creeks and wetlands for fresh drinking water and high quality forage during the dry season. The largest of these two groups (population 1: giraffe, kongoni, lions, wildebeest, zebra) moves south toward the Kinyonga wetland and the Wami River at the onset of the dry season. The smallest of these two groups (population 3: buffalo, kongoni, reedbuck, waterbuck, wildebeest, warthogs) moves south, at the onset of the dry season, to the Mabumo wetland (Figure 13), continuing on to the wetlands of the Zaraninge Forest, and follow several different routes to the Wami River in the vicinity of Matipwili village.
Figure 13. Mabumo wetland.
Figure 14. Wildlife migration corridors in Saadani National Park.
Matipwili elders provided detailed information on elephant movements near their village and to the south and southwest in the direction of the Selous Game Reserve. Elephant use of this route, and resultant crop damage along the river, was emphasized as a source of frustration for some Matipwili elders. Matipwili elders described elephants moving from the Saadani village area to Makande and then to the Wami River and Mialeni. From there, the elephants split into two groups: one group continues to Rufuji and beyond; the other group moves upstream to Kisampa Camp, back to the Wami River, to the Wami-Mbiki and on to the Selous Game Reserve and back. SANAPA Ecologist, Halima Ramadhani, may be able to confirm and clarify this described route from her notes from the interview with Matipwili elders.
Park Rangers confirmed this general direction of elephant movement, deferring to the elders who had more years of observation of these movements. Park Rangers added the northwestern movement of elephants from SANAPA toward the Arusha area.
Asukile Kajuni (USAID) validated this route description and had additional information about the route from the Wami River toward Mikumi National Park and on to Selous Game Reserve. Additional information from the staff at Wami-Mbiki Wildlife Management Area confirmed that the route to Mikumi National Park is the primary elephant route, but a secondary route splits from this route east of Morogoro and heads directly south to the Selous Game Reserve (see Figure 15). All informants feel that these are ancestral migration routes that may require several years for elephant groups to complete, and were unsure of the extent or precise location of elephant movements toward and beyond Arusha to the north and beyond the Selous Game Reserve to the southwest. More information on the exact location of this route and its extent is needed for a holistic approach to its protection.
Figure 16. Old ferry crossing site at Gama Gate.
Infrastructure development near any dry season fresh water source may cause alterations in migration patterns and consequent increased wildlife use at other scarce and finite fresh water sources. Degradation of water quality or water quantity at any of these locations would yield similar results. Any infrastructure development that could affect the water table and/or local hydrology will contribute to this potential degradation.
SANAPA and the Wami River have a critical role in large scale, ancestral elephant movement through eastern Tanzania (and possibly a larger scale). Conflicts with new agricultural developments along the Wami River, immediately adjacent to SANAPA, are already occurring in this corridor. Continued conflict within, or cumulative disruption of this migration corridor in the Matipwili area from increased agricultural development and increased traffic as a result of road development or reconstruction of the old Tonga Road (in its current location), could have consequences on a larger scale, affecting elephant migration patterns to other protected areas in Tanzania. These effects are cumulative to similar changes and conflicts along the entire route. In fact, information from Wami-Mbiki Wildlife Management Area staff described new community development within the primary Wami to Mikumi National Park route. Timely, accurate mapping of the entire elephant route is essential to addressing existing and potential future conflict areas before the route is permanently lost or altered.
Recommendations:
• Plan infrastructure development (e.g. camps, lodging, roads) well away from dry season water sources (e.g. perennial fresh water sources, wetlands, water developments) and outside of migration corridors.
• Locate any new SANAPA access roads away from wetlands, riparian areas, floodplains and major animal movement corridors: if necessary, cross perennial water sources and floodplains perpendicular to flow and resume travel well out of the floodplain.
movement. If information does not exist, work with these parties to gather necessary information to completely map this corridor.
• Develop a process to protect the entire large-scale elephant corridor, working with agencies, municipalities and communities.
2.5 Declining Fish Stock in the Wami River
Findings and Concerns: Team observations along the Wami River and interviews with the elders of Saadani village and Matipwili village documented the following conditions of fish populations in the river. Although Saadani villagers fish primarily in the sea, they also have a small fishing hamlet near the estuary of the Wami River. Matipwili villagers fish only from the river. Both sets of fisherman describe a change in fishing technology over the years: nets have doubled in length from 25 to 50 meters, and the mesh has become fine enough that no fish escape. The Executive Officer from Matipwili referred to ‘unsustainable’ fishing practices as all of the fish are now caught and no small fish escape to provide fish for the future. Indeed, fishermen from Matipwili, and as far as 50 kilometers (31 miles) upstream (separate opportunistic interview on February 7), describe fishing all day and catching very few fish (Figure 17).
Figure 17. Fish catch at Saadani fish camp on Wami River.
village is now losing at least one person per year to crocodile attack along the river as people are going for water during the months of November through January.
Figure 18. Nile crocodile hunting for prawns along the bank of the Wami River.
Anecdotal evidence suggests that current fish populations are not adequate to support current, and suspected increasing, populations of crocodiles in the Wami River. This may be the cause of increased crocodile predation on humans, especially in the vicinity of Matipwili.
Although Saadani residents rely primarily on fish and crustaceans from the sea, they believe that fish stocks in the sea are declining as a result of changes in fishing techniques as mentioned above, but also due to reduced flood events in the Wami River. They feel that the Wami River floods carry mud and organic matter into the sea and these flows stimulate deeper water fish to come into coastal waters where they become available to coastal fishermen.
Figure 19. African spoonbills on a point bar on the Wami River.
Wami River fish populations do not appear to be adequate to support the expected abundance and diversity of raptor and wading bird species. Wading birds should be more abundant and diverse; raptors capable of exploiting fish as prey are nearly absent.
Finally, declining fish stocks in the Wami River are forcing communities to find other sources of food. Matipwili, for example, has recently begun agricultural development within the Wami River floodplain to augment their diet. Such agricultural development along the river banks, and loss of native riparian vegetation, is contributing to changes in river morphology listed previously (Figure 20).
Fish populations in the Wami River are no longer adequate to support local populations. People are beginning agricultural conversion of native vegetation in floodplains and uplands, which accelerates the erosion of river banks, and may contribute to the brackish taste of water coming from uplands during and after the wet season.
Figure 21. Fish farm in Buyuni. This farm is a recently completed SUCCESS project.
Recommendations:
• Introduce fish farming to communities along the Wami River (Figure 21).
• Incorporate agroforestry practices in the floodplain and in the uplands as a way to hold streambanks together, control upland run-off, and implement conservation strategies with direct socioeconomic benefits to local populations.
• Establish a national, NGO and/or private, cooperative fish hatchery program to re-stock riverine fisheries.
• Offer alternative fishing equipment that would allow for selective fish removal from rivers to revert to more sustainable fishing practices.
2.6 Lack of Continuous Data and Centralization of Resource Information
From the team’s limited research and in conversations with personnel from various government agencies and NGOs, it was found that the existing data reside in many places; some are not even within the country. Presently, there is no person, government agency, or NGO that is actively collecting and coordinating information generated from water resource management, research, inventory, or monitoring. As a consequence, information required for identifying trends in water resources, regulating water use, and making informed decisions regarding supply for minimum environmental flows is not readily available.
While preparing for the mission, we found a private website (www.wildlife-baldus.com) with extensive information on vegetation and ecosystems studies of the Saadani National Park area prior to its gazetting in 2005. We found that these studies and this website were not known to the SANAPA staff we spoke to. Additionally, as discussed earlier, the wildlife of Saadani National Park, especially elephants, migrate and/or move beyond the boundaries of the Park seasonally or as part of larger ancestral movements. No one contact that we spoke to knew the entirety of these routes; rather a series of contacts with a variety of community members, agency and protected area staff and NGOs allowed us to piece together portions of these movement corridors, leaving the circuit incomplete. It is likely that the entire circuit is known, if enough contacts are made to fill in the gaps. It appears that there is currently no centralized collection of this type of knowledge.
Recommendations:
• Design and implement a sustainable monitoring program for in-stream flow that will reflect the hydrologic dynamics of the watershed.
• Design and implement a water quality monitoring program that will capture the dynamics of point and non-point sources of pollution in the upper watershed.
• Create a central repository for all monitoring data.
• Establish a single agency or entity tasked with actively seeking out and compiling existing data, and managing the central data and information repository.
• Search for and compile all existing information on wildlife, habitats and ecosystems affecting the resources of Saadani National Park and create a central repository within the SANAPA or TANAPA organization.
Other Secondary Findings and Concerns:
This species is abundant in disturbed areas, drapes over native vegetation, and appears to be a type of bindweed (Convolvulaceae: Morning glory family) (Figure 22). Species identification, verification of its threat to SANAPA biodiversity, a map of the existing infestation, and potential development of a weed management plan are needed to protect SANAPA from its invasion and establishment.
Figure 22. Bindweed found along road to SANAPA.
Table 1: Summary of Recommendations:
Recommendation Time Frame Responsible Agency
Continue to increase coordination between stakeholder and regulatory agencies to work toward conservation strategies in the Wami River basin and regulate water use according to minimum flow recommendations from GDA findings.
Ongoing Wami-Ruvu Basin
Office
Establish a coordinating agency that will compile and store all relevant precipitation, water quality, water runoff, and groundwater information for the basin.
Install or rehabilitate gauging stations in the Wami River watershed to measure and monitor surface runoff.
Implement a vegetation monitoring plan for riparian areas, wetlands and Kinyonga wetland.
Establish permanent, monumented cross-sections and longitudinal profiles on the lower Wami River and implement monitoring plan.
Long-term: Implement bank erosion monitoring plan in
areas of agricultural land conversion and native vegetation Conduct water quality sampling for salinity of
the water column within the zone of tidal influence on the Wami River.
Short-term: One time
SANAPA or Wami-Ruvu Basin Office
Conduct water quality sampling and
monitoring of salinity along Wami River to establish extent of tidal influence
Long-term:
Conduct water quality sampling and monitoring of salinity of flood waters in Kinyonga wetland
Create a baseline map of residual pools used by hippos and crocodiles in the dry season, and monitor for number, location, and quality.
Long-term: Every 5 years
SANAPA
Plan for and develop all new SANAPA infrastructure away from dry season water sources and migration routes. corridor to create a complete map; then work with all affected parties and communities for its protection.
Explore tools and techniques for sustainable fishing practices in the Wami River and estuary.
Short-term: as soon as possible
TCMP/SUCCESS
Identify agencies that can provide agroforestry extension and establish demonstrations to agriculturalists in the Wami River basin. Target agriculturalists on the floodplain for opportunities to establish riparian buffer zones that provide socioeconomic benefits.
Establish fish farming demonstrations in Wami River communities
Short-term: 1-5 years
SUCCESS
Establish a national, NGO and/or private, cooperative fish hatchery program to re-stock riverine fisheries.
Short-term: 1-5 years
TCMP
Identify potential invasive weed species: map and assess threat to SANAPA and develop an invasive species management plan, if needed.
Short term As soon as possible
3. STEPS TOWARD THE IMPLEMENTATION OF RECOMMENDATIONS
3.1 Administrative
A primary requirement for successful water resource management is an interested and engaged cadre of people and organizations that are versed in the issues, have knowledge of the science of hydrology and aquatic biology, and have the authority to implement programs and projects. The following are recommendations for developing such a cadre:
1. Identify a regional water resources coordinator and coordinating agency/entity that can organize and direct a water resource information management, inventory, and monitoring program. The ideal coordinating entity would have the capacity to work with NGOs and government agencies.
2. Designate/create a central storehouse and a regional data steward for improved communication and information storage and sharing for all water resources and climatic data.
3. Integrate water resource and aquatic species conservation initiatives, goals, and objectives into NGO and government programs.
4. Include hydrologists and aquatic biologists in the planning process.
5. Develop a regional training program that includes members of government agencies, NGOs, parks, and affected communities in inventory, monitoring and management of water resources.
3.2 Inventory and Monitoring
Inventory and monitoring will be very important for establishing baseline data and identifying trends in resource condition. A broad-based monitoring program will be important for tracking resource condition, identifying cause-effect relationships, and for informing sound recommendations for mitigation. It will be important to identify agencies with the technical and financial capacity to implement and follow through with inventory and monitoring programs. The Wami-Ruvu Basin Office, TANAPA, and/or SANAPA are likely agencies or entities to engage in these activities.
1. Gauging: Maintain a minimal network of gauging stations in key locations throughout the Wami River watershed. This should include the installation of a gauge on the lower Wami in the vicinity of SANAPA. The number of gauges should be commensurate with reasonably projected long-term funding to assure the collection of a continuous long-term data record. The rehabilitation of defunct gauges, when possible, may prove to be economically sensible.
2. Channel morphology:
system with various measuring instruments. Considerations should include cost and site specific limitations. Long-term monitoring should occur annually.
b. A longitudinal profile(s) should be established with monumented starting and ending points. Monuments can include landmarks, posts, or GPS coordinates. This operation is generally low cost and would be performed with portable equipments and a boat. Long-term monitoring should take place every two to five years as needed.
c. Bank erosion monitoring should take place on a variety of erosion-prone banks in areas where riparian land-cover consists of natural gallery forest or grassland, and agriculture. A bank erosion monitoring program would be short-term (annual monitoring up to five years, or as needed) and low-cost.
3. Water Quality
a. Measurements of salinity should be taken from different horizons through the water column during low and high tides in two or three specific locations on the river that are within the zone of tidal influence. Such an inventory would provide an understanding of the degree of mixing that is occurring. This would be a one-time, low-cost inventory.
b. Inventory and monitoring of the upstream extent of tidal influence (or brackish water). Such an inventory would help to anticipate ecological changes that might be expected along the river and its floodplain, and to point to changes in channel morphology. Long-term monitoring would be low-cost and repeated every two to five years depending on available resources and other indications of changing conditions.
c. Inventory and monitoring of the floodwaters in the Kinyonga wetland will help to anticipate ecological changes, and potential changes in animal behavior and migration patterns. Such a monitoring plan should include repeat surveys during wet and dry season floods once every three to five for the first five to 10 years, then as needed. Monitoring would be inexpensive, but survey logistics during flood period could be challenging.
4. Vegetation
a. Native vegetation monitoring should concentrate on riparian areas, wetlands and the Kinyonga wetland. Use aerial photos to map existing vegetation types (upland, mesic, and hydric) by brackish and fresh water within the influence zone of the Zaraninge Forest wetlands (including the Mabumo wetland), the Wami River riparian area and the Kinyonga wetland. Ground truth each mapped vegetation type to determine species composition. Use pins, stakes and/or GPS coordinates to document the extent of hydric and mesic vegetation at each site. Re-map every 5 years using new photo sets and ground truthing to determine potential changes in extent (amount and location) of vegetation types to track potential changes in hydrology, channel morphology and/or animal use.
the potential for new species invasions. This information should be used to develop an invasive species management plan.
5. Residual pools
a. Create a baseline map of dry season residual pools, gathering information on location (GPS coordinates), size (volume) and wildlife use. Re-map every 5 years to determine if flow and/or channel morphology changes are affecting the location, distribution and/or abundance of critical dry season refugia.
6. Wildlife movement
a. Continue to map and refine SANAPA wildlife corridors and larger scale elephant movement corridors to provide guidance for corridor conservation planning on a local and regional scale with other agencies, communities and NGOs.
3.3 Development of Conservation Strategies
The development of conservation strategies that consider the socioeconomic needs of people utilizing the landscape will be a very important component of mitigating environmental degradation in unprotected areas within the watershed. Identifying and recruiting agencies that have the capacity to provide community outreach services and establish appropriate demonstrations that incorporate the livelihood strategies and socioeconomic needs of the people will be critical. Operations toward identifying appropriate agencies should begin as soon as possible.
1. Agroforestry systems have the potential to provide a wide range of goods and services to people while being very effective in improving soil fertility, stopping/slowing erosion, improving microclimate, and providing habitat. A strategy that first focuses on communities farming the floodplain and immediate upland areas will provide more immediate results in the conservation of the Wami River. Special attention should be focused on establishing riparian buffer zones within agricultural systems.
2. Fish farming is a very logical means of relieving pressure on the aquatic resources of the Wami River while providing a livelihood strategy and alternative that corresponds to the cultural traditions of communities near the river. The TCMP SUCCESS program has already realized some success in introducing this livelihood alternative in Buyuni village on the coast.
3. A freshwater hatchery with a program that focuses on the propagation of native fish species for the Wami River (and adjacent basins) will be important for reestablishing this highly degraded fishery.
4. An examination of current fishing techniques and practices could assist in development of more sustainable practices for communities along the Wami River and estuary.
4. POTENTIAL FUTURE ROLE FOR USFS TECHNICAL ASSISTANCE
1. Conduct a rapid resource assessment of the upper watershed to evaluate resource conditions, unidentified threats, potential mitigation measures, and provide recommendations for future mitigation.
2. Provide assistance in preparing and implementing plans for inventory and monitoring activities.
3. Provide training to local or regional natural resources professionals in inventory and monitoring techniques.
BIBLIOGRAPHY
Africa Wildlife Foundation. 2007. Black and white colobus monkey. In
www.awf.org/content/wildlife/detail/colobusmonkey.
Baldus, R.D. undated. Checklist of the Birds of Saadani National Park. In
www.wildlife-baldus.com/download/SaadaniBirdChecklist.pdf.
Baldus, R.D., K. Roettcher, and D. Broska. 2001. Saadani: an introduction to Tanzania’s future 13th National Park. Tanzania Wildlife Discussion paper No. 30: Rolf D. Baldus and Ludwig Siege (Eds.).
Bloesch, U. Frank, K. Frank. 2004. Coastal forests of the Saadani National Park: conservation values and management strategies. Tanzania Wildlife Discussion Paper No. 37: Rolf D. Baldus (Ed.).
Bloesch, U. Frank, K. Frank. 2002. The vegetation of the Saadani National Park and possible conservation and management strategies. Tanzania Wildlife Discussion Paper No. 33: R. D. Baldus and L. Siege (Eds.).
Brooks, K.N., P.F. Ffolliott, H.M. Gregersen, L.F. DeBano. 1997. Hydrology and the Management of Watersheds, 2nd Edition. Iowa State University Press, Ames Iowa.
Foresty and Beekeeping Division. 2005. Hydrological analysis of the Eastern Arc
Mountain Forests. Compiled by Mtalo, F., D. Mulungu, F. Mwanuzi, S. Mkhandi, T. Kimaro and P. Valimba for Conservation and Management of the Eastern Arc Mountain Forests, Forestry and Beekeeping Division, Dar Es Salaam.
IPCC. 2001. Climate Change 2001: Impacts, Adaptation, and Vulnerability. Intergovernmental Panel on Climate Change (IPCC) Working Group II, MacCarthy, J.J. et al., eds. Cambridge University Press, Cambridge, UK.
Kalangahe, B. 2007. Personal Communication. TCMP SUCCESS Co Manager.
Madulu, N.F. 2005. Environment, poverty and health linkages in the Wami River Basin: a search for sustainable water resource management. Elsevier: Physics and Chemistry of the Earth 30 (2005) 950-960.
Mugasha, A.G., S.A.O. Chamshama, V.V.K. Gerald. 2004. Indicators and Tools for
Restoration and Sustainable Management of Forests in East Africa, State of Forest and Forestry Research in Tanzania. I-TOO Working Paper No.3.
Riebsame, W.E., K.M. Strzepek, J.L. Wescoat Jr. R. Perritt, G.L. Gaile, J. Jacobs, R. Leichenko, C. Magadza, H. Phien, B.J. Urbiztondo, P. Restrepo, W.R. Rose, M. Saleh, L.H. Ti, C. Tucci and D. Yates, 1995. Complex river basins. P57-91 In
Rosgen, D. 1994. A Classification of Natural Rivers. El Sevier, Catena 22 169-199.
Rosgen, D. 1997. Applied River Morphology, 2nd Edition. Printed Media Companies, Minneapolis, Minnesota.
Shilungushela, J. undated. Technical Information Regarding Hydrological Aspects of Wami River Basin and Estuary. Tanzania Coastal Management Parnership for Sustainable Coastal Communities and Ecosystems (TCMP – SUCCESS).
Unpublished report.
Stromberg, J.C., R. Tiller, B. Richter. 1996. Effects of Groundwater Decline on Riparian Vegetation of Semiarid Regions: The San Pedro, Arizona. Ecological
Applications, 6(1), pp. 113-131.
TANAPA, 2003. Saadani National Park, Management Zone Plan Environmental Impact Assessment. TANAPA / Department of Planning and Project Development.
APPENDIX A: MISSION ITINERARY
Saturday, January 27: USFS team (Jason Gritzner and Doreen Sumerlin) depart from
home and travel to Dar es Salaam via Amsterdam and Kilimanjaro.
Sunday, January 28: USFS team arrives in Dar es Salaam late in the evening and travels to hotel.
Monday, January 29: USFS team meets with TCMP Staff (Jeremia Daffa and Baraka
Kalangahe) and URI-CRC Staff (Jim Tobey, Don Robadue and Catherine McNally (PhD student)) at TCMP office for project overview and interchange of ideas on a schedule for field time in Saadani National Park. Jim contacted Maureen Latour at the US Embassy for a meeting and mission briefing but schedules would not allow for a meeting until the Team returned from the field. Team spends the remainder of the afternoon gathering supplies and food and preparing for travel to Saadani National Park.
Tuesday, January 30: USFS team, Cathy McNally, Baraka Kalangahe, and drivers Jacob
Mlula and Ayubu Nanjale leave Dar es Salaam for the day long journey to Saadani National Park. The team stopped at the Wami River bridge to view the river and observe the water pumping plant supplying water to Chalinze and adjacent communities. Upon arrival in the Park, the team paid a courtesy call to the Saadani Ranger Station and met Park Ecologist, Halima Ramadhani, and Tourist Warden, Dattamax Sellanyika. The team briefed them on objectives and planned schedule and Dattamax offered to help us make arrangements to speak with the Saadani village Executive Officer and elders on Saturday. Halima joined the team and stayed with us for the remainder of the time in Saadani. The team proceeded to the Guest House to drop off our supplies, and traveled to the Salt Works to look at threats to mangrove systems, and then on to the Wami River boat dock to see the river and make arrangements with the Park Rangers for a boat journey the next day.
Wednesday, January 31: USFS team, Cathy McNally, Halima Ramadhani, Baraka
Kalangahe, Jacob Mlula and Ayubu Nanjale travel to boat dock and boards a boat, accompanied by Park Ranger and boat operator, Doto Masamba, to travel upstream as far as Gama, and downstream to the estuary, as tides allowed. The team observed wildlife use of the river (including Nile crocodile, hippo, osprey, storks, spoonbills, egrets, herons, black and white colobus monkeys, hamerkop, kingfishers and several species of weaver birds. The team observed changes in vegetation as the river transitioned from marine/tidal to brackish to fresh water near Gama. The team collected several waypoints at points of vegetation change and at notable bank features. We noticed that hippos were commonly found near gradually sloping point bars and crocodiles were often found foraging along deeper water next to steep cutbanks. Estimates of channel depth and temperature recorded as well as changes in substrate. We returned to the dock and discussed our plans for the subsequent day with Park Rangers to schedule Doto to accompany us.
Thursday, February 1: After viewing the Wami River on Monday we wanted to look at
complex connecting dry uplands to the river. We hiked through and around this large wetland until intersecting Kinyonga Creek. Doto explained that animals use this large wetland system during the dry season for fresh water, forage and access to the river. Hippos use it yearround. Kinyonga means ‘hanging place:’ where people used to come and catch and kill animals trapped in the mud. Trying to get an idea of the wetland’s extent, we drove into Kinyonga Camp on the Wami River, and then drove and walked to the old Gama ferry crossing where we saw hippo tracks and elephant tracks in the mud and wetlands. We continued to Matipwili to make arrangements for our meeting with the elders on Sunday, and then traveled to several upstream river vantage points to view floodplain agricultural activities. We also drove up to a ridgetop in the Zaraninge Forest for an overview of the coastal forest down to the river. Doto mentioned that there is another place near the Zaraninge where animals come for water and forage during the dry season. We planned to hike there the next day.
Friday, February 2: We traveled to the Zaraninge Forest Ranger Station and picked up Ranger, Adam Rupia, then drove to the railroad tracks and hiked 5K to the Mabumo wetland. Adam described how animals come to this wetland during the dry season, then animals move further south to other wetlands (Msagere and Tubilinyi Kwajumbe) and then to the river near Matipwili or to Lake Kiwandi in the Zaraninge Forest and then to the river upstream of Matipwili (Kisampa Camp). Adam described the Mabumo wetland as having fairly stable water levels and vegetative cover throughout the year. Although it captures rains, it is also fed by groundwater from the Zaraninge Forest. Adam also said that there was a large sisal estate where the Kinyonga wetland is now and that animals had to go to the river upstream of the wetland until the estate was abandoned. Now wildlife can use the area again. He thinks that the area was originally a freshwater grassland, then sisal estate, and then recovered to more brackish vegetation.
Saturday, February 3: We met with the Saadani Village Chief (Ramadhani Jumbe) and
Elders (Hamisi Maftah, Omari Ali, Mlekwa Mohamed, Mwajuma Rajabu, Mfaume Akida: 4 men and 1 woman) for a focus group discussion on river condition, water quality and quantity, fish stocks and animal movement. Notes are attached in Appendix D. After the meeting we traveled north to the main Park headquarters at Mkwaja to collect some supplemental maps and pay a courtesy call to Park administration. On the return trip we stopped at Buyuni Village to see their fish farming project, and also mapped several permanent wetlands.
Monday, February 5: We returned to the Wami River to gather waypoints for mapping of vegetation changes indicating changes in salinity from marine to brackish to fresh. We stopped at the ‘kingfisher cutbank’ and ran a transect of cutbank height above bankfull and associated percent cover of vegetation (e.g. mangrove, nypa palm, acacia, salt grass, freshwater grass). See Figure 5 for data. We also traveled upstream to the mouth of Kinyonga Creek and took a waypoint. We returned to the Saadani Ranger Station and interviewed Park Rangers Doto Masamba and Julius Masaki to clarify a few lingering questions about animal use of brackish water, changes in river morphology, and wildlife movement corridors during the dry season. The Rangers drew us maps of dry season movements of three different populations, clarified that animals do not drink brackish water (observed some drinking in drought years and they died), and that they also think that the lower Wami is getting wider. Notes are attached in Appendix F. Doto accompanied us on a drive to see some animals just before dark.
Tuesday, February 6: We left early for a game drive and returned to the guest house to pack. We drove to a village just east of Mandela and hiked down to the Wami River about 50K upstream from Matipwili. In this reach, the river flowed over bedrock at a higher gradient than below, with a fast current, pools, riffles and drops. We also talked to a fisherman about his perceptions of changes in fish stocks. We continued to the Wami River pumping station (Chalinze Project) and talked with Project Water Quality Engineer (don’t have his name recorded) and also with Engineer/Project Manager, Pasco Hamuli. We learned that there are problems with the local water table: shallow wells are soft but polluted; deeper wells are hard and mineralized and sometimes brackish. Some treatment of Wami River water occurs prior to distribution and may give it a slight salty taste. Current river withdrawals are about 800 m3/day and capacity is 7200 m3/day. There is an automated gauging station at the plant, just above the withdrawal point. Pasco felt that the lowest flow recorded was 80 m3/s. Given the isolated remnant pools scenario described by the elders during the worst dry season, it appears that the river is losing flow between the pump station and the mouth of the river. From here we traveled upstream for a last view of the river from an Army Camp. We were unable to take photos or waypoints from this location. We proceeded to Dar es Salaam.
Wednesday, February 7: We spent the day working in the TCMP office downloading
photos, mapping waypoints and organizing the mission report.
Thursday, February 8: USFS team and Cathy spent the day at the hotel developing maps of animal movement routes, compiling transect data tables, and developing issues, recommendations and monitoring for the report and in preparation for de-briefings on Friday.
Friday, February 9: The Team met with USAID and US Embassy Staff at 9 am for a
mission de-briefing (Maureen Latour: US Embassy; Dennis Cengel and Asukile Kajuni: USAID). The Team spent the remainder of the day working on their report. Jason and Doreen departed for the airport in the evening for a flight to Amsterdam.