Gadjah Mada International Journal of Business
Vol. 18, No. 3 (September-December 2016): 301-314
* Corresponding author’s e-mail: [email protected]
Stock Return Synchronicity and
Analysts’ Forecast Properties
Joong-Seok Cho,
*Hyung Ju Park,
and
Ji-Hye Park
School of Business Administration, Hanyang University, KoreaAbstract: Using stock return synchronicity as a measure of a firm’s information environment, our re-search investigates how the firms’ stock return synchronicity affects analysts’ forecast properties for the accuracy and optimism of the analysts’ annual earnings forecasts. Stock return synchronicity represents the degree to which market and industry information explains firm-level stock return variations. A higher stock return synchronicity indicates the higher quality of a firm’s information environment, because a firm’s stock price reflects more market-level and industry-level information relative to firm-specific in-formation. Our study shows that stock return synchronicity positively affects the forecast properties. Our finding shows that when stock return synchronicity is high, analysts’ annual earnings forecasts are more accurate and less optimistically biased.
Abstrak:Dengan menggunakan sinkronisitas tingkat pengembalian saham sebagai pengukuran lingkungan informasi perusahaan, penelitian ini menguji bagaimana sinkronisasi tingkat pengembalian saham mempengaruhi propertisperamalan analis untuk keakuratan dan optimisme peramalan pendapatan tahunan. Sinkronisitas tingkat pengembalian saham merepresentasikan derajat informasi pasar dan industri dalam menjelaskan variasi tingkat pengembalian saham perusahaan. Sinkronisitas tingkat pengembalian saham yang lebih tinggi mengindikasikan lingkungan informasi yang berkualitas tinggi karena harga saham lebih banyak merefleksikan informasi pasar dan industri relatif terhadap informasi khusus perusahaan. Studi menunjukkan sinkronisasi tingkat pengembalian saham berpengaruh positif terhadap propertis peramalan. Temuan menunjukkan bahwa ketika sinkronisitas tingkat pengembalian saham tinggi, maka peramalan pendapatan tahunan analis lebih akurat dan bias optimisme menjadi berkurang.
Keywords:analysts; forecast accuracy; forecast bias; information environment; stock return synchronicity
Cho et al.
302
Introduction
This study investigates how firms’ stock return synchronicity affects the accuracy and optimism of analysts’ annual earnings fore-casts. Stock return synchronicity represents the degree to which market and industry in-formation explains firm-level stock return variations. A higher stock return synchronicity indicates the higher quality of a firm’s infor-mation environment, because a firm’s stock price with a higher stock return synchronicity reflects more market-level and industry-level information, relative to firm-specific infor-mation. Our research posit that stock return synchronicity mitigates analysts’ forecasting difficulties because the higher synchronicity represents the higher quality of a firm’s in-formation environment.
Our sample is composed of analysts’ annual earnings forecasts for U.S. firms over the period from 2001-2013. For the analysts’ forecast property measures, our research used the analysts’ annual earnings forecast accu-racy and the bias in their annual earnings fore-casts. Following Durnev et al. (2003) and Piotroski and Roulstone (2004), our research calculated each firm’s stock return synchronicity to measure the market and in-dustry-wide information components incor-porated into the firm’s stock price. Using stock return synchronicity as a measure of a firm’s information environment, our research investigated the relation between a firm’s in-formation environment and the analysts’ an-nual earnings forecast properties.
Our study shows that stock return synchronicity affects the analysts’ forecasts positively. Specifically, our research finds that when the stock return synchronicity is high (i.e., more market- and industry-wide infor-mation relative to firm-specific inforinfor-mation), the analysts’ earnings forecasts are more
ac-curate and less positively biased. A higher stock return synchronicity means less firm-specific information and a higher quality of the firm’s information environment. Our re-sults suggest that as informativeness improves (e.g., less unexplained firm-specific informa-tion), it positively affects analysts’ forecast properties. As a result, as stock return syn-chronicity increases, analysts’ forecasts are more accurate and less biased.
The rest of the paper proceeds as fol-lows. The next section presents the literature review and our hypothesis development. Sec-tion 3 describes the sample and methodol-ogy, and Section 4 reports the empirical re-sults and discussion. Section 5 concludes.
Literature Review
Market-level, industry-level, and firm-specific information is reflected in each firm’s stock price. In his seminal paper, Roll (1988) reports the relationship between an individual firm’s stock returns and contemporaneous market and industry movements. The ability of market-wide information to account for firm-level stock returns is measured by the stock return synchronicity. Roll (1988) first proposed the stock return synchronicity mea-sure. Stock return synchronicity is based on the correlation between the individual firm’s stock return and the returns of the overall market and the corresponding industry. Stock return synchronicity is higher when the stock price incorporates relatively more public news. And the residual component of returns represents the firm-specific information (Piotroski and Roulstone 2004).
envi-ronment. Piotroski and Roulstone (2004) in-vestigated the relation between informed trading and stock return synchronicity. They found that they are positively related, con-sistent with insider and institutional trading and facilitate the market to incorporate firm-specific information into prices. In their re-search on patterns of comovement in asset returns, Barberis et al. (2005) reported that the increase of firm-level transparency (e.g., by adding the S&P 500 index) improved stock return synchronicity. Chan and Hameed (2006) studied the association between stock return synchronicity and analyst coverage in emerging markets. They found that because analysts facilitate the incorporation of greater market-wide information into the stock price, more analyst coverage increased stock return synchronicity. Chen et al. (2007) examined how the amount of private information im-pounded in a stock’s price affected the sensi-tivity of corporate investment to a stock’s price. In doing so, they used stock return synchronicity to measure the amount of pri-vate information in a stock’s price and showed that when stock price synchronicity is lower, corporate investment is more sensi-tive to stock prices. Hutton et al. (2009) found that the transparency of financial statements was negatively associated with the revelation of firm-specific information and as a result, less transparent firms’ returns were more syn-chronous with the market. Focusing on ma-jor information revealing events such as Sea-soned Equity Offerings (SEOs) and cross-listings settings, Dasgupta et al. (2010) de-veloped a numerical model to show how new disclosures and improvements in transparency affected stock return synchronicity. Based on their theoretical model, they empirically veri-fied that a more transparent information en-vironment is positively associated with stock
return synchronicity. From a microstructure prospective, Kelly (2014) also showed that stock return synchronicity is associated with lower information costs and more liquidity, and corroborates stock return synchronicity as a measure of the quality of the informa-tion environment. Recently, Cho and Park (2015) showed that as firms’ earnings become more volatile, such firms’ stock returns in-corporate less firm-specific information. In summary, these studies indicate that as more market- and industry-wide information ac-counts for firm-level stock returns, that firm’s stock return synchronicity increases.
Cho et al.
304
Research on analysts’ forecasting abili-ties identifies analysts’ expertise, the size of the brokerage firm, and the complexity of the forecasting task as being positively associated with accuracy (e.g., Brown et al. 1987; Mikhail et al. 1997; Sinha et al. 1997; Clement 1999). Several studies have investigated the ineffi-ciency of analysts in incorporating relevant information into their forecasts. Specifically, Stober (1992) showed that analysts do not include the necessary accounting informa-tion, and neglect to incorporate the pertinent accounting information into their forecasts. Additionally, Abarbanell and Bushee (1997) found that the analysts did not comprehend the implication of the information about fu-ture earnings and failed to fully reflect that information into their forecasts. Bradshaw et al. (2001) also showed that financial analysts did not understand the anticipated future earnings decreases related to high accrual re-versals in later years. Duru and Reeb (2002) studied the relation between corporations’ international diversification and analysts’ annual earnings forecast properties. Using corporations’ international diversification as a proxy for the complexity of the forecasting task, their study showed that corporations’ international diversification negatively affects analysts’ forecast properties. Byard et al. (2006) investigated how corporate gover-nance affected the quality of information available to financial analysts, and found that the quality of financial analysts’ information was positively associated with the quality of the corporate governance mechanisms. We-ber (2009) investigated whether analysts ap-preciated the effect of book-tax differences in the current period on future earnings, and found that the analysts failed to incorporate these implications when information environ-ments were weak and the analysts
inexperi-enced. The preceding discussion indicates that a firm’s information environment is as-sociated with the analysts’ forecast proper-ties.
In this study, our research investigates how the firms’ stock return synchronicity af-fects the accuracy and optimism of the ana-lysts’ annual earnings forecasts. Our research argues that the more firm-specific informa-tion that firms retain (e.g., not reflected into the market), the analysts are likely to have less relevant information, and of a lower qual-ity, about those firms and their forecasting task becomes more complex. Because stock return synchronicity is higher when the price incorporates relatively more public news, our research hypothesizes that stock return synchronicity mitigates analysts’ forecasting complexities and difficulties. Specifically, us-ing stock return synchronicity as a measure of a firm’s information environment, our search investigates how the firm’s stock re-turn synchronicity affects the analysts’ fore-cast properties, and the accuracy and opti-mism of their annual earnings forecasts. Our research expects that as a firm’s stock return incorporates more market- and industry-wide variations, relative to firm-specific informa-tion, its stock price is more synchronous with the market. Because a higher synchronicity represents the higher quality of a firm’s in-formation environment, our research posits that higher synchronicity positively affects the analysts’ forecast properties. Following these discussions, our research develops and em-pirically tests the following hypothesis.
Methods
Sample
To construct our sample, our study started with the analysts’ annual earnings forecasts drawn from the US detailed history edition of the Institutional Brokers’ Estimate System (I/B/E/S) database for the period of the fiscal years 2001 through 2013. Our study obtained firm-related information from the annual COMPUSTAT database. Our study retained stock price and return data from the Center for Research into Security Prices (CRSP) database. To measure the stock re-turn synchronicity, weekly stock rere-turn data from the CRSP were assigned to each firm’s fiscal year from COMPUSTAT to match the
time period of its reported financial data. Our study required all sample firms to be avail-able in the CRSP and retained firms with at least 45 weekly return observations per year, and with a primary SIC code. Following pre-vious research, our study required at least 10 firms within the narrowest SIC grouping and excluded (regulated) utility (SIC codes 4900-4999) and financial firms (SIC codes 6900-6999) from the sample. To mitigate the in-fluence of extreme observations, our study winsorized the observations at the 1th and 99th percentiles. Table 1 describes the de-scriptive statists for our sample. As seen in Table 1, the sample firm-year observations increase steadily from 1,015 in 2001 to 1,485 in 2013. The final sample consists of 17,703 firm-year observations over the thirteen year period.
Stock Return Synchronicity
Following Durnev et al. (2003) and Piotroski and Roulstone (2004), we calculated firm-specific measures of the stock return synchronicity from a standard market model regression as
...(1)
where Ri ,tis firm i’s returns in year t, RM, t is the CRSP value-weighted market returns in year t, and RI, t is the firm i’s primary SIC in-dustry I’s value-weighted return in year t. Stock return synchronicity is measured for each-firm year in the sample period. R2 is the
coefficient of determination and firm-specific volatility of the market comovement (synchronicity) is measured by (1-R2) from
Equation (1). Following extant studies, we computed synchronicity (synch) as
. ...(2)
Table 1. Distribution of Number of Firms
Year No. of Firms Percent
2001 1,015 5.73
2002 1,192 6.73
2003 1,187 6.71
2004 1,357 7.67
2005 1,395 7.88
2006 1,427 8.06
2007 1,461 8.25
2008 1,418 8.01
2009 1,398 7.90
2010 1,422 8.03
2011 1,468 8.29
2012 1,478 8.35
2013 1,485 8.39
Total 17,703 100.00
, = + 1∗ , + 2∗ , +
Cho et al.
306
Stock return synchronicity is based on the correlation between the individual firm’s stock returns and the returns of the overall market and the corresponding industry. Piotroski and Roulstone (2004) characterized Synch as the degree to which the market and industry information explains firm-level stock return variations. Synch assesses the portion of individual firms’ stock returns that can be explained by the market and industry, while the residual (unexplained) portion captures firm-specific information impounded in the firms’ returns. Stock return synchronicity is higher when the price incorporates relatively more public news and the residual compo-nent of the returns represents firm-specific information. Therefore, high values of Synch indicate a higher level of market- and indus-try-level information (i.e., a lower level of firm-specific return variation relative to con-temporaneous market and industry return variations) and represent the higher quality of a firm’s information environment. To con-struct the stock return synchronicity measure, our study followed the common practice of the log transformation of R2. This
transfor-mation allowed us to use an unbounded con-tinuous variable with a more normal distri-bution. Additionally, our study used lagged synch for firm i in year t-1 because analysts’ earnings for firm i in year t were forecasted after analysts had knowledge of the indi-vidual firms’ stock return comovement.
Analysts’ Fforecast Properties
For the analysts’ forecast properties, our study used the two most commonly used ana-lysts’ annual earnings forecast measures, fore-cast accuracy and bias. Our study measured forecast accuracy (Accuracy) as the negative value of the absolute difference between the actual annual Earnings Per Share (EPS) and the forecasted EPS, scaled by the closing
stock price at time t-1 (Price t-1). Our study multiplied the absolute forecast error by nega-tive one to make the higher value represent more accurate forecasts:
..(3)
where MFi,t , our measure of the analysts’ fore-cast consensus, is the mean value of annual EPS forecasts of all the analysts following firm i, issued within the 90-day period after the year t-1 earnings announcement date from I/B/E/S. Actuali,t is the actual EPS of firm i in year t from I/B/E/S. Our study used the mean value of the analysts’ EPS forecasts as a proxy for earnings expectations. When our study used the median value of the analysts’ annual EPS forecasts instead, our inferences were robust. If an individual analyst an-nounced multiple forecasts within the 90 day period after the year t-1 earnings announce-ment date, our study chose the most recent individual analyst’s forecasts within the 90-day period. As a forecast optimism measure, our study measured the analysts’ forecast bias (Bias). Our study defined Bias as the signed difference between the analysts’ consensus EPS forecast and the actual EPS, scaled by Pricet-1:
...(4)
Because Bias is the signed difference value, the higher value of Bias means there is more positive optimism in the analysts’ an-nual forecasts.
Empirical Results and
Discussion
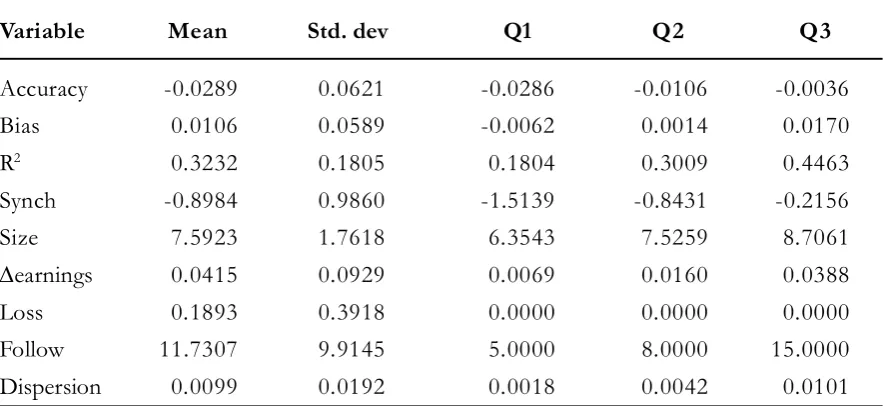
In Table 2 our study presents descrip-tive statistics of our variables of interest. The
, = − ( , − , −1 , )
, = , − ,
mean and median of Accuracy are -0.0289 and -0.0106, respectively. By construction, these values are negative. The more accurate the analysts’ forecasts are, the closer Accuracy comes to zero. The mean (0.0106) and me-dian (0.0014) of Bias are positive. These
re-sults indicate that the analysts’ annual fore-casts are optimistic and are consistent with the literature.
The mean and median of R2s from Eq.
(1) are 0.3232 and 0.3009. The mean value of 0.3232 indicates that 32.32 percent of firm
Table 2. Descriptive Statistics of Firm Characteristics (n=17,703)
Variable Mean Std. dev Q1 Q2 Q3
Accuracy -0.0289 0.0621 -0.0286 -0.0106 -0.0036
Bias 0.0106 0.0589 -0.0062 0.0014 0.0170
R2 0.3232 0.1805 0.1804 0.3009 0.4463
Synch -0.8984 0.9860 -1.5139 -0.8431 -0.2156
Size 7.5923 1.7618 6.3543 7.5259 8.7061
earnings 0.0415 0.0929 0.0069 0.0160 0.0388
Loss 0.1893 0.3918 0.0000 0.0000 0.0000
Follow 11.7307 9.9145 5.0000 8.0000 15.0000
Dispersion 0.0099 0.0192 0.0018 0.0042 0.0101
Variable definitions:
Accuracy: , where MFI,t is the mean value of the annual EPS forecasts of all the analysts following firm i, issued within the 90-day period after the year t-1 earnings announcement date and ActualI,t is the actual EPS of firm i in year t.
Bias: Signed difference between the actual EPS and forecasted EPS, scaled by Price t-1, by the closing stock price at year t-1.
Synch: Natural logarithm of from Ri,t = + 1 * RM,t + 2 * RI,t + , where RI ,t is the firm I’s returns in year t, RM, t is the CRSP value-weighted market returns in year t, and Ri,t is firm i’s primary SIC industry
i’s value-weighted return in year t.
R2: Coefficient of determination from , where R
i ,t is the firm i’s returns in year t, RM, t is the CRSP value-weighted market returns in year t, and Ri,t is firm i’s primary SIC industry I’s value-weighted return in year t.
Size: Natural logarithm of price per share multiplied by the number of shares outstanding at year t.
earnings: Absolute value of the magnitude of change in the current year’s earnings per share from previous year’s earnings per share
Loss: Indicator variable where 1 is for the loss firm year and 0 for otherwise Follow: Number of analysts following firm i.
Dispersion: Standard deviation of analysts’ annual earnings forecasted, scaled by the closing stock price at year t-1.
− ( , − ,
, −1 )
Cho
et al.
30
8
*, **, and *** indicate statistical significance at the 10, 5, and 1 % levels, respectively. All variables are defined in Table 2.
i’s returns are explained by contemporaneous market and industry movements. The residual component of returns represents firm-spe-cific information, which is unexplained by market comovement. These R2s are
consid-erably distributed. Inter-quartile ranges are from 0.1804 (25th percentile) and 0.4463 (75th
percentile). The mean and median of Synch, firmspecific return variation measure, are -0.8984 and -0.8431, respectively. Synch is the log transformation value of R2. While the
bottom quartile Synch is -1.5139, the top quartile is -0.2156. Our sample firms also show considerable variation in other firm characteristic variables.
Table 3 reports the correlation matrix. Spearman rank correlations appear above the diagonal and Pearson correlations below. Be-cause both correlations show almost identi-cal results, our study reports only the Spearman rank correlation results. First, there exists a significant positive correlation be-tween Synch and R2 (0.9999, p-value <
0.0001). As our study expected, there is a sig-nificant positive correlation between Synch and Accuracy (0.0845, p-value < 0.0001) and a significant negative correlation between Synch and Bias (-0.0766, p-value < 0.0001). These results show that as individual firms’ stock returns and market and industry stock price movements are more positively associ-ated, analysts’ forecasts become more accu-rate and less positively biased. In untabulated results, our study further investigated the correlation between the information asymme-try measure and our variables of interest. As a proxy for information asymmetry, our study used Spread, which is the median daily clos-ing bid-ask spread scaled by the average of the closing bid and ask prices median during the 45-day period before the year t-1 earn-ings announcement date. The correlation be-tween Spread and Synch is significantly
nega-tive (-0.1893, p-value < 0.0001). The corre-lation between Spread and Accuracy is signifi-cantly negative (-0.3219, p-value < 0.0001) and the correlation between Spread and Bias is significantly positive (0.1752, p-value < 0.0001). These results indicate that as Synch increases, there is less information asymme-try. The correlations among the other vari-ables support the results reported in previ-ous studies.
To investigate the relationship between the analysts’ forecast properties and the firm-specific stock return synchronicity, our study estimated the following OLS regressions. For heteroscedasticity and correlation among the observations, the standard errors are clustered by both firm and time following Gow et al. (2010) in order to report the p-values.
...(5) Accuracy (or Bias), our measure of the ana-lysts’ forecast properties, is the dependent variable in this study. Our main independent variable, Synch, captures the degree to which market and industry information is im-pounded into individual firms’ stock prices. Synch measures the ability of market-wide information to account for firm-level stock returns and has been considered to represent a firm’s information environment. High val-ues of Synch designate a higher level of mar-ket- and industry-level information and a lower level of firm-specific information.
Following previous research, our study included the following additional variables that have been reported to be associated with earnings forecast accuracy and bias to
con-Forecast Propertiesi,t: 0 + 1 ℎ, −1
+ 2 , + 3 ,
+ 4 , + 5 ,
Cho et al.
310
trol for possible biases. To control for any potential omitted variables correlated with firm size, our study added Size. Size is the natural logarithm of the price per share mul-tiplied by the number of shares outstanding at year t. To control for earnings forecast com-plexity, our study included earnings and Loss. earnings is the magnitude of change in the current year’s earnings and Loss is in an indi-cator variable, 1 for the loss firm year and 0 for otherwise. Previous research reports that analysts’ forecasts are more positively biased and less accurate in a loss year and the size of the change in earnings is connected with the analysts’ forecast accuracy (e.g., Lang and Lundholm 1996; Brown 2001; Duru and Reeb 2002). Our research also included Follow and Dispersion to control for forecast attributes. Follow is the number of analysts following firm i. Previous studies reported that as more analysts follow firm i, the analysts’ forecast-ing accuracy improves and becomes less op-timistically biased (e.g., Lys and Soo 1995;
Das et al. 1998). Dispersion is the standard deviation of analysts’ annual earnings fore-casts, scaled by the closing stock price at year t-1. Previous research suggests that forecast dispersion is positively related to uncertainty among analysts so that Dispersion is associ-ated with less accurate and less optimistic forecasts (e.g., Lang and Lundholm 1996; Bamber et al. 1997: Gu and Wu 2003).
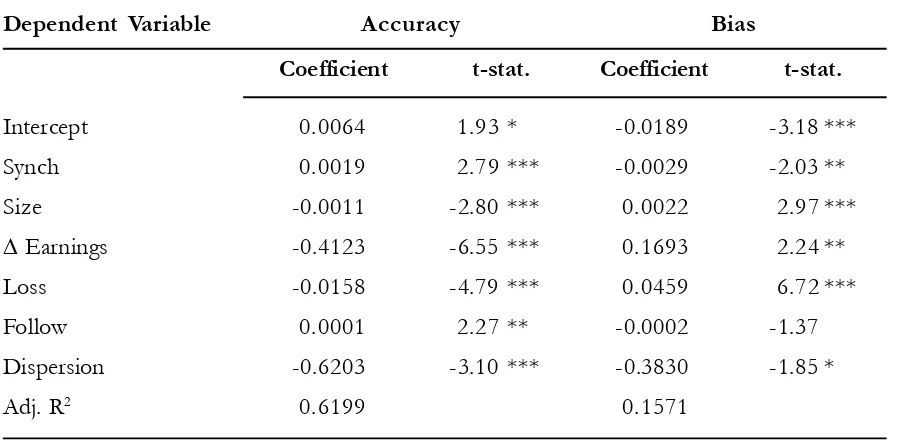
Table 4 shows the results of our primary tests. Our study ran multiple regressions to examine our hypothesis, after controlling for potential determinants that are associated with earnings forecast accuracy and bias. In Table 4, our study analyzed the relation be-tween stock return synchronicity and analysts’ forecast properties, Accuracy and Bias. As re-ported in the first column of Table 4, when the dependent variable is Accuracy, the coeffi-cient on Synch is positive (0.0019) and sig-nificant at the 1 percent level, consistent with our univariate results in Table 3. These re-sults indicate that as more market- and
in-Table 4. Regression Analysis (n=17,703)
Dependent Variable Accuracy Bias
Coefficient t-stat. Coefficient t-stat.
Intercept 0.0064 1.93 * -0.0189 -3.18 ***
Synch 0.0019 2.79 *** -0.0029 -2.03 **
Size -0.0011 -2.80 *** 0.0022 2.97 ***
Earnings -0.4123 -6.55 *** 0.1693 2.24 **
Loss -0.0158 -4.79 *** 0.0459 6.72 ***
Follow 0.0001 2.27 ** -0.0002 -1.37
Dispersion -0.6203 -3.10 *** -0.3830 -1.85 *
Adj. R2 0.6199 0.1571
dustry-wide information accounts for firm-level stock returns, analysts’ annual earnings forecasts are more accurate. These results suggest that stock return synchronicity af-fects analysts to forecast annual earnings more accurately. As our second test, our study ran a separate regression with Bias as another de-pendent variable and the results are reported in the second column of Table 4. As we ex-pected, we found a significantly negative Synch coefficient (-0.0029) at the 5 percent level.1 Our research found that when firms’
returns are more synchronous with market and industry information, the analysts tend to is-sue less optimistically biased forecasts. These results indicate that greater stock return synchronicity is negatively related to optimis-tic analysts’ forecast bias. The consequences for the control variables are comparable to those of other studies. The coefficients on all the control variables are significantly dif-ferent from zero at the conventional level and have the expected signs. The only exception is Follow in the bias model. The coefficient on Follow is not significant, but with the ex-pected negative sign. In both models, Äearnings and Loss, negatively affect analysts’ forecasting accuracy and positively affect their bias. These results verify that the mag-nitude of change in the current year’s earn-ings and the poor operation results negatively affect analysts’ forecast properties. Dispersion, uncertainty among the analysts, is also con-nected with less accurate and less biased ana-lysts’ forecasts.
Overall, these results indicate that stock return synchronicity positively influences ana-lysts’ forecast properties. The estimated Synch coefficient is significantly positive in the
ac-curacy model, consistent with our hypothesis. In the bias model, our research find that the negative coefficient is on Synch, which is also consistent with our hypothesis that analysts’ annual earnings forecasts for firms with more synchronous and more market- and industry-wide information are more accurate and less biased. Higher stock return synchro-nicity means less firm-specific information and the higher quality of a firm’s information envi-ronment. Specifically, for firms with stock returns that can be explained by the market and industry (e.g., with less firm-specific in-formation impounded in firms’ returns), the analysts’ annul earnings forecasts are more accurate and less positively biased. As more value-relevant firm-related information is reflected into the market, the firms’ informa-tion environment improves. This indicates that as its informativeness improves (e.g., less unexplained firm-specific information), it positively affects the analysts’ forecast prop-erties. In addition, untabulated results indi-cate that the correlation between the infor-mation asymmetry measure (Spread) and Synch is significantly negative. Spread is significantly and negatively related to Accuracy, and posi-tively to Bias. These results show that as Synch increases, there is less information asymme-try. In summary, our results suggest that a higher Synch is associated with a lower infor-mation asymmetry because a firm’s stock price with a higher Synch reflects more mar-ket-level and industry-level information, rela-tive to firm-specific information. As a result, when stock return synchronicity is high, ana-lysts’ forecasts are more accurate and less biased.
Cho et al.
312
Conclusion
Using a sample of U.S. firms over the period from 2001-2013, our research inves-tigated the relationship between a firm’s in-formation environment and analysts’ forecast properties. Our research posited that if more firm-specific information exists, the analysts were likely to have less information about those firms and their forecasting task would become more difficult. To study this relation-ship, using stock return synchronicity as the measure of a firm’s information environ-ment, our research investigated how the firms’ stock return synchronicity affected the ana-lysts’ forecast properties for the accuracy and optimism of the analysts’ annual earnings forecasts. Stock return synchronicity repre-sents the degree to which market and indus-try information explains firm-level stock re-turn variations. Higher stock rere-turn synchronicity indicates a better information environment because a firm’s stock price re-flects more market-level and industry-level information relative to firm-specific informa-tion. Our research hypothesized that stock return synchronicity mitigated the analysts’ forecasting difficulties because a higher stock return synchronicity represents the higher quality of a firm’s information environment. Our study has several implications. Our findings emphasize the importance of a firm’s information environment and its effect on analysts’ forecasting tasks. They show that stock return synchronicity positively influ-ences the analysts’ forecast properties. For firms with stock returns that can be explained more by the market and industry (e.g., with less firm-specific information reflected in the market), analysts’ annul earnings forecasts are more accurate and less biased. These results indicate that as a firms’ information environ-ment improves, it alleviates the analysts’
fore-casting complexities and difficulties, and therefore positively affects the forecast’s prop-erties. Our results suggest that the gathering and dissemination of firm related informa-tion is associated with the analysts’ forecast properties. Specifically, our results highlight the importance of the facilitation of the re-flection of firm-specific information into the market. Our finding that a firm’s information environment is associated with the analysts’ forecast properties suggests that market par-ticipants, such as the analysts and investors, could benefit from the reflection of more firm-specific information and the facilitation of the impounding process. It also empha-sizes the importance of the prompt dissemi-nation of value relevant information into the market to increase the stock market’s effi-ciency.
There also exist some limitations in our study. Following extant research, our research included in our test model a number of con-trol variables which appear to potentially af-fect the analysts’ forecasting accuracy and bias. However, our research could not con-trol for all the possibly influential factors in this study. In addition, our research implic-itly limited our sample by requiring certain restrictions, including that all the sample firms had analysts’ annual earnings forecasts. With these restrictions, our sample firms were lim-ited to relatively big ones with easily avail-able public information. During our 2001-2013 sample period, there were several regu-lation changes that could affect the firms in-formation environment. However, most of these changes were intended to facilitate the dissemination of the firm-specific infor-mation’s flow into the market, which likely attenuated our findings.
prop-erties. This study suggests that a firm’s
infor-mation environment is related positively to the analysts’ forecast properties and mitigatestheir forecasting difficulties.
Reference
Abarbanell, J. S., and V. L. Bernard. 1992. Tests of analysts’ overreaction/underreaction to earnings infor-mation as an explanation for anomalous stock price behavior. The Journal of Finance 47 (3): 1181– 1207.
Abarbanell, J. S., and B. J. Bushee. 1997. Fundamental analysis, future earnings, and stock prices. Journal of Accounting Research 35: 1–24.
Bamber, L. S., O. E. Barron, and L. S. Thomas. 1997. Trading volume and different aspects of disagree-ment coincident with earnings announcedisagree-ments. The Accounting Review 72 (4): 575–597.
Barberis, N., A. Shleifer, and J. Wurgler. 2005. Comovement. Journal of Financial Economics 75(2): 283–317. Brown, L. D. 2001. A temporal analysis of earnings surprises: Profits versus losses. Journal of Accounting
Research 39 (2): 221–241.
Bradshaw M. T., S. Richardson, and R. Sloan. 2001. Do analysts and auditors use information in accruals?
Journal of Accounting Research 39: 45–74.
Byard, D., Y. Li, and J. Weintrop. 2006. Corporate governance and the quality of financial analysts’ infor-mation. Journal of Accounting and Public Policy 25 (5): 609–625.
Chan, K., and A. Hameed. 2006. Stock price synchronicity and analyst coverage in emerging markets.
Journal of Financial Economics 80 (1): 115–147.
Chen, Q., I. Goldstein, and W. Jiang. 2007. Price informativeness and investment sensitivity to stock price.
Review of Financial Studies 20 (3): 619–650.
Cho, J. and J. Park. 2015. Earnings volatility and firm-specific return variation. Working Paper. Hanyang University, Seoul, Korea.
Clement, M. B. 1999. Analyst forecast accuracy: Do ability, resources, and portfolio complexity matter?
Journal of Accounting and Economics 27 (3): 285–303.
Das, S., C. Levine, and K. Sivaramakrishnan. 1998. Predictability and Bias in Analysts? Earnings Forecasts.
The Accounting Review, 73(2): 277–294.
Dasgupta, S., Gan, J., and N. Gao. 2010. Transparency, price informativeness, and stock return synchronicity: Theory and evidence. Journal of Financial and Quantitative Analysis 45 (5): 1189–1220
Durnev, A., R. Morck, B. Yeung, and P. Zarowin. 2003. Journal of Accounting Research 41 (5): 797–836. Duru, A. and D. M. Reeb. 2002. International Diversification and Analysts’ Forecast Accuracy and Bias.
The Accounting Review 77 (2): 415–433.
Gow, I., G. Ormazabal, and D. Taylor. 2010. Correcting for cross-sectional and time-series dependence in accounting research. The Accounting Review 85: 483–512.
Cho et al.
314
Harrison H., and J. D. Kubik. 2003. Analyzing the Analysts: Career Concerns and Biased Earnings Fore-casts. The Journal of Finance 58 (1): 313–351.
Hutton, A.P., A. J. Marcus, and H. Tehranian. 2009. Opaque financial reports, R2, and crash risk. Journal of Financial Economics 94: 67–86.
Kelly, P. J. 2014. Information efficiency and firm-specific return variation. The Quarterly Journal of Finance
4 (04): 1450018-1–1450018-44.
Lang, M. H., and R. J. Lundholm. 1996. Corporate disclosure policy and analyst behavior. The Accounting Review 71 (4): 467–492.
Lim, T. 2001. Rationality and analysts’ forecast bias. The journal of Finance 56 (1): 369–385.
Lys, T., and L. Soo. 1995. Analysts’ forecast precision as a response to competition. Journal of Accounting, Auditing, and Finance 10 (Fall): 751–763.
Mikhail. M. B., B. R. Walther, and H. W. Richard. 1997. Do security analysts improve their performance with experience? Journal of Accounting Research 35: 131–157.
Morck, R., B. Yeung, and W. Yu. 2000. The information content of stock markets: Why do emerging markets have synchronous stock price movements? Journal of Financial Economics 58: 215–260. Piotroski, J. D., and D. T. Roulstone. 2004. The influence of analysts, institutional investors and insiders on
the incorporation of market, industry and firm-specific information into stock prices. The Account-ing Review 79: 1119–1151.
Roll, R. 1988. R2. Journal of Finance 43: 541–566.
Sinha, P., L. Brown, and S. Das. 1997. A re-examination of financial analysts’ differential earnings forecast accuracy. Contemporary Accounting Research 14: 1–42.
Stober, T. L. 1992. Summary financial statement measures and analyst forecast of earnings. Journal of Accounting and Economics 15: 347–372.