Corresponding author: [email protected]
Level of adipokines and insulin resistance
in obese Javanese population
Pramuji Hastuti*, Tasmini, Ahmad Hamim Sadewa, Chornelia DM, Karita D
Department of Biochemistry, Faculty of Medicine, Universitas Gadjah Mada, Yogyakarta Indonesia
ABSTRACT
Obesity is a condition involving low-level chronic inlammation as indicated by increased levels of C-reactive protein (CRP), tumor necrosis factor alpha (TNF-α), interleukin (IL) and
other inlammatory markers in the blood. Some endocrine mediators, such as paracrine and autocrine play an important role in regulating the function of adipocytes, especially related to insulin sensitivity. The purpose of this study is to determine the level CRP, TNF-α, IL-6,
resistin and insulin resistance in the obese Javanese population. This was a preliminary study involving 120 people, consisting of 60 obese subjects and 60 non obese subjects as controls. Lipid proiles, CRP, TNF-α, IL-6, resistin levels were determined with ELISA
methods, whereas insulin resistance was calculated by HOMA IR index.The study found that the glucose, insulin, CRP levels and HOMA-IR of obese subjects were signiicantly higher than those non obese subjects (p<0.05). However, the TNF-α, IL-6 and resistin
levels were not signiicantly different between obese and non obese subjects (p>0.05). In conclusion, the CRP levels ad insulin resistance in obese Javanese population were higher compared with those non obese.
ABSTRAK
Obesitas merupakan suatu kondisi yang melibatkan peradangan kronis tingkat rendah seperti ditunjukkan oleh peningkatan kadar protein C-reaktif (CRP), tumor necrosis factor alpha (TNF-α), interleukin (IL) dan penanda inlamasi lainnya dalam darah. Beberapa
mediator endokrin, seperti parakrin dan autokrin berperan penting dalam mengatur fungsi adiposit, terutama yang berkaitan dengan sensitivitas insulin. Tujuan penelitian ini adalah untuk menetapkan kadar CRP, TNF-α, IL-6, resistin dan resistensi insulin pada populasi
Jawa obes. Penelitian ini merupakan studi pendahuluan yang melipatkan 120 subjek, terdiri dari 60 subjek obes 60 tidak obes sebagai kontrol. Proil lipid, kadar CRP, TNF-α,
IL-6, dan resistin diukur dengan metode ELISA, sedangkan resistensi insulin dihitung dengan indeks IR HOMA. Dari penelitian ini ditemukan bahwa kadar glukosa, insulin, CRP, dan HOMA-IR subjek obes lebih tinggi secara bermakna dibandingkan subjek non obes (p<0,05). Namun demikian kadar TNF-α, IL-6 dan resistin tidak berbeda bermakna
antara kelompok subjek obes dan non obes (p> 0,05). Dapat disimpulkan, kadar CRP dan resistensi insulin pada populasi Jawa obes lebi tinggi dibandingkan dengan mereka yang tidak obes.
INTRODUCTION
In 2013, Ministry of Health, Republic of Indonesia reported 18.8% of population in 12 major cities in Indonesia were overweight and 3.7% of them were obese.1 Obesity involves
a state of low-level chronic inlammation as
indicated by increased levels of C-reactive protein (CRP), tumor necrosis factor-alpha
(TNF-α), interleukin, resistin and other inlammatory markers in the blood. Some
endocrine mediators such as, paracrine and autocrine derived from adipose tissue play an important role in regulating the function of adipocytes, especially those related to
insulin. Signiicant complications of obesity,
especially insulin resistance include many
of the risk factors of type 2 diabetes mellitus
(type 2 DM).2,3.
Adipokines (adipocitokines) include TNF-α, IL-6, resistin and CRP are secreted
primarily in adipose cells in mice and mononuclear cells in humans as a result of
inlammation process. Adipokines play an
important role in regulating energy, glucose and fat homeostasis and maintain fasting blood glucose levels by modulating hepatic insulin.4 Low levels of adipokines are already
in circulation, but there are increased levels in people with insulin resistance, type 2 DM and cardiovascular disease. Hypoadiponectinemia
increases the risk of coronary artery disease, and shows that adipokine plays a role in
metabolic syndromes.5 It was reported that the
increase of risistin levels not only stimulates the expression but also degrades of low density
lipoprotein-cholesterol (LDL-cholesterol)
receptors in liver cells.6
Resistin is an antagonist of insulin and mediates insulin-signaling pathways playing a role in the pathogenesis of insulin resistance. Excessive resistin expression in adipose tissues of obese people might act to
of TNF-α in animals induced insulin resistance while decreasing TNF-α improve
insulin sensitivity. There is increasing levels
of TNF-α in patients with diabetes correlated
with Body Mass Index (BMI) and Homeostatic Model Assessment of Insulin Resistance (HOMA-IR). This relationship was stronger in women than men.8 Over production of
cytokine is correlated with the initial onset of inlammation and is a prognostic indicator of inlammation due to obesity and metabolic syndromes. IL-6 as a mediator of inlammatory,
acting as an autocrine regulator of adipocytes may cause the negative effects on metabolic processe.9 This was a preliminary study in
order to evaluate the levels of adipokines and
insulin resistance in obese Javanese people in
Yogyakarta Special Region, Indonesia.
MATERIALS AND METHODS
Subjects
This was an observational study with a cross sectional design in order to compare
the adipokines levels and insulin resistance
in obese with non obese Javanese people in Indonesia. One hundred and twenty subjects
consisting 60 obese subjects and 60 non
obese subjects were involved in this study.
Subjects with body mass index (BMI) > 25
for obese and 18.5 to 23 for non obese with the ages from 18 to years were included in
this study. Subjects who taking corticosteroid
and antibiotics were excluded from this study. The protocol of this study has been approved by the Medical Health Research Ethics Committee, Faculty of Medicine, Universitas
Gadjah Mada, Yogyakarta.
Protocol
signing an informed consent form. After obtaining written informed consent, all subjects were screened through a detailed questionnaires, medical history and physical examination. Age, sex, height, weight, BMI, waist to hip ratio, blood pressure, family history and present medications were recorded for each subject.
Each subject who fulilled the inclusion
and exclusion criteria, blood sample was collected for analysis. Blood glucose level was estimated by glucose oxidase-peroxidase method, cholesterol was estimated by cholesterol oxidase-peroxidase method,
high density lipoprotein-cholesterol
(HDL-cholesterol) was estimated by the glycerol-3-phosphate oxidase-peroxidase-N-methyanilin propan-sulphonate sodic method and triglyceride was estimated by
GPO-POD-ESPT method using auto analyzer. Serum CRP, TNF-α, IL-6, resistin and insulin levels were measured using ELISA method. The insulin
resistance was estimated by the HOMA-IR index calculation as follow : (insulin (µU/
mL) x [glucose(mmol/L)/22.5]. Subjects were
considered having insulin resistance if HOMA
IR value >2.0.10
Statistical analysis
Data of obese and non obese groups were
presented as mean ± standard deviation (SD) and analyzed by student t test. The statistical analysis was considered signiicant if p value
<0.05.
RESULTS
One hundred and twenty subjects
consisting 60 obese and 60 non obese were
involved in this study. The characteristics
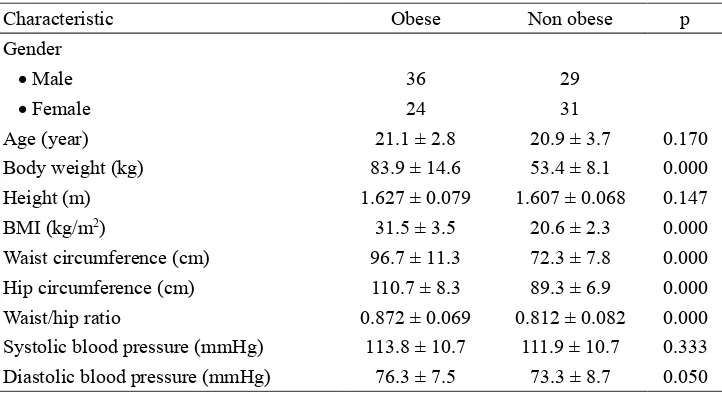
of subjects are presented in TABLE 1. Signiicantly higher in the body weight, BMI,
waist/hip ratio and diastolic blood pressure between obese and non obese groups were observed in this study (p<0.05). The higher waist circumference value in the obese group compared to non obese group indicated that they have abdominal obesity.
TABLE 1. Characteristic of subjects (mean ± SD).
Characteristic Obese Non obese p
Gender
• Male 36 29
• Female 24 31
Age (year) 21.1 ± 2.8 20.9 ± 3.7 0.170
Body weight (kg) 83.9 ± 14.6 53.4 ± 8.1 0.000
Height (m) 1.627 ± 0.079 1.607 ± 0.068 0.147
BMI (kg/m2) 31.5 ± 3.5 20.6 ± 2.3 0.000
Waist circumference (cm) 96.7 ± 11.3 72.3 ± 7.8 0.000
Hip circumference (cm) 110.7 ± 8.3 89.3 ± 6.9 0.000
Waist/hip ratio 0.872 ± 0.069 0.812 ± 0.082 0.000
Systolic blood pressure (mmHg) 113.8 ± 10.7 111.9 ± 10.7 0.333
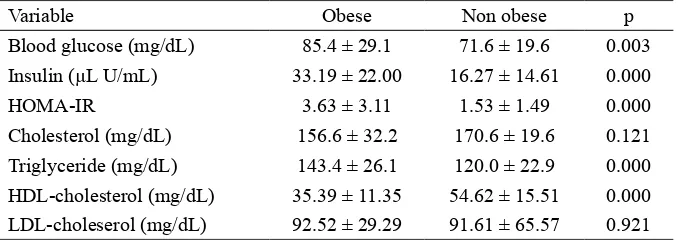
TABLE 2 showed lipid proile and HOMA
IR value of obese and non obese groups.
Signiicantly higher in the blood glucose and
insulin levels as well as HOMA IR value in the obese group compared to non obese
group were observed in this study (p<0.05).
Moreover, signiicantly higher in triglyceride level and signiicantly lower in
HDL-cholesterol level in obese group compared to non obese group were also reported (p<0.05).
TABLE 2. Level blood glucose, insulin, HOMA IR and lipid proile (mean ± SD) in obese and non obese groups
Variable Obese Non obese p
Blood glucose (mg/dL) 85.4 ± 29.1 71.6 ± 19.6 0.003
Insulin (µL U/mL) 33.19 ± 22.00 16.27 ± 14.61 0.000
HOMA-IR 3.63 ± 3.11 1.53 ± 1.49 0.000
Cholesterol (mg/dL) 156.6 ± 32.2 170.6 ± 19.6 0.121
Triglyceride (mg/dL) 143.4 ± 26.1 120.0 ± 22.9 0.000
HDL-cholesterol (mg/dL) 35.39 ± 11.35 54.62 ± 15.51 0.000
LDL-choleserol (mg/dL) 92.52 ± 29.29 91.61 ± 65.57 0.921
TABLE 3 showed adipokines level in obese and non obese groups. Signiicantly
higher in CRP and resistin levels in obese group compared to non obese group were
observed (p<0.05). In contrast, no signiicantly different in TNF-α and IL-6 in both groups
were reported.
TABLE 3. Level of CRP, TNF-α, IL-6 and resistin (mean ± SD) in obese and non obese subjects
Variable Obese Non obese p
CRP (mg/L) 1.543 ± 0.976 1.044 ± 0.256 0.000
TNF-α (pg/mL) 58.32 ± 97.52 59.43 ± 53.52 0.939
IL-6 (pg/mL) 6.19 ± 8.59 8.75 ± 7.77 0.089
Resistin (pg/mL) 1,552.6 ± 306.3 1,250.0 ± 288.9 0.000
DISCUSSION
Obesity is associated with a low-grade
inlammatory process in the white adipose
tissue (WAT) that leads to increase of
circulation of inlammatory markers such as IL-6, CRP, and TNF-α. In this study (TABLE 2), signiicantly higher blood glucose, insulin,
triglyceride levels and HOMA-IR value in the obese subjects compared with those in non obese subjects were found. In contrast,
signiicantly lower HDL-cholesterol in the
signiicantly higher in CRP and resistin levels
in the obese subjects compared with those in
non obese subjects were also found (TABLE
3).
Increases of these inlammation markers are caused by two phases. In the irst phase, the
fat tissue of obese patients becomes resistant to insulin because of the effects of several
adipokines. In the second stage, this resistance
oxidative stress, endothelial dysfunction, blood pressure and disorders of lipoprotein metabolism, all of which are harmful to health.10 Inlammation of the WAT is due to
obesity because macrophage iniltration is
caused by the development of tissue mass.12,13
Other pathways of increasing levels of
adipokines occur in response to hypoxia,
because the mass of WAT expands in obesity, and as a result, the adipocytes become further from the blood vessels causing a relative
lack of oxygen. Hypoxia then causes the
stimulation of production and release of
inlammatory cytokines, chemokines and angiogenic factors to stimulate blood low and improve vascularization.14 Adipokine
secretion is activated by extracellular and intracellular stress. Among the extracellular factors, free fatty acid (FFA) is a primary inductor of these pathways15,16 and in the obese, chronically FFA increases. Innate immunity
receptors, such as toll-like receptor-4 and -2 (TLR-4 and -2), expressed in WAT (mainly
by adipocytes, preadipocytes, macrophages and endothelial cells) are involved in the
inlammatory process associated with obesity.
FFA and other molecules produced by hypoxic conditions during obesity activate
these receptors, particularly TLR4.17,18
FFA also activate macrophages, especially
CD11c+, through TLR-4, exacerbating pro-inlammatory activity.19,20
The CRP levels in obese group in this
study was signiicantly higher than that in non
obese groups. This result is consistent with
other previous research indings. CRP levels
were associated with decreased levels of
HDL-cholesterol and insulin resistance, and
increased BMI, waist circumference, blood pressure, triglyceride, blood glucose, insulin,
HOMA-β. In addition, HOMA-IR showed a signiicant correlation between CRP levels
and metabolic syndrome, including adiposity,
hyperinsulinemia and insulin resistance.4,21,22
Recent research shows that there is a strong correlation between fasting insulin with CRP levels.23 In women, the increase of CRP levels
are correlated with the increase of fat mass.24
In this study, signiicantly higher resistin
levels in the obese group compared with that non obese group were found. Miyamoto et al.25 reported that subjects with premature
atherosclerosis have higher plasma resistin levels compared with subjects with established atherosclerosis. In addition, increased resistin expressions were found in type 2 DM, insulin resistance and obesity.26,27 However, Norata
et al.28 failed to detect any change in resistin
levels in atherosclerotic conditions. Resistin may increase the susceptibility of metabolic syndrome by regulating adiponectin secretion from adipocytes and enhancing hepatic
gluconeogenesis by inhibiting the enzymes
involved in gluconeogenesis through
AMP-activated protein kinase activation.29
In this study, no signiicantly different in the IL-6 and TGF-α levels in obese group
compared with those in non obese group were found. This result is similar with other previous study.30 Although IL-6 appears to
be increasing in obesity and decreased in response to weight loss, our results showed
no signiicantly different at baseline or in response to diet. Subcutaneous adipose tissue is estimated to release about 30% more IL-6
in systemic and visceral adipose tissue.
However, small changes of IL-6 level in obese subjects show the levels of IL-6 in obesity only about 10% of total IL-6 that is produced
by fat cells.31
Some reports indicated that in metabolic syndrome patients, the IL-6 levels increased
with BMI, however its mechanism is still
unclear. In this study, the TNF-α levels were not signiicantly associated with body weight,
fat at baseline. These results are in contrast to
previous study showing the TNF-α level were
associated with obesity.32 In addition, TNF-α
levels did not show a signiicantly decline in
response to weight loss or diet. They were
not signiicantly different after the weight loss of 7.5% at 10 weeks. It is indicated that
adipose tissue has only a small effect on the
regulation of TNF-α levels. Furthermore, it is reported that TNF-α appears to act locally in
human fat tissue33 and it is not secreted from
adipose tissue into the blood. Previous study
indicated changes in IL-6 or TNF-α after weight loss (5-9 kg) with dietary intervention
and exercise.34 Changes in IL-6 and TNF-α
were signiicantly correlated with a weight
loss diet for nine months in the group with low calorie diet.30 This result may explain
the relationship between IL-6 and TNF-α in which IL-6 provides proinlammatory activity and increases the TNF-α levels. This
possibility shows that although the weight loss
did not improve the IL-6 and TNF-α in the circulation, there appears to be a signiicant
clinical response demonstrating weight loss
gives a reduction in inlammation. High levels of TNF-α are also seen in metabolic syndrome
patients.35 The relationship between high
levels of TNF-α and metabolic syndrome is
associated with TNF-inducing NH2-terminal
kinase c-jun to mediate phosphorylation of IRS-1 serine. This relationship determines the
normal inhibition of tyrosine phosphorylation
of IRS-1 and insulin signaling.36
CONCLUSION
In conclusion, the CRP and resistin levels as well as insulin resistance are higher in obese Javanese population compared to those non obese. Further genotype study to identify
ACKNOWLEDGEMENTS
This study was supported by Ministry of Research and Technology and High Education, Republic of Indonesia through Excellent Higher Education Institution Research grant
with contract number 632/UN11-PIII/DIT-IT/2016. Authors would like to thank all
subjects who participated in this study.
REFERENCES
1. Ministry of Health, Republic of Indonesia. Indonesia Health Proile 2013. Jakarta : Ministry of Health, Republic of Indonesia, 2014.
2. de Luis DA, Aller R, Izaola O, Sagrado MRG, de la Fuente CB, and Ovalle HF, Allelic frequency of G380A polymorphism of tumor necrosis factor alpha gene and relation with cardiovascular risk factors and adipocytokines in obese patients. Nutr Hosp 2011; 26(4):711-5.
3. Rajarajeswari D, Ramalingam K, Naidu JN. Tumor necrosis factor–alpha in the development of lnsulin resistance in type 2 diabetes mellitus. Intern J Appli Biol Pharmaceut Tech 2011; 2(1): 55 – 60.
4. Al-Hamodi Z, AL-Habori M, Al-Meeri A, Saif-Ali R, Association of adipokines, leptin/ adiponectin ratio and C-reactive protein with obesity and type 2 diabetes mellitus. Diabetol Metabolic Syndr 2014; 6(99): doi: 10.1186/1758-5996-6-99
5. Rodríguez-Rodríguez E, Perea JM, López-Sobaler AM, Ortega RM. Obesity, insulin resistance and increase in adipokines levels: importance of the diet and physical activity. Nutr Hosp 2009; 24(4):415-21.
7. Duman BS, Cagatay P, Hatemi H, Ozturk M,
Association of resistin gene 3’-untranslated
region EX4-44G→A polymorphism with
obesity- and insulin- related phenotypes
in Turkish type 2 diabetes patients. Rev Diabet Stud 2007; 4(1):49-55. doi: 10.1900/ RDS.2007.4.49
8. Rajarajeswari D, Ramalingam K, Naidu
JN. Tumor necrosis factor–alpha in the development of insulin resistance in type 2 diabetes mellitus. Intern J Appli Biol
Pharmaceut Tech 2011; 2(1): 55 – 60.
9. Teixeira AA, Quinto BMR, Dalboni MA, Rodrigues CJO and Batista MC. Association
of IL-6 polymorphism -174G/C and metabolic
syndrome in hypertensive patients. Bio Med
Res Intern 2015; Article ID 927589, 6 pages 10. Wongwananuruk T, Rattanachaiyanont M,
Leerasiri P, Indhavivadhana S, Techatraisak K, Angsuwathana S, et al. The usefulness
of homeostatic measurement Assessment-Insulin Resistance (HOMA-IR) for detection of glucose intolerance in Thai women of reproductive age with polycystic ovary syndrome. Intern J Endocrinol 2012; Article
ID 571035, 6 pages
11. Trayhurn P, Bing C, and Wood IS. Adipose tissue and adipokines—energy regulation from the human perspective. J Nutr 2006; 136(7): 1935S-9S.
12. Weisberg SP, McCann D, Desai M, Rosenbaum M, Leibel RL, Ferrante AW
Jr. Obesity is associated with macrophage accumulation in adipose tissue. J Clin Invest
2003; 112:1796–808.
https://doi.org/10.1172/JCI200319246
13. Xu H, Barnes GT, Yang Q, Tan G, Yang D, Chou CJ, et al. Chronic inlammation in fat plays a crucial role in the development of obesity-related insulin resistance. J Clin Invest 2003; 112:1821–30
https://doi.org/10.1172/JCI200319451
14. Trayhurn P, Wood IS. Adipokines: inlammation and the pleiotropic role of white adipose tissue. Br J Nutr 2004; 92:347–55 https://doi.org/10.1079/BJN20041213
15. Cnop M, Fatty acids and glucolipotoxicity in the pathogenesis of type 2 diabetes, Biochem Soc Transact 2008; 36(3): 348–52.
https://doi.org/10.1042/BST0360348
16. Balistreri CR, Caruso C, and Candore G. The role of adipose tissue and adipokines in obesity-related inlammatory diseases. Mediator Inlamm 2010; Article ID 802078, 17. Ghanim H, Mohanty P, Deopurkar R, Sia
CL, Korzeniewski K, Abuaysheh S. Acute modulation of Toll-like receptors by insulin. Diabetes Care 2008; 31(9): 1827–31.
https://doi.org/10.2337/dc08-0561
18. Vitseva OI, Tanriverdi K, Tchkonia TT, Kirkland JL, McDonnell ME, Apovian CM, et al. Inducible toll-like receptor and NF-κB regulatory pathway expression in human adipose tissue. Obesity 2008; 16 (5): 932–37. https://doi.org/10.1038/oby.2008.25
19. Shi H, Kokoeva MV, Inouye K, Tzameli I, Yin H, and Flier JS. TLR4 links innate immunity and fatty acid-induced insulin resistance. J Clin Invest 2006; 116 (11): 3015–25.
https://doi.org/10.1172/JCI28898
20. Nguyen MTA, Favelyukis S, Nguyen AK, Reichart D, Scott PA, Jenn A, et al. A subpopulation of macrophages iniltrates hypertrophic adipose tissue and is activated by free fatty acids via toll-like receptors 2 and 4 and JNK-dependent pathways. J Biol Chem 2007; 282(48):35279-92.
https://doi.org/10.1074/jbc.M706762200 21. Temelkova-Kurktschiev T, Siegert G,
22. Chou HH, Hsu LA, Liu CJ, Teng MS, Wu S, et al. Insulin resistance is associated with C-reactive protein independent of abdominal obesity in nondiabetic Taiwanese. Metabolism 2010: 59 (6): 824-30.
https://doi.org/10.1016/j.metabol. 2009. 09. 030
23. Pradhan AD, Cook NR, Buring JE, Manson JE, Ridker PM. C-reactive protein is independently associated with fasting insulin in nondiabetic women. Arterioscler Thromb Vasc Biol 2003; 23: 650-65.
https://doi.org/10.1161/01.ATV.0000065636. 15310.9C
24. Aguirre L, Napoli N, Waters D, Qualls C, Villareal DT, Armamento-Villareal R. Increasing adiposity is associated with higher adipokine levels and lower bone mineral density in obese older adults. J Clin Endocrinol Metab 2014; 99(9):3290–7. https://doi.org/10.1210/jc.2013-3200
25. Miyamoto Y, Morisaki H, Kokubo Y, Yamanaka I, Tomoike H, Okayama Y, et al. Resistin gene variations are associated with the metabolic syndrome in Japanese men. Obes Res Clin Pract 2009; 3: I-II. doi: 10.1016/j.orcp.2008.11.003.
https://doi.org/10.1016/j.orcp.2008.11.003 26. Galic S, Oakhill JS, Steinberg GR. Adipose
tissue as an endocrine organ. Mol Cell Endocrinol 2010; 316:129-39.
https://doi.org/10.1016/j.mce.2009.08.018 27. Zhang MH, Na B, Schiller NB, Whooley MA.
Association of resistin with heart failure and mortality in patients with stable coronary heart disease: data from the heart and soul study. J Card Fail 2011; 17(1):24-30. doi: 10.1016/j.cardfail.2010.08.007.
https://doi.org/10.1016/j.cardfail.2010.08.007 28. Norata GD, Ongari M, Garlaschelli K, Raselli
S, Grigore L, Catapalo AL. Plasma resistin levels correlate with determinants of the metabolic syndrome. Eur J Endocrinol 2007; 156(2):279-84.
29. Weisberg SP, McCann D, Desai M, Rosenbaum M, Leibel RL, Ferrante Jr AW. Obesity is associated with macrophage accumulation in adipose tissue. J Clin Invest 2003; 112(12):1796-808.
https://doi.org/10.1172/JCI200319246
30. Mitchell M, Armstrong DT, Robker RL, Norman RJ. Adipokines: implications for female fertility and obesity. Reproduction 2005; 130: 583-97.
https://doi.org/10.1530/rep.1.00521
31. Rolland C, Hession M, Broom I. Effect of weight loss on adipokine levels in obese patients. Diabetes Metab Syndr Obes 2011; 4: 315–23.
https://doi.org/10.2147/DMSO.S22788 32. Arvidsson E, Viguerie N, Andersson I, Verdich
C, Langin D, Arner P. Effects of different hypocaloric diets on protein secretion from adipose tissue of obese women. Diabetes 2004; 53(8):1966–71.
https://doi.org/10.2337/diabetes.53.8.1966 33. Löfgren P, van Harmelen V, Reynisdottir
S, Näslund E, Rydén M, Rössner S, et al. Secretion of tumor necrosis factor-alpha shows a strong relationship to insulin-stimulated glucose transport in human adipose tissue. Diabetes 2000; 49(5):688–92.
https://doi.org/10.2337/diabetes.49.5.688 34. Dvoráková-Lorenzová A, Suchánek P, Havel
PJ, Stávek P, Karasová L, Valenta Z, et al. The decrease in C-reactive protein concentration after diet and physical activity induced weight reduction is associated with changes in plasma lipids, but not interleukin-6 or adiponectin. Metabolism 2006; 55(3):359–65.
https://doi.org/10.1016/j.metabol. 2005. 09. 010
35. Hotamisligil GS. Inlammation and metabolic disorders. Nature 2006; 444 (7121): 860–7. https://doi.org/10.1038/nature05485