C
SEE PAGE 12 FOR IMPORTANT DISCLOSURES AND ANALYST CERTIFICATIONS
Tunas Baru Lampung
(TBLA IJ)Riding two dragons
Equal exposure to sugar & palm oil, two of Indonesia’s most profitable crops.
One of nine importers of raw sugar. The only one allowed to sell sugar to retail consumers. Palm oil remains highly profitable.
Attractive at 5.4x 2014 consensus earnings, against peers plantation companies.Sweet sugar
Sugar appears on track to account for nearly half of its earnings in 2017E with its sugar refinery commenced production in 4Q13 and an integrated sugar mill to be completed in 2016E. Payback could take less than three years, according to the company. EBIT margins are 20-30% for a sugar refinery and 50% for an integrated sugar mill. Such feats are made possible by import restrictions and regulated sugar prices.
Palm oil holding the fort
TBL’s palm-oil yields should improve as its trees mature. It will also convert its low-yielding estates into sugarcane plantations. We expect FFB yields to increase to 23 tonnes/ha in 2017E from 18.9 in 2014E. In our assessment, EBIT from palm oil could grow 10% in 2017E from 2014E levels, spurred by higher FFB yields and assuming a CPO price of IDR8,000/kg or USD650/tonne.
Risks to business
Business risks mainly arise from: 1) volatile CPO prices as palm-oil production costs are more or less fixed; 2) raw-sugar prices as domestic sugar selling prices are regulated; and 3) regulatory risks from changes in import quotas for sugar and export taxes for palm oil.
Source: Maybank KE, Company, Bloomberg Note: 2014-15E based on Consensus estimates.
Share Price: IDR675 MCap (USD): 275M Indonesia
Target Price: na ADTV (USD): 0.1M Plantations
Not Rated
80
Oct-12 Feb-13 Jun-13 Oct-13 Feb-14 Jun-14
Tunas Baru Lampung - (LHS, IDR)
Tunas Baru Lampung / Jakarta Composite Index - (RHS, %)
1 Mth 3 Mth 12 Mth
Absolute(%) 2.3 5.5 45.2
Relative to index (%) 6.4 3.5 27.4
Wilianto Ie
-PT Budi Delta Swakarya 30%
October 17, 2014 2
Sugar a new earnings sweetener
TBL’s EBIT could more than double and its core net profit triple in 2017E from 2014E levels on new contributions from sugar, in our estimation. Its sugar refinery commenced operations in 4Q13 while its sugar mill will be completed in 2016E. Contributions from palm oil remain strong on improving production yields.
At current prices, per-ha sugar profitability in Indonesia matches that of palm oil. But while palm oil is a perennial crop and developing estates is capital-intensive, sugar is a cash crop and it is the sugar mills that are capital-intensive.
Figure 1: Profit per ha of palm oil
Palm oil (in USD) Year 7-22
Selling price (CPO) 660
Selling price (kernel) 330
Yield per ha (CPO) 5.5
Yield per ha (kernel) 1.0
Revenue/ha 3,960
Production cost/ha 1,925
Profit/ha (USD) 2,035
IDR/USD 12,500
Profit/ha (IDR m) 25.4
Profit margin 51%
Source: Maybank KE
Figure 2: Profit per ha for an integrated sugar mill
Sugar (in IDR) Year 1 Years 2-4
Sugar yield (tonnes) 8.1 7.2
Plantation cost/kg 2,809 2,017
Milling cost/kg 2,000 2,001
Production cost/kg 4,809 4,018
Selling price (retail) 8,500 8,500
Revenue/ha (IDR m) 68.9 61.2
Production cost/ha (IDR m) 39.0 28.9
Profit/ha (IDR m) 29.9 32.3
Profit margin 43% 53%
Source: Maybank KE
Sugar profitability is different for Year 1 and Years 2-4 due to lower land preparation and planting costs in Years 2-4.
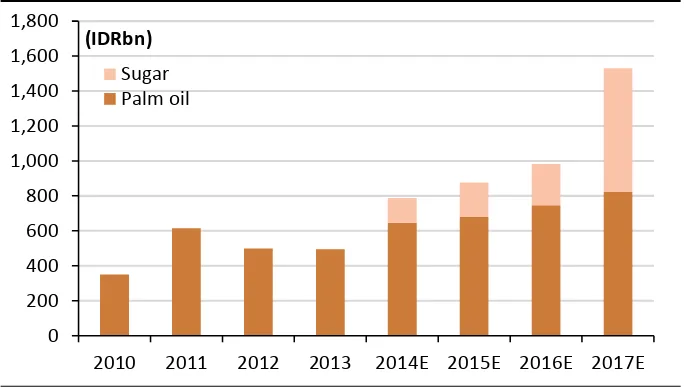
TBL’s sugar division will have two subdivisions: 1) sugar refineries with installed capacity of 216k tonnes pa; and 2) integrated sugar mills — mills plus sugarcane plantations — with installed capacity of 120k tonnes pa. Sugar only contributed less than 1% to its EBIT in 2013 and around 10% in 1H14. The company is expecting contributions of around half its EBIT in 2017E, once its sugar mill kicks in.
Figure 3: Sugar a new source of growth
Source: Maybank KE
Its sugar refinery commenced operations in 4Q13 while its new sugar mill and sugar plantations are expected to be ready in 4Q16E. TBL was given a licence to import 108k tonnes of raw sugar for its sugar refinery in Apr-Jul 2014. It is one of only nine sugar importers to receive quotas to import raw
0 200 400 600 800 1,000 1,200 1,400 1,600 1,800
2010 2011 2012 2013 2014E 2015E 2016E 2017E
(IDRbn)
October 17, 2014 3 sugar for refining. It is also the only importer allowed to sell to retail
consumers vs industrial users.
In right place, at right time
TBL’s sugar opportunity comes at a right time, as Lampung is suitable for sugarcane plantations and TBL’s palm-oil estate there is due for replanting. This can be converted into a sugarcane plantation at minimal opportunity costs.
Lampung’s generally drier weather renders it more suitable for sugarcane crops than palm oil, according to management. This is positive, given the high margins for sugar mills and plantations at the moment.
Domestic sugar prices are protected by import quotas and minimum prices, to protect small holders and state-owned sugar mills. The government aims to keep the profitability of efficient sugar refineries and mills high in order to attract new investments, as Indonesia imported half of its sugar in 2013. This protection is also expected to revitalise existing sugar mills.
Sweet prospects…
Sugar is very profitable for Indonesia’s efficient sugar mills and refineries as a result of the price controls and import restrictions. Demand continues to outstrip supply, necessitating more imports.
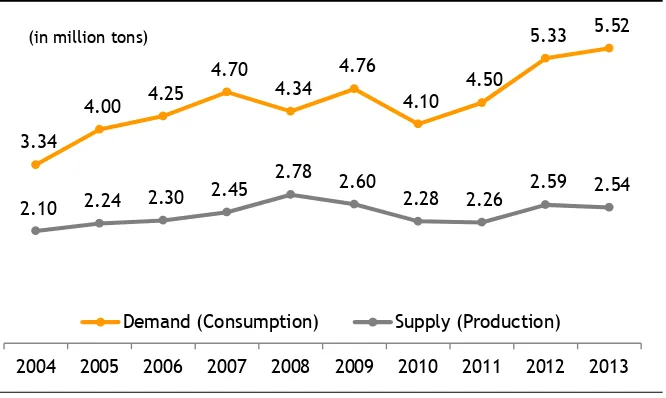
In the past decade, Indonesian sugar consumption leapt 65% from 3.34m tonnes in 2004 to 5.52m by 2013. As domestic production barely increased to 2.54m tonnes in 2013 from 2.1m in 2004, sugar imports more than doubled from 1.24m tonnes to 2.98m.
Figure 4: Indonesia’s sugar demand has been outstripping supply
Source: Statistics Indonesia, Kontan
The government periodically sets the minimum domestic sugar price, which is used as a reference price for sugar mills when millers buy sugarcane from the small farmers.
Its latest reference price is IDR8,500/kg vs an international price of around IDR5,500/kg. Theoretically, this price is arrived at using estimated production costs for the small farmers plus a profit margin.
The reference price tends to be higher than international prices because of the general inefficiency of the country’s small farmers and sugar mills. Small farmers lack scale. On top of that, many rent their land, adding to their production costs. Sugar mills in Indonesia are also inefficient and
3.34
4.00 4.25 4.70
4.34 4.76
4.10 4.50
5.33 5.52
2.10 2.24 2.30
2.45 2.78 2.60 2.28 2.26
2.59 2.54
2004 2005 2006 2007 2008 2009 2010 2011 2012 2013 Demand (Consumption) Supply (Production)
October 17, 2014 4 outdated with low extraction rates of 7-8% vs 10-12% for modern sugar
mills.
Although sugar’s high profitability is attractive for investors, barriers to entry are high. Establishing a sugar refinery is generally very risky without an import quota. This is hard to obtain and is issued case by case. Setting up an integrated sugar mill is much easier, as the government is keen to boost sugar production and create more value and jobs through mills and sugarcane plantations than pure refining. However, sugar milling requires a large land bank for developing sugarcane estates and large capital to build the mills.
TBL has it all. It has the import quota for its refinery, land for sugarcane plantations and capital to build modern sugar mills.
Regulatory environment
Government regulations divide sugar consumers into three groups: 1) exporters which can directly import refined sugar for use in their exports; 2) industrial users which can source from sugar refineries; and 3) retail consumers who can buy from domestic sugar producers and selected sugar refineries, by far only TBL.
Selling prices to industrial consumers are not regulated. This group can buy their sugar from refineries with the quota to import raw sugar. There is an import duty of IDR550 per kg of raw sugar.
In contrast, the government sets a domestic benchmark price at the beginning of each harvesting season for retail consumers. Sugar mills are required to use this to calculate their price for buying sugar cane from farmers. Theoretically, this benchmark is arrived at using an assumed production cost for the sugarcane farmers plus sugar-milling costs and a profit margin.
The benchmark price tends to be higher than international sugar prices due to the lower productivity of Indonesia’s sugar industry.
This policy is unlikely to change as sugar is part of Jokowi’s road map for achieving food sovereignty. He has been quoted by the media as suggesting that food sovereignty will only be reached if farmers are prosperous. If this plays out, the country’s high regulated benchmark price and the high profitability of modern integrated sugar mills should persist, in our view, at least until domestic production suffices or the small farmers are efficient enough to compete. This could be years away, in all probability.
The sweet toothed Indonesians
Indonesians love sugar. In many places all over the archipelago, tea means sweetened tea and coffee means sweetened coffee, although they may not necessarily come with milk. Indonesians even add sugar to their green teas! One of the best-selling ready-to-drink green teas in the country has 26g of sugar per 330ml of drink (Figures 5-6).
October 17, 2014 5
Figure 5: One of the best-selling bottled drinks in Indonesia...
Source: www.abcpresident.com
Figure 6: …is a sweetened green tea!
Source: www.abcpresident.com
Sugar refining
Sugar refining is a simple operation of melting/dissolving raw sugar, filtering out the molasses, and decolouring and recrystallising the sugar. Main costs of production are raw sugar (73%), import duties (9%), energy (6%) and depreciation (6%). Profit margins could be volatile, at the mercy of raw-sugar prices. Still, sugar refineries in Indonesia historically do not run at operating costs, given a lack of competition and the regulated environment.
Sugar refineries import raw ICUMSA 800-2000 sugar and refine it into industrial-grade ICUMSA 45-100 sugar. Based on today’s prices, the refineries should generate gross margins of 17.5% if they sell to industrial users and 27.1% to retail consumers.
The ICUMSA numbers refer to the purity levels assessed by the International Commission for Uniform Methods of Sugar Analysis. The lower the number, the higher the purity ie more refined.
Figure 4: Sugar refineries’ profits from sales to industrial and retail customers
Sugar refinery Industrial user Retail consumer
Selling price/kg 7,514 8,500
Production costs 6,201 6,201
Raw sugar 4,500 4,500
Import duty 550 550
Energy 356 356
Depreciation 356 356
Labour 108 108
Additives 32 32
Others 300 300
Profit/kg 1,314 2,300
Gross profit margin 17.5% 27.1%
Source: Maybank KE
Other than TBL, Indonesia’s import and refinery licensees are only allowed to sell their refined sugar to industrial users. Selling prices to this group are not regulated and tend to be lower, closer to international prices. This implies industrial sugar is not as profitable as retail-consumer sugar.
October 17, 2014 6 higher profitability than peers. Arguably, such profit margins should be
even more sustainable once its sugar mill and plantations are operational.
Integrated sugar mills
Sugar mills are a highly profitable investment in Indonesia due to the sugar floor price set by the government. Unlike sugar refineries, all mills are allowed to sell their products to retail customers. Licensing is also easier to obtain. Gross margins are high at around 50% for integrated sugar mills and plantations with a global average yield of seven tonnes of sugar per ha.
Production costs are generally stable as the mills normally source their sugarcane from their own plantations or buy from farmers.
A significant barrier to entry is the availability of land to plant sugar. Sugar itself is an easy crop to grow and planting and harvesting can be mechanised. This contrasts with palm oil, which is more labour-intensive.
Investing in sugar is slightly different from investing in palm oil. Sugar is capital-intensive for mills, while palm oil requires more capital for plantations. This means that to be able to protect returns on investment, sugar mills have to secure their sugarcane supplies from independent farmers or develop their own cane plantations.
TBL’s sugar mill will be supplied largely by its own plantations. As such, its production costs should consist of labour, seed & fertiliser costs for its plantations and depreciation, labour & maintenance costs for its mills.
Such integrated operations provide much better earnings visibility as both costs and selling prices are more stable than for sugar refineries, which are exposed to the cost of imported raw sugar.
Figure ___ breaks down the main costs and potential profit margins of a well-run integrated sugar mill and sugarcane plantation. Among all the associated costs, we note that only fertiliser and chemical costs are influenced by international prices and exchange rates. The remainder are relatively fixed. Labour costs are adjusted annually while depreciation costs are usually steady. Profit visibility is overall good, in our assessment.
Sugarcane plantations
Sugarcane requires a tropical climate with 600mm of minimum rainfall for maximum growth. In prime growing areas, sugarcane yields can reach 150 tonnes/ha while a good estate can yield an average 90 tonnes/ha. This implies 15 and nine tonnes of yields respectively, assuming a 10% extraction rate.
Indonesia’s yield averages 5.45 tonnes of sugar per ha, according to Statistics Indonesia. This low yield can be traced to a combination of low sugarcane yields of 72 tonnes per ha and low sugar-extraction rate of 7-8%.
Palm-oil division still very profitable
TBL owns 56,747 ha of palm-oil plantations in Lampung (Sumatra), Palembang (Sumatra), and Pontianak (Kalimantan). Group production yield of 18.8 tonnes FFB per ha in 2013 was sub-standard, largely because of its low-yielding old estates in Lampung.
October 17, 2014 7
Figure 5: Revenue breakdown
Source: Maybank KE
FFB production from its nucleus plantations could increase by 10% pa from 601,481 tonnes in 2013 to 667,614 in 2014E, 748,504 in 2015E and 768,960 in 2017E, in our estimation. This is even after the conversion of 15k ha of its old palm-oil estates into sugarcane plantations. A normal yield curve has been assumed for its estates planted with Tenera (DxP) palm-oil seeds.
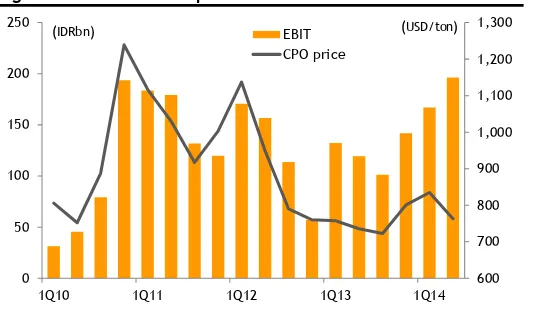
Despite its low FFB yields, TBL managed to deliver a 25.6% gross margin and 13.3% EBIT margin in 2013. Reported net profit was IDR84bn. Core earnings were IDR274bn, excluding forex losses. EBIT was up 44.5% YoY to IDR363bn in 1H14. Net profit was up 74.8% YoY to IDR213m, all on higher CPO prices and initial sugar contributions.
Figure 6: EBIT and CPO prices
Source: Maybank KE, Bloomberg
Figure 7: Net profit and CPO prices
Source: Maybank KE, Bloomberg
Net profit in some quarters distorted by forex gains / (losses)
TBL expects its palm-oil yields and profitability to improve once its Palembang and Pontianak trees reach their prime age and old palm estates in Lampung are converted into sugarcane plantations.
CPO, 34%
PKO, 17%
Palm cooking oil, 26%
Stearine, 11% Palm
expeller, 5% PFAD, 3% Others, 4%
600 700 800 900 1,000 1,100 1,200 1,300
0 50 100 150 200 250
1Q10 1Q11 1Q12 1Q13 1Q14
EBIT CPO price
(IDRbn) (USD/ton)
0 200 400 600 800 1,000 1,200 1,400
-100 -50 0 50 100 150 200
1Q10 1Q11 1Q12 1Q13 1Q14
Net Profit CPO price
October 17, 2014 8
Figure 8: Age of TBL’s oil palms
Source: Company
Also, it expects FFB yields in Pontianak and Palembang to beat those of its older plantations in Lampung because of the better quality of the seeds planted and Pontianak/Palembang’s more suitable climate. Rainfall in both locations is better distributed throughout the year.
Lampung, by nature, is more suitable for sugarcane as sugarcane only needs good rainfall during its early growth and less towards its harvesting.
Figure 9: Annual rainfall (mm pa)
Palembang Lampung Pontianak
2008 2,686 1,940 3,132
2009 2,389 1,789 2,989
2010 3,080 2,710 3,518
2011 2,593 1,568 3,129
2012 3,083 1,685 3,081
Source: Statistics Indonesia
TBL is converting about 40% of its post-prime palm-oil estates in Lampung into sugarcane plantations by end-2016. This will involve about 15k ha of its 39k ha land. At the same time, it is constructing an 8,000 TCD (tonnes of cane per day) sugar mill, to mill 120k tonnes of sugar pa.
Risks to its plantations will mainly come from volatile CPO and sugar prices and regulatory risks from import quotas and taxes. Bad weather could also hurt harvests, although the impact is likely to be assuaged by higher selling prices from supply disruptions.
Palm oil is a simple business, in which TBL processes fresh fruit bunches (FFB) from its own estates and whatever is purchased from plasma farmers and third parties.
Processing FFB from its own estates yields higher gross margins of 65%, based on a CPO price of USD650/tonne and production cost of USD360/tonne. Production costs for its own estates are stable, usually consisting of depreciation, labour and fertiliser costs.
In contrast, processing FFB bought from external parties yields fixed low gross margins of 10-15%. This is because the price of FFB purchased from external parties is determined by a formula linked to CPO prices. Still, for
0 5000 10000 15000 20000 25000
0-3 4-8 9-14 15-19 >20
(ha)
Age of palm tree (years)
October 17, 2014 9 many plantation companies, processing FFB from external parties allows
them to lock in profitability, increase capacity utilisation during poor harvests and also fulfil social responsibility.
In view of the above, simply comparing the consolidated reported gross margins of listed plantation companies does not provide a clear picture of their true cost-competitiveness.
The loss of TBL’s production from the 15k ha of its estates converted into sugarcane plantations should be compensated by newly matured trees from its Palembang and Pontianak estates, according to the company. These two estates should have higher productivity and lower production costs going forward.
Figure 10: Normal yield curve of palm oil
Source: Maybank KE
Financial upside potential
Earnings upside in the next three years could emanate from its venture into sugar, in our view. We believe EBIT has the potential to double while core net profit has room to triple in 2017 from 2014E levels, from sugar contributions.
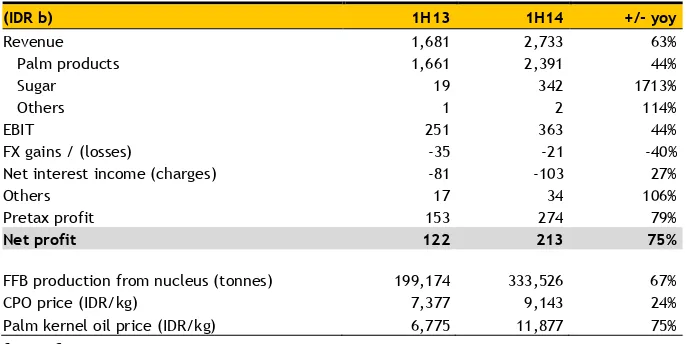
1H14 revenue was already up 63% YoY to IDR2.7t. EBIT was up 44% YoY to IDR363bn. Net profit grew 75% to IDR213bn. The strength was largely due to higher average palm product prices, a surge in FFB output from nucleus estates and new sugar-refinery contributions.
Figure 11: 1H14 results
(IDR b) 1H13 1H14 +/- yoy
Revenue 1,681 2,733 63%
Palm products 1,661 2,391 44%
Sugar 19 342 1713%
Others 1 2 114%
EBIT 251 363 44%
FX gains / (losses) -35 -21 -40%
Net interest income (charges) -81 -103 27%
Others 17 34 106%
Pretax profit 153 274 79%
Net profit 122 213 75%
FFB production from nucleus (tonnes) 199,174 333,526 67%
CPO price (IDR/kg) 7,377 9,143 24%
Palm kernel oil price (IDR/kg) 6,775 11,877 75%
Source: Company 0
5 10 15 20 25 30
1 3 5 7 9 11 13 15 17 19 21 23 25
October 17, 2014 10 Balance sheet
Net gearing was 132% as at end-Jun 2014. Of its IDR3,047b debt, about 71% was in USD loans. Although such loans are naturally hedged by its revenue largely linked to international CPO prices in USD, a volatile rupiah could swing its earnings with translation gains/losses.
Debt servicing remained healthy at less than 3.8x EBITDA, annualised. This might fall further once sugar contributions increase. That said, balance sheet remains at risk from CPO price oscillations, which could significantly alter its EBITDA.
We estimate operating cash flow of IDR300b for 2014E after interest payment. The company has budgeted IDR1t pa for capex, mainly for building sugar mills which will cost IDR1.3t over two years, developing 15,000 ha of sugarcane plantations at IDR345bn over two years and palm-oil planting. The last should cost IDR216bn pa, according to the company.
Cash flows could be very tight, based on our calculations. The company may need external funding of at least IDR1.5t for its capex till end-2016E, in our estimation. It has room to gear up as we believe its equity could climb from IDR2.0t in Jun 2014 to IDR3.1t by Dec 2016E, assuming a net-profit run rate of IDR213bn, as in 1H14.
If the above scenario pans out, net gearing should remain more or less at 135% by Dec 2016E vs 132% in Jun 2014.
TBL’s debt covenants currently limit its net gearing to 200% and dividend payout ratio to 50% of its net profits.
Figure 12: Balance sheet (IDR b)
Assets IDR b Liabilities IDR b
Cash and cash equivalents 402 Short-term debts 1,483
Accounts receivable 450 Accounts payable 203
Inventory 16 Advances received 341
Other current assets 1,495 Other current liabilities 113
Plantation assets 1,264 Long-term debts 1,565
Fixed assets 2,592 Advances received 452
Other non-current assets 159 Other non-current liabilities 210
Total liabilities 4,367
Minority interests 16
Shareholders’ equity 1,995
Total assets 6,377 Total liabilities and equity 6,377
October 17, 2014 11
Research Offices
REGIONAL
WONG Chew Hann, CA
Regional Head of Institutional Research (603) 2297 8686 [email protected]
ONG Seng Yeow
Regional Head of Retail Research (65) 6432 1453
(662) 658 1420 [email protected]
JUNIMAN
Chief Economist, BII Indonesia
(62) 21 29228888 ext 29682 [email protected]
Josua PARDEDE
Economist / Industry Analyst, BII Indonesia
(62) 21 29228888 ext 29695 [email protected]
MALAYSIA
WONG Chew Hann, CA Head of Research
(603) 2297 8686 [email protected] • Strategy • Construction & Infrastructure
Desmond CH’NG, ACA
(603) 2297 8680
[email protected] • Banking & Finance
LIAW Thong Jung
(603) 2297 8688 [email protected] • Oil & Gas - Regional • Shipping
ONG Chee Ting, CA
(603) 2297 8678 [email protected] • Plantations - Regional
Mohshin AZIZ
(603) 2297 8692 [email protected] • Aviation - Regional • Petrochem
YIN Shao Yang, CPA
(603) 2297 8916 [email protected] • Gaming – Regional • Media
TAN Chi Wei, CFA
(603) 2297 8690 [email protected] • Power • Telcos
WONG Wei Sum, CFA
(603) 2297 8679 [email protected] • Property & REITs
LEE Yen Ling
(603) 2297 8691 [email protected] • Building Materials • Glove Producers
CHAI Li Shin
(603) 2297 8684 [email protected] • Plantation • Construction & Infrastructure
Ivan YAP
(603) 2297 8612 [email protected] • Automotive
LEE Cheng Hooi Regional Chartist
(603) 2297 8694
Tee Sze Chiah Head of Retail Research
(603) 2297 6858 [email protected]
HONG KONG / CHINA
Howard WONG Head of Research
(852) 2268 0648
(852) 2268 0633 [email protected] • Consumer Staples & Durables
Ka Leong LO, CFA
(852) 2268 0630 [email protected] * Consumer Discretionary & Auto
Karen KWAN
(852) 2268 0640 [email protected] • Property & REITs
Osbert TANG, CFA
(86) 21 5096 8370 [email protected] • Transport & Industrials
Ricky WK NG, CFA
(852) 2268 0689 [email protected] • Utilities & Renewable Energy
Steven ST CHAN
(852) 2268 0645 [email protected] • Banking & Financials - Regional
Warren LAU
Jigar SHAH Head of Research
(91) 22 6632 2632 [email protected] • Oil & Gas • Automobile • Cement
Anubhav GUPTA
(91) 22 6623 2605 [email protected]
• Metal & Mining • Capital Goods • Property
Urmil SHAH
(91) 22 6623 2606 [email protected] • Technology • Media
Vishal MODI
(91) 22 6623 2607 [email protected] • Banking & Financials
SINGAPORE
NG Wee SiangHead of Research
(65) 6231 5838 [email protected] • Banking & Finance
Gregory YAP
(65) 6231 5848 [email protected] • SMID Caps – Regional
• Technology & Manufacturing • Telcos
YEAK Chee Keong, CFA
(65) 6231 5842
[email protected] • Offshore & Marine
Derrick HENG
(65) 6231 5843 [email protected] • Transport (Land, Shipping & Aviation)
WEI Bin
(65) 6231 5844 [email protected] • Commodity • Logistics • S-chips
John CHEONG
(65) 6231 5845 [email protected] • Small & Mid Caps • Healthcare
TRUONG Thanh Hang
(65) 6231 5847 [email protected] • Small & Mid Caps
INDONESIA
Wilianto IE Head of Research
(62) 21 2557 1125 • Banking & Finance
Aurellia SETIABUDI • Infrastructure • Construction • Transport
Janni ASMAN
(62) 21 2953 0784 [email protected] • Cigarette • Healthcare • Retail
PHILIPPINES
Luz LORENZOHead of Research
(63) 2 849 8836
[email protected] • Strategy
• Utilities • Conglomerates • Telcos
Lovell SARREAL
(63) 2 849 8841
[email protected] • Consumer • Media • Cement
Rommel RODRIGO
(63) 2 849 8839
[email protected] • Conglomerates • Property • Gaming • Ports/ Logistics
Maria LAPIZ Head of Institutional Research
Dir (66) 2257 0250 | (66) 2658 6300 ext 1399 [email protected]
• Consumer / Materials
Jesada TECHAHUSDIN, CFA
(66) 2658 6300 ext 1394 [email protected] • Financial Services
Kittisorn PRUITIPAT, CFA, FRM
(66) 2658 6300 ext 1395
Sukit UDOMSIRIKULHead of Retail Research
(66) 2658 6300 ext 5090 • Auto • Conmat • Contractor • Steel
Suttatip PEERASUB • Transportation • Small cap
Chatchai JINDARAT
Head of Institutional Research (84) 8 44 555 888 x 8181 [email protected] • Strategy • Consumer • Diversified • Utilities
THAI Quang Trung, CFA, Deputy Manager,
Institutional Research
(84) 8 44 555 888 x 8180 [email protected] • Real Estate • Construction • Materials
Le Nguyen Nhat Chuyen
(84) 8 44 555 888 x 8082 [email protected] • Oil & Gas
NGUYEN Thi Ngan Tuyen,Head of Retail Research
(84) 8 44 555 888 x 8081
[email protected] • Food & Beverage • Oil&Gas • Banking
TRINH Thi Ngoc Diep
(84) 4 44 555 888 x 8208 [email protected] • Technology • Utilities • Construction
TRUONG Quang Binh
(84) 4 44 555 888 x 8087 [email protected] • Rubber plantation • Tyres and Tubes • Oil&Gas
PHAM Nhat Bich
(84) 8 44 555 888 x 8083 [email protected] • Consumer • Manufacturing • Fishery
NGUYEN Thi Sony Tra Mi
October 17, 2014 12
APPENDIX I: TERMS FOR PROVISION OF REPORT, DISCLAIMERS AND DISCLOSURES
DISCLAIMERS
This research report is prepared for general circulation and for information purposes only and under no circumstances should it be considered or intended as an offer to sell or a solicitation of an offer to buy the securities referred to herein. Investors should note that values of such securities, if any, may fluctuate and that each security’s price or value may rise or fall. Opinions or recommendations contained herein are in form of technical ratings and fundamental ratings. Technical ratings may differ from fundamental ratings as technical valuations apply different methodologies and are purely based on price and volume-related information extracted from the relevant jurisdiction’s stock exchange in the equity analysis. Accordingly, investors’ returns may be less than the original sum invested. Past performance is not necessarily a guide to future performance. This report is not intended to provide personal investment advice and does not take into account the specific investment objectives, the financial situation and the particular needs of persons who may receive or read this report. Investors should therefore seek financial, legal and other advice regarding the appropriateness of investing in any securities or the investment strategies discussed or recommended in this report.
The information contained herein has been obtained from sources believed to be reliable but such sources have not been independently verified by Maybank Investment Bank Berhad, its subsidiary and affiliates (collectively, “MKE”) and consequently no representation is made as to the accuracy or completeness of this report by MKE and it should not be relied upon as such. Accordingly, MKE and its officers, directors, associates, connected parties and/or employees (collectively, “Representatives”) shall not be liable for any direct, indirect or consequential losses or damages that may arise from the use or reliance of this report. Any information, opinions or recommendations contained herein are subject to change at any time, without prior notice.
This report may contain forward looking statements which are often but not always identified by the use of words such as “anticipate”, “believe”, “estimate”, “intend”, “plan”, “expect”, “forecast”, “predict” and “project” and statements that an event or result “may”, “will”, “can”, “should”, “could” or “might” occur or be achieved and other similar expressions. Such forward looking statements are based on assumptions made and information currently available to us and are subject to certain risks and uncertainties that could cause the actual results to differ materially from those expressed in any forward looking statements. Readers are cautioned not to place undue relevance on these forward-looking statements. MKE expressly disclaims any obligation to update or revise any such forward looking statements to reflect new information, events or circumstances after the date of this publication or to reflect the occurrence of unanticipated events.
MKE and its officers, directors and employees, including persons involved in the preparation or issuance of this report, may, to the extent permitted by law, from time to time participate or invest in financing transactions with the issuer(s) of the securities mentioned in this report, perform services for or solicit business from such issuers, and/or have a position or holding, or other material interest, or effect transactions, in such securities or options thereon, or other investments related thereto. In addition, it may make markets in the securities mentioned in the material presented in this report. MKE may, to the extent permitted by law, act upon or use the information presented herein, or the research or analysis on which they are based, before the material is published. One or more directors, officers and/or employees of MKE may be a director of the issuers of the securities mentioned in this report.
This report is prepared for the use of MKE’s clients and may not be reproduced, altered in any way, transmitted to, copied or distributed to any other party in whole or in part in any form or manner without the prior express written consent of MKE and MKE and its Representatives accepts no liability whatsoever for the actions of third parties in this respect.
This report is not directed to or intended for distribution to or use by any person or entity who is a citizen or resident of or located in any locality, state, country or other jurisdiction where such distribution, publication, availability or use would be contrary to law or regulation. This report is for distribution only under such circumstances as may be permitted by applicable law. The securities described herein may not be eligible for sale in all jurisdictions or to certain categories of investors. Without prejudice to the foregoing, the reader is to note that additional disclaimers, warnings or qualifications may apply based on geographical location of the person or entity receiving this report.
Malaysia
Opinions or recommendations contained herein are in the form of technical ratings and fundamental ratings. Technical ratings may differ from fundamental ratings as technical valuations apply different methodologies and are purely based on price and volume-related information extracted from Bursa Malaysia Securities Berhad in the equity analysis.
Singapore
This report has been produced as of the date hereof and the information herein may be subject to change. Maybank Kim Eng Research Pte. Ltd. (“Maybank KERPL”) in Singapore has no obligation to update such information for any recipient. For distribution in Singapore, recipients of this report are to contact Maybank KERPL in Singapore in respect of any matters arising from, or in connection with, this report. If the recipient of this report is not an accredited investor, expert investor or institutional investor (as defined under Section 4A of the Singapore Securities and Futures Act), Maybank KERPL shall be legally liable for the contents of this report, with such liability being limited to the extent (if any) as permitted by law.
Thailand
The disclosure of the survey result of the Thai Institute of Directors Association (“IOD”) regarding corporate governance is made pursuant to the policy of the Office of the Securities and Exchange Commission. The survey of the IOD is based on the information of a company listed on the Stock Exchange of Thailand and the market for Alternative Investment disclosed to the public and able to be accessed by a general public investor. The result, therefore, is from the perspective of a third party. It is not an evaluation of operation and is not based on inside information. The survey result is as of the date appearing in the Corporate Governance Report of Thai Listed Companies. As a result, the survey may be changed after that date. Maybank Kim Eng Securities (Thailand) Public Company Limited (“MBKET”) does not confirm nor certify the accuracy of such survey result.
Except as specifically permitted, no part of this presentation may be reproduced or distributed in any manner without the prior written permission of MBKET. MBKET accepts no liability whatsoever for the actions of third parties in this respect.
US
This research report prepared by MKE is distributed in the United States (“US”) to Major US Institutional Investors (as defined in Rule 15a-6 under the Securities Exchange Act of 1934, as amended) only by Maybank Kim Eng Securities USA Inc (“Maybank KESUSA”), a broker-dealer registered in the US (registered under Section 15 of the Securities Exchange Act of 1934, as amended). All responsibility for the distribution of this report by Maybank KESUSA in the US shall be borne by Maybank KESUSA. All resulting transactions by a US person or entity should be effected through a registered broker-dealer in the US. This report is not directed at you if MKE is prohibited or restricted by any legislation or regulation in any jurisdiction from making it available to you. You should satisfy yourself before reading it that Maybank KESUSA is permitted to provide research material concerning investments to you under relevant legislation and regulations.
UK
October 17, 2014 13
Disclosure of Interest
Malaysia: MKE and its Representatives may from time to time have positions or be materially interested in the securities referred to herein and may further act as market maker or may have assumed an underwriting commitment or deal with such securities and may also perform or seek to perform investment banking services, advisory and other services for or relating to those companies.
Singapore: As of 17 October 2014, Maybank KERPL and the covering analyst do not have any interest in any companies recommended in this research report.
Thailand: MBKET may have a business relationship with or may possibly be an issuer of derivative warrants on the securities /companies mentioned in the research report. Therefore, Investors should exercise their own judgment before making any investment decisions. MBKET, its associates, directors, connected parties and/or employees may from time to time have interests and/or underwriting commitments in the securities mentioned in this report.
Hong Kong: KESHK may have financial interests in relation to an issuer or a new listing applicant referred to as defined by the requirements under Paragraph 16.5(a) of the Hong Kong Code of Conduct for Persons Licensed by or Registered with the Securities and Futures Commission.
As of 17 October 2014, KESHK and the authoring analyst do not have any interest in any companies recommended in this research report.
MKE may have, within the last three years, served as manager or co-manager of a public offering of securities for, or currently may make a primary market in issues of, any or all of the entities mentioned in this report or may be providing, or have provided within the previous 12 months, significant advice or investment services in relation to the investment concerned or a related investment and may receive compensation for the services provided from the companies covered in this report.
OTHERS
Analyst Certification of Independence
The views expressed in this research report accurately reflect the analyst’s personal views about any and all of the subject securities or issuers; and no part of the research analyst’s compensation was, is or will be, directly or indirectly, related to the specific recommendations or views expressed in the report.
Reminder
Structured securities are complex instruments, typically involve a high degree of risk and are intended for sale only to sophisticated investors who are capable of understanding and assuming the risks involved. The market value of any structured security may be affected by changes in economic, financial and political factors (including, but not limited to, spot and forward interest and exchange rates), time to maturity, market conditions and volatility and the credit quality of any issuer or reference issuer. Any investor interested in purchasing a structured product should conduct its own analysis of the product and consult with its own professional advisers as to the risks involved in making such a purchase.
No part of this material may be copied, photocopied or duplicated in any form by any means or redistributed without the prior consent of MKE.
Definition of Ratings
Maybank Kim Eng Research uses the following rating system
BUY Return is expected to be above 10% in the next 12 months (excluding dividends)
HOLD Return is expected to be between - 10% to +10% in the next 12 months (excluding dividends)
SELL Return is expected to be below -10% in the next 12 months (excluding dividends)
Applicability of Ratings
The respective analyst maintains a coverage universe of stocks, the list of which may be adjusted according to needs. Investment ratings are only applicable to the stocks which form part of the coverage universe. Reports on companies which are not part of the coverage do not carry investment ratings as we do not actively follow developments in these companies.
DISCLOSURES
Legal Entities Disclosures
Malaysia: This report is issued and distributed in Malaysia by Maybank Investment Bank Berhad (15938-H) which is a Participating Organization of Bursa
Malaysia Berhad and a holder of Capital Markets and Services License issued by the Securities Commission in Malaysia. Singapore: This material is issued and
distributed in Singapore by Maybank KERPL (Co. Reg No 197201256N) which is regulated by the Monetary Authority of Singapore. Indonesia: PT Kim Eng
Securities (“PTKES”) (Reg. No. KEP-251/PM/1992) is a member of the Indonesia Stock Exchange and is regulated by the BAPEPAM LK. Thailand: MBKET (Reg.
No.0107545000314) is a member of the Stock Exchange of Thailand and is regulated by the Ministry of Finance and the Securities and Exchange Commission.
Philippines: Maybank ATRKES (Reg. No.01-2004-00019) is a member of the Philippines Stock Exchange and is regulated by the Securities and Exchange
Commission. Vietnam: Maybank Kim Eng Securities JSC (License Number: 71/UBCK-GP) is licensed under the State Securities Commission of Vietnam.Hong
Kong: KESHK (Central Entity No AAD284) is regulated by the Securities and Futures Commission. India: Kim Eng Securities India Private Limited (“KESI”) is a
participant of the National Stock Exchange of India Limited (Reg No: INF/INB 231452435) and the Bombay Stock Exchange (Reg. No. INF/INB 011452431) and is
regulated by Securities and Exchange Board of India. KESI is also registered with SEBI as Category 1 Merchant Banker (Reg. No. INM 000011708) US: Maybank
KESUSA is a member of/ and is authorized and regulated by the FINRA – Broker ID 27861. UK: Maybank KESL (Reg No 2377538) is authorized and regulated by
October 17, 2014 14 Malaysia
Maybank Investment Bank Berhad
(A Participating Organisation of Bursa Malaysia Securities Berhad) 33rd Floor, Menara Maybank, 100 Jalan Tun Perak, 50050 Kuala Lumpur Tel: (603) 2059 1888; Fax: (603) 2078 4194
Singapore
Maybank Kim Eng Securities Pte Ltd Maybank Kim Eng Research Pte Ltd
50 North Canal Road Singapore 059304
Tel: (65) 6336 9090
London
Maybank Kim Eng Securities (London) Ltd
5th Floor, Aldermary House 10-15 Queen Street London EC4N 1TX, UK
Tel: (44) 20 7332 0221 Fax: (44) 20 7332 0302
New York
Maybank Kim Eng Securities USA Inc
777 Third Avenue, 21st Floor New York, NY 10017, U.S.A.
Tel: (212) 688 8886 Fax: (212) 688 3500
Stockbroking Business:
Level 8, Tower C, Dataran Maybank, No.1, Jalan Maarof
59000 Kuala Lumpur Tel: (603) 2297 8888 Fax: (603) 2282 5136
Hong Kong
Kim Eng Securities (HK) Ltd
Level 30, Three Pacific Place, 1 Queen’s Road East, Hong Kong
Tel: (852) 2268 0800 Fax: (852) 2877 0104
Indonesia
PT Maybank Kim Eng Securities
Plaza Bapindo Citibank Tower 17th Floor Jl Jend. Sudirman Kav. 54-55 Jakarta 12190, Indonesia
Tel: (62) 21 2557 1188 Fax: (62) 21 2557 1189
India
Kim Eng Securities India Pvt Ltd
2nd Floor, The International 16, Maharishi Karve Road, Churchgate Station, Mumbai City - 400 020, India
Tel: (91) 22 6623 2600 Fax: (91) 22 6623 2604
Philippines
Maybank ATR Kim Eng Securities Inc.
17/F, Tower One & Exchange Plaza Ayala Triangle, Ayala Avenue Makati City, Philippines 1200
Tel: (63) 2 849 8888 Fax: (63) 2 848 5738
Thailand
Maybank Kim Eng Securities (Thailand) Public Company Limited
999/9 The Offices at Central World, 20th - 21st Floor,
Rama 1 Road Pathumwan, Bangkok 10330, Thailand
Tel: (66) 2 658 6817 (sales) Tel: (66) 2 658 6801 (research)
Vietnam
Maybank Kim Eng Securities Limited
4A-15+16 Floor Vincom Center Dong Khoi, 72 Le Thanh Ton St. District 1 Ho Chi Minh City, Vietnam
Tel : (84) 844 555 888 Fax : (84) 8 38 271 030
Saudi Arabia
In association with
Anfaal Capital
Villa 47, Tujjar Jeddah Prince Mohammed bin Abdulaziz Street P.O. Box 126575 Jeddah 21352
Tel: (966) 2 6068686 Fax: (966) 26068787
South Asia Sales Trading
Kevin Foy
Regional Head Sales Trading [email protected] Tel: (65) 6336-5157 US Toll Free: 1-866-406-7447
North Asia Sales Trading
Alex Tsun
[email protected] Tel: (852) 2268 0228 US Toll Free: 1 877 837 7635
Tel: (84) 44 555 888 x8079
Philippines
Keith Roy
[email protected] Tel:(63) 2 848-5288
www.maybank-ke.com | www.maybank-keresearch.com