Pl
THIS REPORT HAS BEEN PREPARED BY PTMAYBANKKIMENGSECURITIES
SEE PAGE 38 FOR IMPORTANT DISCLOSURES AND ANALYST CERTIFICATIONS Anthony Lukmawijaya
Sweetened margins with sugar; Initiate at BUY
Initiate TBLA at BUY with TP of IDR1,500 (+69% upside), as we believe earnings will grow at 127% CAGR (2015-17), driven by its new lucrative and highly regulated sugar business. Longer-term growth will be driven by further expansion by both the sugar and palm oil divisions. Our SOTP TP (EV/ha valuation of USD9,000 for its palm oil, DCF valuation for its sugar mill and P/E of 8x for its refined sugar business) implies 2017 P/E of 8.9x and P/BV of 2x. At 5.3x 2017 P/E, 1.2x P/BV, the stock has yet to reflect its earnings potential and declining execution risk.
Be
nefitting from the industry’s strict regulations
The sugar industry has experienced abnormal returns (IRR of 60% for sugar cane producers and 26% for millers) through the enactment of raw sugar import quotas and price floors. These were put in place by the government to address the persistent undersupply of sugar due to structural issues while at the same time protect inefficient (high production cost) small sugar farmers (56% of sugar cane planters). Costly and scarce land bank availability, however, serves as an entry barrier for new players. Nonetheless, TBLA is one of the very few companies that can grab this opportunity because it can convert its maturing oil palm plantations into sugar cane as the location happens to be suitable for it.Rising palm oil output
We expect a strong output recovery in 2H16 — especially toward 4Q16 — that should make up 60% of the year’s output. Additionally, TBLA’s 6,740ha (c.17% of nucleus planted area) of newly maturing palm oil estates should raise production in coming years and support earnings at its palm oil division. We forecast fresh fruit bunch (FFB) production at its own estates (nucleus) will grow at 13.4% CAGR in 2016-2018F.
Strong earnings growth; Undemanding valuations
We expect the company’s earnings to grow 245% in 2016 and 32% in 2017 as 1) the company expands into the highly profitable sugar industry and 2) CPO output should recover in 2H16 onwards.Share Price IDR 890
12m Price Target IDR 1,500 (+69%)
BUY
PT Tunas Baru Lampung is an upstream and downstream palm oil player expanding into the sugar business
PT Budi Delta Swakarya PT Sungai Budi
Sep-14 Dec-14 Mar-15 Jun-15 Sep-15 Dec-15 Mar-16 Jun-16 Tunas Baru Lampung - (LHS, IDR)
Tunas Baru Lampung / Jakarta Composite Index - (RHS, %)
-1M -3M -12M
Absolute (%) 18 58 92
Relative to index (%) 18 41 49
Source: FactSet
FYE Dec (IDR b) FY14A FY15A FY16E FY17E FY18E
Revenue 6,338 5,331 6,635 7,582 8,066
EBITDA 1,065 843 1,436 1,775 1,836
Core net profit 433 197 680 896 947
Core EPS (IDR) 81 37 127 168 177
Core EPS growth (%) 375.9 (54.5) 245.2 31.7 5.7
Net DPS (IDR) 25 11 51 67 71
Net gearing (%) (incl perps) 103.7 142.5 125.1 100.9 83.2
Consensus net profit - - 500 891 947
September 28, 2016 2
Fully integrated oil palm company with 40,084ha of nucleus planted area across Sumatra and Kalimantan. Transformed into a sugar player starting 2012. Converting
old, low-yielding oil palm trees into sugar cane due to suitable location in Lampung. Targets 15,000ha by 2017. Obtained raw sugar import quota of 264,000 tons this
year (zero in 2015 and 108,000 tons in 2014).
Will become fully integrated sugar player through the completion of its 8,000 tcd (tons of cane per day) mill by the end of 4Q16.
Sugar should lift ROE from 7.4% in 2015 to 21.5%/23.6% in FY16/17F respectively.
TBLA revenue composition & EBITDA margin
Source: Maybank KE
Historical share price trend
Source: Company, Maybank Kim Eng
1. Crude oil price corrected from its all-time high in 1H11, which resulted in negative sentiment on share price. 2. In 2014, TBLA was awarded raw sugar import quota of newly elected government reviewed the import quota. CPO price tumbles again following crude oil crash. 5. Government awarded TBLA with raw sugar import quota
of 264,000 tons, the most ever.
Financial Metrics
Overall EBITDA margin to increase from 16% in 2015 to 23% in 2017 driven by TBLA’s high-margin sugar division. For every IDR1,000/kg ASP increase in CPO price, net
profit would increase 16%/14% for FY16/17F respectively. Significant growth in net profit will lead to higher FCF, ROIC should improve to 12% in 2017 from 3% in 2015.
Net profit vs ROIC and dividend yield
Source: Maybank KE
Swing Factors
Upside
Better-than-expected FFB yields.
Better-than-expected CPO prices going forward. Increase in government’s sugar price floor.
Better-than-expected sugar cane yields and extraction rate.
Downside
Worse-than-expected CPO prices going forward. Delay in sugar mill completion.
Elimination of government protection towards the domestic sugar industry that is dominated by small
2011 2012 2013 2014 2015 2016F 2017F 2018F
Palm products (%) Sugar products (%)
EBITDA margin (%)
Aug-11 Aug-12 Aug-13 Aug-14 Aug-15 Aug-16
Tunas Baru Lampung - (LHS, IDR)
Tunas Baru Lampung / MSCI AC Asia ex JP - (RHS, %)
2012A 2013A 2014A 2015A 2016F 2017F 2018F
Net profit (IDRb, LHS) ROIC (%, RHS)
September 28, 2016 3
Table of Contents
1. Investment Thesis ... 4
2. Focus Charts ... 6
3. Company Profile ... 7
4. Sweet Sugar: Industry Dynamics ... 9
4.1 Opportunities for the new kid on the block ... 9
4.2 Sugar industry overview ... 9
4.3 Demand outstrips supply ... 10
4.4 Structural deficiency of Indonesia’s sugar production ... 11
4.5 Raw sugar import quota to make up for shortfall ... 11
4.6 Price floor to protect local farmers ... 12
4.7 Profitability of refineries and millers ... 13
4.8 Opportunity for TBLA ... 13
4.9 Competitive landscape ... 13
4.10 Long road to self-sufficient sugar production ... 15
5. Economics of Sugar Involvement ... 16
5.1 Expansion into sugar ... 16
5.2 Natural crossover ... 16
5.3 The land barrier ... 17
5.4 Economics of switching from oil palm into sugar cane ... 17
5.5 Revenue and cost dynamics of milling facility ... 18
5.6 Refined sugar business, a huge boost to bottom line ... 18
6. Palm Oil Business and Outlook ... 20
6.1 Price flattish in ST; LT demand-supply outlook stable ... 20
6.2 Downstream as a hedge ... 21
6.3 Upstream sustainability ... 22
7. Financial Analysis ... 24
7.1 Earnings analysis ... 24
7.2 Sensitivity analysis ... 25
7.3 Sweetened margins ... 25
7.4 Balance sheet: Deleveraging opportunity ... 26
7.5 Cash flow analysis ... 27
7.6 Dividend policy ... 27
8. Valuation ... 28
9. Risks ... 31
9.1 Regulatory risks ... 31
9.2 Resistance from NGOs ... 31
9.3 Weather impact ... 31
9.4 Global economy ... 31
September 28, 2016 4
1.
Investment Thesis
TBLA is transforming from a predominantly palm oil company into a half sugar, half palm oil company. Its entrance into the lucrative sugar industry in Indonesia (highly protected by the government) will more than triple TBLA’s earnings in 2016 and continue to support its strong growth in 2017 as the new sugar mill commences operation. On the back of this exposure, we expect TBLA to be re-rated on substantial earnings growth.
Sugar industry: Protected and highly profitable
Indonesia’s sugar industry is unique compared to other countries. Structural issues such as inefficient small farmers and outdated sugar mills (some have been around for over 100 years) have resulted in a persistent undersupply of production for more than 10 years.
To overcome this undersupply while at the same time protect uncompetitive small farmers (with high production costs), the government imposed a raw sugar import quota system and also set a price floor for sugar. This price floor, which historically has been significantly higher than the international sugar price, creates handsome returns for sugar refiners (industrial, c.30% EBIT margin) and millers (retail, c.57% EBIT margin).
In the right place, at the right time
Not everyone can enter into this lucrative business. Our channel checks suggest total sugar refinery capacity has reached 4m tons per annum, enough to plug Indonesia’s undersupply of c.3m tons per annum. This would imply that it would be hard, if not impossible, for new players to request permits to build a new sugar refinery, thus leaving TBLA as the last company to build a sugar refinery in the country.
Building a sugar mill, on the other hand, also has its structural challenges such as the costly and scarce land bank availability in locations suitable for harvesting sugar cane. Based on our calculations, the sugar milling business could generate a project IRR of c.26% (premised on the assumption that the mill can secure adequate feedstock) excluding land acquisition cost. Taking into account the price of acquiring 15,000ha of land bank (required to maximize sugar mill utilization rate) however, IRR would drop to 8.9%, making it not economically feasible for new players to enter the business.
TBLA, on the other hand, has the luxury of converting its maturing palm oil plantation in Lampung, an area which is suitable for sugar cane plantations, thus does not require huge capital outlay to purchase land.
Sustainable import quota
Once its sugar mill is completed in 4Q16, TBLA will become one of the few sugar players that is fully integrated (having its own sugar cane plantation). This will please the government as it directly contributes to the aim of self-sustainability for the local sugar industry and considering the domestic supply deficit, we expect the government will continue to grant sugar import quotas to TBLA thus sustain the lucrative refinery business.
September 28, 2016 5 local sugar industry. Our forecast of a 200,000-ton quota/annum still
factors in government execution risks.
Downstream products to offset CPO price volatility risks
Even though we expect CPO prices to be flattish, risks still exist considering uncertainties in important factors like weather and prices of other substitutes. Given this backdrop, we see TBLA’s palm oil downstream operation as a hedge against downside risks to CPO prices. Earnings will be less affected by CPO price volatility as the downstream division will absorb CPO as raw materials. Downstream products comprising cooking oil, palm kernel oil (PKO), and stearine made up c.61% of TBLA’s 2015 revenue.
Attractive valuations; re-rating potential
On the back of becoming a fully integrated sugar player, we forecast earnings growth of 245% in 2016F and 32% in 2017F. Currently, TBLA trades at an undemanding 5.3x 2017F P/E and 1.2x P/BV, still lower than its LT means of 10.7x and 1.5x, respectively, due to the current challenge in the oil palm sector.
Share price has recovered from its lowest point in 2015 upon the announcement of the sugar import quota, but we believe the market has yet to price in the potential of its sugar milling business.
September 28, 2016 6
2.
Focus Charts
Figure 1: Net profit to jump significantly due to import sugar in 2016 and commencement of sugar mill in 2017
Source: Company, Maybank
Figure 2: TBLA’s sugar division to contribute 33%/38% in FY16-17F respectively
Source: Company, Maybank
Figure 3: Overall gross & operating margins to increase as refined sugar and white retail sugar generate high margins
Source: Company, Maybank
Figure 4: Company plans to deleverage going forward after completion of its sugar mill in 2017
Source: Company, Maybank
Figure 5: Sugar price floor aimed to protect small farmers provides significant returns to sugar players in the country
Source: Bloomberg, Company, Maybank
Figure 6: Refinery generates higher project IRR as it requires significantly less capital outlay as opposed to sugar mill
Oil Palm White Sugar Sugar Refinery Assumptions:
Size of plantation 15,000ha 15,000ha NA
End product CPO White sugar Refined sugar
Life of mill 20 years 20 years 20 years
Replanting cost USD6,000/ha USD1,333/ha NA
Capital outlay of mill USD12m USD100m USD50m
Cost of land USD111m* USD111m* NA
20 Years ASP (IDR/kg) IDR7,500 IDR10,000 IDR9,875
IRR (excl. Cost of land) 5.08%* 26%* 55%
IRR (incl. Cost of land) -2.06%* 8.9%* 55%
Source: Company, Maybank; * based on brownfield land prices due to land scarcity
242 84
2012 2013 2014 2015 2016F 2017F 2018F
Net profit (IDR Bn) Net profit margin (%)
3,806 3,631
2012 2013 2014 2015 2016F 2017F 2018F
Oil Palm division (IDR Bn) Sugar division (IDR Bn)
Total Revenue YoY growth (%)
2011 2012 2013 2014 2015 2016F 2017F 2018F
Gross margin (%) Operating margin (%)
0.88
2012 2013 2014 2015 2016F 2017F 2018F
Net debt to equity (x)
2009 2010 2011 2012 2013 2014 2015
September 28, 2016 7
3.
Company Profile
3.1
Background
Established in 1973 as part of the conglomerate Sungai Budi Group, TBLA is a fully integrated palm oil company with a land bank of c.95,000ha across the Sumatra and Kalimantan regions. Through PT Sungai Budi and PT Budi Delta Swakarya, the Sungai Budi Group holds 58.68% of the company, followed by the public (41.22%) and others (0.1%).
Figure 7: TBLA’s shareholding structure
Source: Company, Maybank
As of 2015, the company had a fresh fruit bunch (FFB) milling capacity of 1.35m tons and a kernel crushing capacity of 270,000 tons per annum. On average, TBLA processes c.50% of its total CPO production to olein (cooking oil) and sells it under the brands “Rose Brand” and “Tawon” which are distributed by over 48,000 outlets across Indonesia.
The company also tapped into the lucrative domestic sugar industry back in 2013 by building a sugar refinery with an output capacity of 212,000 tons and has been converting oil palm plantations that are past their prime into sugar plantations. As of 1H16, the company had converted a cumulative 9,312ha of its past-prime oil palm plantations into sugar cane plantations since 2011.
Next, TBLA started construction of its sugar mill with a potential white sugar production capacity of 100,000 tons back in 2015. Completion of this by the end of 2016 will transform the company into an integrated sugar producer.
Figure 8: TBLA’s oil palm and sugar business summary
Oil Palm Sugar
% of Revenue
2010 100% 0%
2015 86% 14%
2018E 67% 33%
Plantation acreage (1H16 ha) 52,704 9,312
Milling Capacity (tons/annum) 1.35m 1.2m*
September 28, 2016 8
3.2
Revenue breakdown
As of 2015, cooking oil (i.e palm olein) sales made up the largest part of TBLA’s revenue at 33%, followed by CPO (16%), palm kernel oil (15%), stearine (13%), sugar (11%), and others (12%). Domestic sales comprised 57% of revenue, with exports at 43%.
The company exports its CPO, PKO, stearine and crude coconut oil to the Netherlands, Singapore, Malaysia, Hong Kong and China. We expect TBLA’s revenue mix will change significantly in the next two years as its sugar business’ contribution increases going forward. This should translate to higher operational margins given the sugar division’s higher margins. Figure 9: TBLA revenue breakdown for FY15
Source: Company, Maybank
Figure 10: Expect higher contribution from sugar in 2016F
Source: Company, Maybank 16%
11%
33% 13%
15%
12%
CPO
Sugar
Cooking oil
Stearine
PKO
Others
12%
33%
26% 9%
11% 10%
CPO
Sugar
Cooking oil
Stearine
PKO
September 28, 2016 9
4.
Sweet Sugar: Industry Dynamics
The Indonesian sugar industry is a little perplexing — it was the world’s second largest sugar producer in the 1930s but is now one of the world’s largest importers. Sugar cane planted areas have remained the same but low yields and inefficient production due to old equipment are believed to be the key reasons for the c.3m supply-demand gap. This is why as of 2015, Indonesia imports about USD682.7m of sugar in value, world’s 7th largest importer, which is about 3% of the world’s total sugar imports.
We believe this undersupply in the sugar industry benefits TBLA. Being the last company to obtain a permit to build a sugar refinery and also one of the very few players with its own sugar cane plantation should sustain its sugar import quota going forward.
Apart from TBLA, Salim Ivomas Pratama (SIMP IJ), Indofood group’s plantation arm, is the only listed Indonesian player in the sugar space and even then, it only makes up c.3% of its total revenue. In contrast, we expect sugar to account for 38% and 65% of TBLA’s revenue and EBITDA in 2017.
4.1
Opportunities for the new kid on the block
The government’s plan to achieve self-sufficiency by 2019 looks barely plausible at this stage but has created opportunities for TBLA. After being a fully integrated palm oil player for over 30 years, the company is expanding its reach into the sugar business. We believe the regulated and protected sugar industry in Indonesia could result in high margins for efficient sugar players in the country.
The company is eyeing its entry into the retail segment, which offers even higher margins, now that it is close to having an integrated infrastructure with its soon-to-be completed sugar mill. This comes on the back of having built a sugar refinery in 2013 and 9,312ha of planted sugar cane plantation as of 1H16 (targets to plant up to 15,000ha by 2018).
4.2
Sugar industry overview
In general, there are two segments within the sugar industry in Indonesia, namely refined sugar which is mainly used for industrial purposes and white sugar which is sold to retail customers. Most refined sugar is processed from imported raw sugars, which are melted/dissolved, decoloured and crystallized. White sugar, on the other hand, is mostly milled from local sugar cane plantations and processed for retail purposes.
Figure 11: Refined sugar for industrial purposes sold in sacks
Source: sugarlabinta.com, Maybank
Figure 12: White sugar sold to retail customers
September 28, 2016 10
4.3
Demand outstrips supply
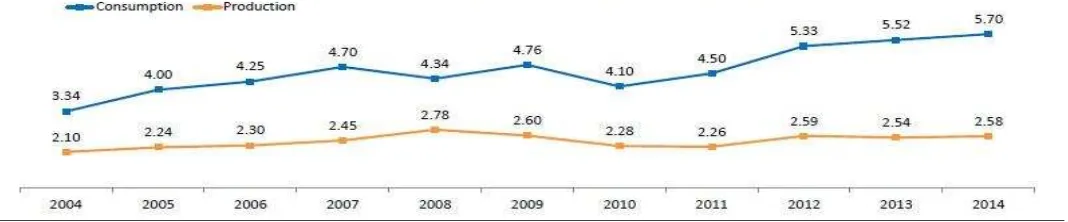
Indonesians love sugar. It has been an integral part of the local daily diet from sweetened tea to sweetened coffee. This is reflected in the steady increase in the country’s sugar consumption (both industrial and retail) from 3.34m tons in 2004 to 5.7m tons in 2015, a 10-year CAGR of 5.5%.
Still, the country’s sugar consumption per capita is still very low compared to its Southeast Asian peers like Malaysia, Thailand, Vietnam and the Philippines. With the growing middle class, we expect the growth rate will be sustainable going forward. Domestic production of sugar, however, has been relatively flattish for the past 10 years, with a 10-year CAGR of only 2.1%, and the undersupply has grown as a result.
As such, the government decided to allow the import of raw sugars from other large sugar producing countries such as Brazil and Thailand to fill the gap. As a comparison, Indonesia produced 33.7m tons of sugar cane in 2015, while during the same period, Brazil produced 739.3m tons, followed by India’s 341.2m tons, China’s 125.5m tons, Thailand’s 100.1m tons and Pakistan’s 63.8m tons.
Figure 13: Demand for sugar is double the supply
Source: Kontan, Maybank
Figure 14: Global sugar production
Source: Various Internet Sources, Maybank
Figure 15: 2015 sugar cane planters’ estate by segment
Source: Maybank
2.5
10.1 7.6
25.5
37.0
0 5 10 15 20 25 30 35 40
Indonesia Thailand China India Brazil
Global sugar production (Mn tons)
56% 19%
26%
Small holder
SOE owned
September 28, 2016 11
4.4
Structural deficiency of
Indonesia’s sugar production
From being one of the world’s largest sugar exporters, Indonesia is now among the world’s largest sugar importers. Indonesia’s sugar production has languished behind Brazil, the US, Thailand and Australia. Although the harvest area of sugar cane in Indonesia is similar to Australia, with the latter’s acreage falling off in recent years, Indonesia’s output is far behind. Notwithstanding the benefit of being one of the fastest sugar consuming countries, Indonesia’s sugar production remains stubbornly inadequate.
The underlying challenges are:
Small holders – Small holders account for c.56% of the country’s c.472,000ha of sugar cane plantations. These farmers tend to be inefficient in harvesting and have high production costs as some of them rent their sugar cane plantation land.
Low yields - Indonesia’s low yield is attributable to inferior sugar cane seedlings, poor cultivation process and weak supply chain management.
Old equipment and mills – Around 65% of the country’s existing sugar mills are over 100 years old as most were built during the Dutch colony era. This results in operational inefficiencies and thus leads to lower extraction rate of white sugar.
High barriers to entry – Land bank availability in regions suitable for sugar cane plantations is scarce and also very expensive, rendering the creation of an integrated sugar mill economically unfeasible. Take Java for example, where 46% of sugar cane plantations are located on the island. A conservative cost for 1ha of land bank would amount to IDR150m/ha land (ie broadly similar to brownfield acquisition prices given the heavily populated Java Island has no more sizeable greenfield land bank). As such, a 15,000ha sugar cane plantation would require a capital outlay of IDR2.25t.
We do not expect the government’s push for self-sufficiency by 2019 to be realised. Also, such deeply rooted structural deficiencies are unlikely to be resolved anytime soon. Instead, they create opportunities for new players like TBLA, with its inherent legacy advantages, to penetrate the market.
4.5
Raw sugar import quota to make up for shortfall
The production deficit is made up for by imports. While the government allows the import of raw sugar from other countries, it also enacts a quota on the amount of raw sugar allowed to be imported on an annual basis. This is to ensure that imported raw sugar will not flood the domestic market and disrupt the domestic sugar price.
Raw sugar import quota has been increasing since 2012, in line with the increasing undersupply of sugar in Indonesia. In 2012, the government allowed 2.35m tons of raw sugar to be imported into the country, and the figure grew to 3.1m tons in 2015 as growth in sugar consumption has been outpacing production. It is important to note that sugar import quotas are granted only to companies that operate sugar refineries for industrial purposes.
September 28, 2016 12 As of 2016, TBLA was granted a raw sugar import quota of 264,000 tons by
the government, or equivalent to 8.5% of the allocated import quota for the period. We believe the allocated raw sugar import quota could significantly increase TBLA’s earnings for 2016F.
Figure 16: Historical raw sugar import quota set by the government
Source: Various internet sources, Maybank
4.6
Price floor to protect local farmers
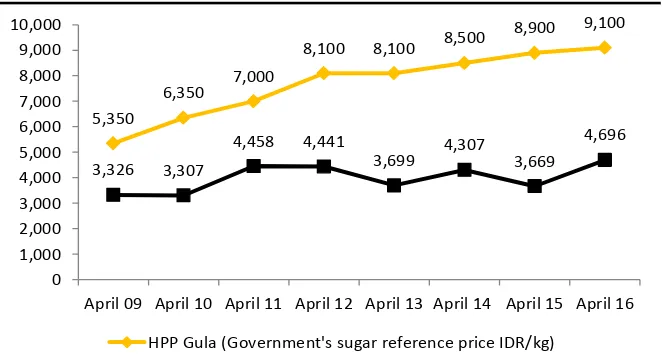
In striving to improve sugar production, apart from imposing import quotas on raw sugar, the government also publishes a reference price for both refined sugar and retail white sugar, effectively setting a price floor for the two. This is being done to protect local farmers which have high production costs (some farmers rent their land for sugar cane cultivation) and cannot compete with international sugar prices due to their lack of scale and harvesting inefficiencies.
The government’s reference price for sugar was 61-143% higher than international prices from 2012-2015. In reality, however, prices for both refined sugar and retail white sugar are even higher than the reference prices after factoring in distribution costs due to the supply-demand gap.
Since the inflated prices are aimed at keeping inefficient producers in business, efficient and competitive players can generate substantial returns at these prices.
Figure 17: Gov’t regulates sugar prices to protect the domestic sugar farmers
Source: Kontan, Maybank
2.35 2.26
2.8
3.1 2.74
2.98 3.12
3.20
0 0.5 1 1.5 2 2.5 3 3.5
2012 2013 2014 2015
Raw sugar import quota (Mn tons) Undersupply (Mn tons)
5,350
6,350
7,000
8,100 8,100 8,500
8,900 9,100
3,326 3,307
4,458 4,441
3,699 4,307 3,669
4,696
0 1,000 2,000 3,000 4,000 5,000 6,000 7,000 8,000 9,000 10,000
April 09 April 10 April 11 April 12 April 13 April 14 April 15 April 16
HPP Gula (Government's sugar reference price IDR/kg)
September 28, 2016 13
4.7
Profitability of refineries and millers
Import quotas allow refineries to purchase raw sugar from overseas and the refined sugar is sold to industrial users. We believe refiners tend to be more profitable than millers as the capital required for refineries is much lower, yet they generate similar profits.
For example, TBLA’s existing refinery, which has a capacity of 200,000 tons, required a capital outlay of USD50m and generates operating margin of c.30%. On the other hand, its sugar mill, which has a white sugar production capacity of 100,000 tons, required an investment outlay of USD100m and generates operating margin of c.57%.
Our calculation suggests that given a 20-year lifespan and average selling price of c.IDR10,000/kg, a sugar mill (excluding land acquisition cost) would generate an IRR of 26% while a sugar refinery can reach up to 60% IRR. Important to note, however, is that refineries are subject to uncertainties about securing the import quota which is granted by the government annually. In 2015, TLBA failed to secure any import quota for its refinery as the newly elected government reviewed import quotas being allocated to refiners.
4.8
Opportunity for TBLA
TBLA has already entered the refinery business and is completing its sugar mill by the end of the year to produce sugar from its own plantations for the retail segment. Unlike other new players, TBLA was able to convert c.9,312ha of ageing oil palm into sugar cane as of 1H16 since 2011, already ensuring a minimum 58.2% operating capacity. The company plans to increase its sugar cane plantation to 12,000ha this year and 14,000ha by 2017.
Recent news also pointed out that the government will require existing refineries to submit a long–term proposal for the development of sugar cane plantations to support the local sugar industry. Refiners that fail to execute on the submitted proposal will have to transfer their assets to the government. Should the regulation be strictly enforced, TBLA would be at an advantage in obtaining import quotas compared to its refinery competitors through the completion of its integrated sugar mill next year.
4.9
Competitive landscape
Indonesia has 63 sugar mills, mostly spread across Java and Sumatra island. Out of the 63 mills, 53 are owned by SOE companies such as PTPN XI and PT Rajawali Nusantara Indonesia while the remaining 10 are controlled by the private sector. Sugar Group is the largest private sugar player controlling c.62,000ha of sugar cane plantation and distributes its premium brand “Gulaku” white sugar across the country.
September 28, 2016 14 While data on each refinery is very limited, various sources have reported
that Indonesia’s total refinery capacity is somewhere between 4m and 5m per annum, sufficient to close the supply deficit. As such, we believe it would be hard for the government to allow new refineries to open going forward.
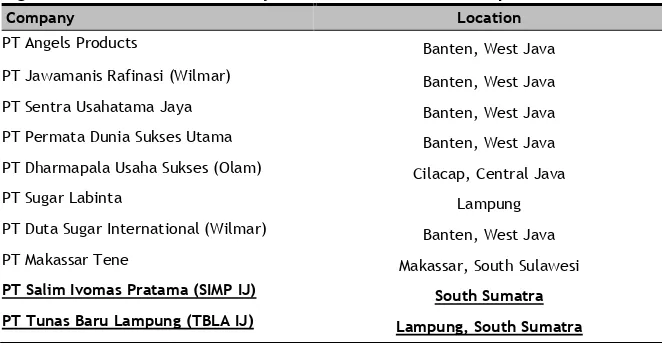
Figure 18: SIMP & TBLA the only two listed Indonesian companies
Company Location
PT Angels Products Banten, West Java
PT Jawamanis Rafinasi (Wilmar) Banten, West Java
PT Sentra Usahatama Jaya Banten, West Java
PT Permata Dunia Sukses Utama Banten, West Java
PT Dharmapala Usaha Sukses (Olam) Cilacap, Central Java
PT Sugar Labinta Lampung
PT Duta Sugar International (Wilmar) Banten, West Java
PT Makassar Tene Makassar, South Sulawesi
PT Salim Ivomas Pratama (SIMP IJ) South Sumatra
PT Tunas Baru Lampung (TBLA IJ) Lampung, South Sumatra
Source: Various Internet Sources, Maybank
Figure 19: Sugar players’ market shares based on estimated refining capacity/annum
Source: Various Internet Sources, Maybank
While TBLA only accounts for 6% of the total refining capacity in Indonesia, we believe the company’s sugar import quota allocation should be sustainable at c.200,000 tons per annum at least in the near future based on Indonesia’s supply deficit of c.3m tons/annum. With a total of 12 operating refineries, each refinery should be given an import allocation of c.250,000 tons/annum if divided evenly.
7%
17%
18%
6% 52%
Olam
Wilmar
SIMP IJ
TBLA IJ
September 28, 2016 15
4.10
Long road to self-sufficient sugar production
While there is still a risk that the government won’t grant sugar import
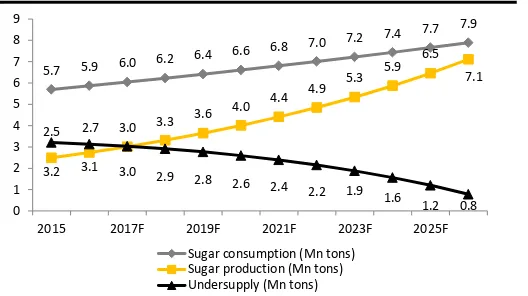
In our view, a 10% CAGR for sugar production over 10 years is not possible. With sugar cane yield of 70 tons/ha and an 8% extraction rate assumption, Indonesia would need an average of 82,000ha of planted sugar cane per annum and four new mills to be fully functional ever year. Land bank availability is definitely one of the barriers as there is limited available land bank in the region.
Furthermore, conversion to sugar cane from empty land in Java or oil palm trees in Sumatra would not be easy nor cost efficient. In Java’s case, where the island is heavily populated and has some of the biggest cities in Indonesia with robust economic activities, land prices will continue to rise and it may be more cost effective to transform the valuable agricultural land into industrial or residential areas.
For conversion of oil palm trees in Sumatra, cost-to-maturity for oil palm trees is estimated to be around USD6,500/ha and it may not be cost efficient to do so, unless they are past their prime, low-yielding and due for replanting. Moreover, only South Sumatra (Lampung especially) is suitable for growing sugar cane as other parts of Sumatra has high average rainfall and is more suitable for planting oil palm trees.
Figure 20: 3% increase in consumption and 10% increase in production for 10 years…
Source: Company, Maybank
Figure 21: …which we don’t think is possible given land bank availability and construction period
2015 2017F 2019F 2021F 2023F 2025F
Sugar consumption (Mn tons)
2016F 2018F 2020F 2022F 2024F 2026F
September 28, 2016 16
5.
Economics of Sugar Involvement
5.1
Expansion into sugar
With the appeal of an ageing, largely inefficient and protected sugar industry, TBLA decided to expand into sugar in 2012. It completed its 212,000-ton p.a refinery in 2013 at a capital outlay of USD50m. It was rewarded with a sugar import quota of 18,000 tons in that same year. As Indonesia persistently experiences a shortfall in domestic sugar production, TBLA was granted an even higher import allocation of 264,000 tons in 2016.
As of 6M16, the company already had a cumulative 9,312ha of planted sugar cane and was planning to further increase it to c.14,000ha in 2017. These plantations were converted from the company’s maturing oil palm plantations which have reached over 20 years of age. TBLA’s plans to become an integrated sugar player would be realized when its sugar cane mill in Lampung, with a capacity of 8,000 tons per day (equivalent to c.100,000 tons of white sugar) is completed by 2017. TBLA will be able to produce white sugar and sell it to the retail market.
5.2
Natural crossover
We think that TBLA is in the right place at the right time to convert into a fully integrated sugar player as 1) Lampung, where the majority of TBLA’s land bank is located, is perfect for the cultivation of sugar cane because it’s near the equator (more suitable for sugar plantations), 2) only past-prime oil palm plantations over 21 years of age will be converted into sugar cane plantations thus resulting in minimal opportunity cost, and 3) the government’s protection of the sugar industry will significantly boost TBLA’s earnings going forward.
Figure 22: TBLA sugar cane plantation 2012-2018F
Source: Company, Maybank
1,305 1,963
4,516
7,929
12,000
14,000
15,000
0 2,000 4,000 6,000 8,000 10,000 12,000 14,000 16,000
2012 2013 2014 2015 2016F 2017F 2018F
September 28, 2016 17
5.3
The land barrier
Not all plantation companies (including oil palm plantation) can enter the sugar industry. Location of the sugar cane plantation, land bank availability and land acquisition costs play an important role. Sugar cane plantations are best located in regions near the equator or places with relatively dry weather. This would mean that the hundreds of thousands of hectares of oil palm estates in the Kalimantan region would not be suitable as sugar cane yields might not be economical enough to justify the conversion.
Most of the sugar cane plantations in Indonesia are located in East Java (46%), followed by Lampung (24%), Central Java (12%) and the rest scattered across six regions. Sugar mills have been historically built around the region as well. Out of the 63 sugar mills that Indonesia has, 52 are located in Java, making it a central island for sugar cane plantations (60% of Indonesians also reside in Java Island).
While it would be logical to develop sugar cane plantations in Java, land bank availability in Java is limited, especially if one were to buy tens of thousands of hectares outright. Even if there happens to be an opportunity to purchase such parcels of land in Java, assuming a conservative IDR150m/ha (ie. broadly similar to brownfield acquisition prices as there is no more sizeable greenfield land in the heavily populated Java Island), a 15,000ha land would cost a steep outlay of IDR2.25t, before taking into account the USD100m investment to build an 8,000tcd (equivalent to c.100,000 tons of sugar cane/annum) sugar mill.
5.4
Economics of switching from oil palm into sugar cane
We believe the company’s decision to convert its maturing palm oil plantation is borne out of economics. For an existing plantation, the land cost has been sunk and is therefore taken out of the equation. TBLA’s IRR for sugar is 26% vs 5.59% for oil palm. But the critical assumptions are that the selling price of CPO remains at IDR7,500/kg while sugar price at IDR10,000/kg assumes continued government protection.
Figure 23: Sugar mill vs oil palm IRR project comparison
Oil Palm Sugar
Assumptions:
Size of plantation 15,000ha 15,000ha
End product CPO White sugar
Life of mill 20 years 20 years
Replanting cost USD6,000/ha USD1,333/ha
Capital outlay of mill USD12m USD100m
Cost of land USD111m* USD111m*
ASP (IDR/kg) IDR7,500 IDR10,000
IRR (excl. Cost of land) 5.08%* 26%*
IRR (incl. Cost of land) -2.06%* 8.9%*
Source: Company, Maybank; * based on brownfield acquisition prices (PLEASE REFER TO APPENDIX 1 PG 30 FOR IRR & NPV CALCULATION)
September 28, 2016 18 TBLA has the upper hand compared to other companies wanting to enter
the industry as the company had already owned its existing 9,312ha land bank and is located in Lampung, which happens to be suitable for sugar cane plantations.
5.5
Revenue and cost dynamics of milling facility
Assuming a yield of 75 tons/ha and an extraction rate of 8%, a 14,000ha estate could produce 900,000 tons of sugar cane/annum, thus translating to 84,000 tons of white sugar/annum. With an ASP of IDR10,500/kg and all-in cost of IDR4,500/kg, TBLA will be able to generate an operating profit of IDR504b and net profit of IDR378b in 2017 from its white sugar business alone (EBIT margin of c.57%).
Figure 24: TBLA white sugar business assumptions
White Sugar 2017E 2018E
Sugar cane landbank 14,000 15,000
Sugar cane yield (tons/ha) 75 75
Sugar cane production (tons) 1,050,000 1,125,000
Extraction rate 8.0% 8.5%
White sugar production (tons) 84,000 95,625
White sugar ASP (IDR/kg) 10,500 10,500
White sugar Revenue (IDR Bn) 882 1,004
Sugar cane planting cost (IDR/kg) 2,000 2,000
All in milling Cost (IDR/kg) 2,500 2,500
White sugar margin (IDR/kg) 6,000 6,000
White sugar operating profit (IDR Bn) 504 574
Op. Profit margin (%) 57% 57%
Source: Company, Maybank
5.6
Refined sugar business, a huge boost to bottom line
With its own sugar refinery, TBLA is one of a handful of companies in Indonesia given a permit by the government to import raw sugar. While the company did not obtain an import quota last year as the newly elected government reviewed the import quotas, TBLA was given a permit to import 264,000 tons of raw sugar this year. The figure is significantly higher than 2014’s allocation of 108,000 tons. We believe this year’s import quota could significantly increase TBLA’s bottom line.
Figure 25: TBLA historical import quota allocation
Source: Company, Maybank KE
18,000
108,000
0
264,000
200,000 200,000
0 50,000 100,000 150,000 200,000 250,000 300,000
2013 2014 2015 2016F 2017F 2018F
September 28, 2016 19
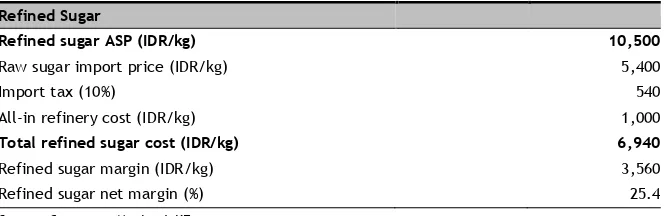
From a number’s perspective, the average import price would be c.IDR5,940/kg (IDR5,400 average international price + 10% import tax). Management stated that refinery all-in cost of production would conservatively be IDR1,000/kg. This would translate to a refined sugar cost of IDR6,940/kg. The government’s sugar reference price was set at IDR9,100/kg but in reality, refined white sugar is being sold at around IDR10,000-12,000/kg in the open market.
One may argue that MNCs looking to buy refined white sugar would have the bargaining power to lower prices to closer to the overall import cost and thus pressure margins. However, TBLA’s refined white sugar customers are mostly SMEs which arguably are price takers and thus the company enjoys very good margins.
Assuming a conservative ASP of IDR10,500/kg and sales volume of 200,000 tons, this would result in an operating profit margin of IDR3,560/kg (or 34%). Contribution from the 264,000 tons of imported raw sugar would be c.IDR500b towards TBLA’s bottom line in 2016.
Figure 26: TBLA’s refined sugar business calculation
Refined Sugar
Refined sugar ASP (IDR/kg) 10,500
Raw sugar import price (IDR/kg) 5,400
Import tax (10%) 540
All-in refinery cost (IDR/kg) 1,000
Total refined sugar cost (IDR/kg) 6,940
Refined sugar margin (IDR/kg) 3,560
Refined sugar net margin (%) 25.4
Source: Company, Maybank KE
While the refined sugar business is lucrative, we acknowledge the risk of not being allocated a sugar import quota by the government. On the bright side, a local newspaper report citing the Ministry of Trade said the government will further tighten import quota allocation for refiners. Refiners will still be given raw sugar import quotas if they submit a detailed proposal on plans to develop sugar cane plantations and mills to support the domestic sugar industry.
September 28, 2016 20
6.
Palm Oil Business and Outlook
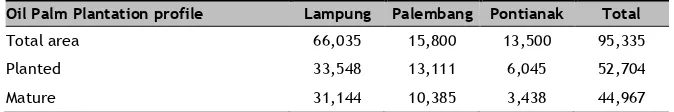
TBLA has around 95,000ha of land bank across the Sumatra and Kalimantan region. Majority of its land bank is located in the Lampung (South Sumatra) area with 33,548ha of planted area, followed by Palembang (South Sumatra) with 13,111ha planted area and Pontianak (West Kalimantan) with 6,045ha planted area, in which 52,704ha are planted as oil palm plantations as of 1H16.
Out of the 52,704ha (inclusive of plasma) of oil palm plantations, 44,967ha are mature while the remaining 7,737ha are immature plantations. Around 40,084ha or 76% of its total oil palm plantations are nucleus area.
Looking at its nucleus age profile, Lampung has the oldest and largest area at an average age of 13.6 years and 23,700ha of nucleus planted area, followed by Palembang at 8 years average age and 10,400ha. Pontianak is the newest development at only 4.6 years average age and around 6,050ha.
Figure 27: TBLA oil palm plantation profile as of 1H16
Oil Palm Plantation profile Lampung Palembang Pontianak Total
Total area 66,035 15,800 13,500 95,335
Planted 33,548 13,111 6,045 52,704
Mature 31,144 10,385 3,438 44,967
Source: Company, Maybank
6.1
Price flattish in ST; LT demand-supply outlook stable
We share the view of our regional plantation analyst, Ong Chee Ting (refer to his report Regional Plantations: Don't bet on La Nina yet dated July 12, 2016), as we expect a much stronger HoH output, capping the price upside from the recovering supply. We expect CPO prices will likely average c.MYR2,500/t in 2H16. Our CPO ASP forecast for 2016 and 2017 is MYR2,450 and MYR2,400/t, respectively.
While we expect a supply recovery as we enter the peak cropping months to cap the upside on CPO prices in the short term, we are not worried about palm oil’s middle- to long-term demand prospects. Assuming the current CPO price (c.IDR7,500/kg) stays, we believe EBIT margins of c.30% for its upstream and an additional c.5% for its downstream division are at least sustainable. Adding the expectation of strong output recovery from 4Q16 onwards, we expect margin expansion as higher yield should translate to lower unit production cost.
Being the cheapest and most commonly used edible oil with the highest productivity, palm oil’s long-term consumption demand will be sustainable as populations of emerging and developing economies like India, Indonesia and the African continent are growing rapidly.
To support this, Oil World’s latest forecast shows tightening stock -to-usage ratio for palm oil as well as the seven other oils, which are soybean oil, cotton oil, groundnut oil, sunflower oil, rapeseed oil, palm kernel oil, and coconut oil (palm oil made up 36% of market share).
September 28, 2016 21
Figure 28: Stock-to-usage ratio
Source: Maybank, Oil World
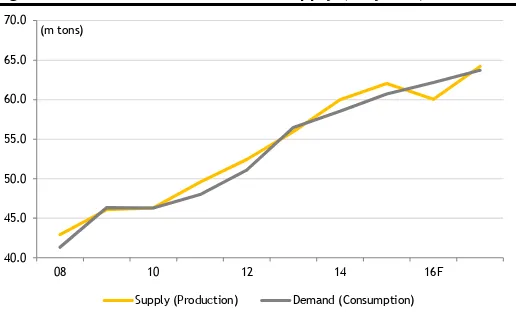
Figure 29: Palm oil’s demand and supply (10 years)
Source: Maybank KE, Oil World
6.2
Downstream as a hedge
Considering the backdrop of stronger output going forward capping CPO price upside, we are positive on TBLA’s ability to produce downstream products, which will provide additional margins to offset CPO price downside risks. In 2015, when CPO prices were pressured by tumbling oil prices and implementation of export levies, downstream products made up 82% of TBLA’s oil palm division revenue, which increased from 58% contribution in 2010.
TBLA’s major downstream products include palm cooking oil (olein, 45%) palm kernel oil (PKO, 20%), and stearine (18%) which comprise c.83% of its total downstream revenue for FY15. Other downstream products include biodiesel, palm expeller, palm fatty acid distillate (PFAD), margarine, and soaps.
Figure 30: Oil palm division revenue breakdown
Source: Maybank KE, Company
Figure 31: FY15 downstream revenue composition
Source: Maybank
Biggest contribution of its downstream products came from its cooking oil (olein). Although TBLA’s “Rose” brand is not as big as Indofood’s “Bimoli,” Sinarmas’ “Filma,” or Wilmar’s “Sania,” the brand has gained respectable market awareness and also popularity recently due to its competitive pricing and also its wide variety of products, ranging from dried vermicelli to flour. This can be seen from TBLA’s 2-year (2013-2015) CAGR of 35% for cooking oil revenue.
6% 11% 16% 21% 26% 31%
87 89 91 93 95 97 99 01 03 05 07 09 11 13 15F 17F
8 Major Oils Palm Oil
40.0 45.0 50.0 55.0 60.0 65.0 70.0
08 10 12 14 16F
Supply (Production) Demand (Consumption) (m tons)
1,000 2,000 3,000 4,000 5,000 6,000
2010 2011 2012 2013 2014 2015 2016F 2017F 2018F
Upstream Downstream (in IDRb)
45.2%
17.8% 20.5%
16.4%
September 28, 2016 22 While TBLA has its downstream products to offset CPO price downside
risks, TBLA also owns its upstream division to enjoy the increase in prices during a CPO price bull trend. We believe this flexibility will sustain oil palm division earnings, while TBLA enjoys higher margins from its sugar division upon the completion of its sugar mill.
6.3
Upstream sustainability
TBLA’s upstream operational capabilities such as its age profile and FFB yield, however, are not as great as its peers. As of 1H16, TBLA’s age profile was 14 years old and TBLA produced 5.3 tons of FFB/ha (not annualized). This is below its peers’ average of c.10 years old and 7.3tons/ha.
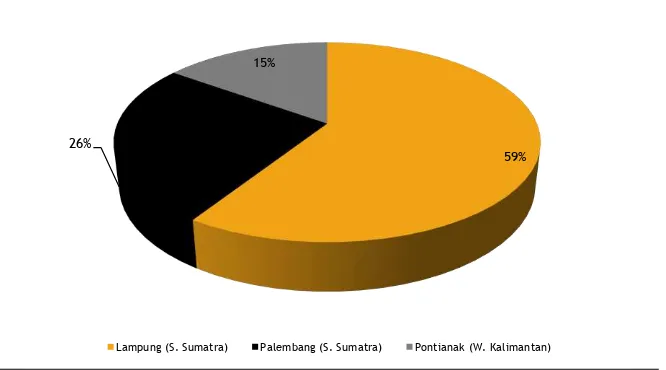
We believe this is due to where its estates are located, whereby 59% of its total planted areas are in Lampung (most bottom part of South Sumatra). Lampung is less suitable than Kalimantan as well as other parts of Sumatra for oil palm tree planting due to its dryness and soil type. This explains why dense rainforests in Indonesia are located in North Sumatra and also in Central and East Kalimantan.
Figure 32: Estate location composition
Source: Company, Maybank KE
At the same time, TBLA’s estates in Lampung are also the oldest, averaging c.18 years old. This is why management decided to cut down old, past-prime oil palm trees and convert them into sugar cane plantations in 2012 instead of replanting with oil palm. Lampung’s generally drier weather renders it more suitable for sugar cane crops than oil palm trees.
Figure 33: Area rainfall precipitation comparison
Total Rainfall Precipitation (mm) 2014 2013 2012
Lampung 1,484 2,457 1,685
North Sumatra 1,860 2,627 3,175
West Sumatra 2,787 4,627 4,339
Central Kalimantan 2,351 3,260 2,596
West Kalimantan 2,305 3,382 3,081
East Kalimantan 2,245 2,854 2,421
Source: Maybank KE
59% 26%
15%
September 28, 2016 23
In 2016, like other planters in the region, TBLA’s nucleus FFB output dropped 23% YoY in 1H16 due to lagged effect of 2015’s strong El Nino on yield. That being said, we believe that TBLA will deliver exciting FFB production growth at 13.4% CAGR for 2016-2018F, driven by its younger estates in Palembang and Pontianak, also taking into account the conversion of past-prime oil palm trees to sugar cane. 45% of its estates are still in young mature/immature stages. We expect FFB yield to improve as these trees mature.
Figure 34: Nucleus FFB growth trend
Source: Maybank KE
Figure 35: Nucleus age profile
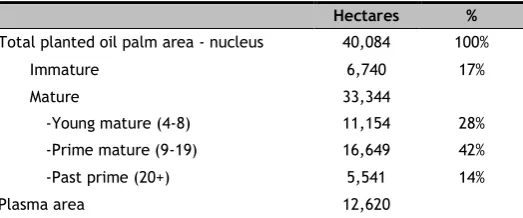
Hectares %
Total planted oil palm area - nucleus 40,084 100%
Immature 6,740 17%
Mature 33,344
-Young mature (4-8) 11,154 28%
-Prime mature (9-19) 16,649 42%
-Past prime (20+) 5,541 14%
Plasma area 12,620
Source: Maybank KE, Company (as at 1H16)
10 12 14 16 18 20 22
300,000 350,000 400,000 450,000 500,000 550,000 600,000 650,000 700,000 750,000
2011 2012 2013 2014 2015 2016 2017 2018
September 28, 2016 24
7.
Financial Analysis
7.1
Earnings analysis
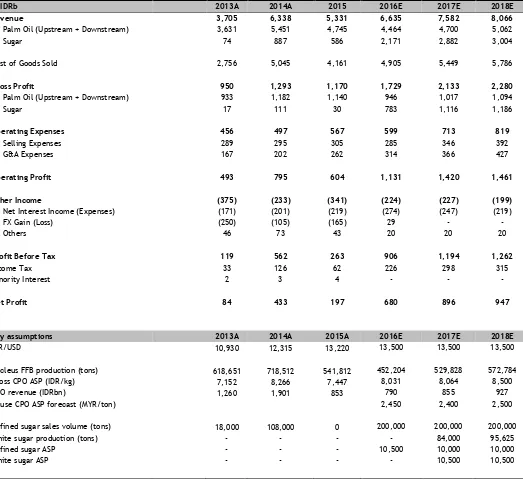
We expect TBLA’s revenue to grow by 24%/14% for 2016/17F mainly on the back of refined sugar contribution from the import allocation and commencement of its sugar mill operations starting in 2017. Revenue from its sugar division should significantly increase from IDR586b in 2015 to IDR2.2t in 2016 as the company was given a sugar import allocation of 264,000 tones. Additionally, we also expect recovering CPO production in 2017 to support TBLA’s revenue growth going forward.
For 2017, we expect sugar revenue to further grow by 33% to IDR2.9t as the company’s sugar mill will have commenced operations and should contribute 84,000 tons of white sugar volume sales. As such, we expect TBLA’s sugar business to contribute 33-38% of the company’s total revenue for 2016-17F.
Figure 36: Income statement
in IDRb 2013A 2014A 2015 2016E 2017E 2018E
Revenue 3,705 6,338 5,331 6,635 7,582 8,066
Palm Oil (Upstream + Downstream) 3,631 5,451 4,745 4,464 4,700 5,062
Sugar 74 887 586 2,171 2,882 3,004
Cost of Goods Sold 2,756 5,045 4,161 4,905 5,449 5,786
Gross Profit 950 1,293 1,170 1,729 2,133 2,280
Palm Oil (Upstream + Downstream) 933 1,182 1,140 946 1,017 1,094
Sugar 17 111 30 783 1,116 1,186
Operating Expenses 456 497 567 599 713 819
Selling Expenses 289 295 305 285 346 392
G&A Expenses 167 202 262 314 366 427
Operating Profit 493 795 604 1,131 1,420 1,461
Other Income (375) (233) (341) (224) (227) (199)
Net Interest Income (Expenses) (171) (201) (219) (274) (247) (219)
FX Gain (Loss) (250) (105) (165) 29 - -
Others 46 73 43 20 20 20
Profit Before Tax 119 562 263 906 1,194 1,262
Income Tax 33 126 62 226 298 315
Minority Interest 2 3 4 - - -
Net Profit 84 433 197 680 896 947
Key assumptions 2013A 2014A 2015A 2016E 2017E 2018E
IDR/USD 10,930 12,315 13,220 13,500 13,500 13,500
Nucleus FFB production (tons) 618,651 718,512 541,812 452,204 529,828 572,784
Gross CPO ASP (IDR/kg) 7,152 8,266 7,447 8,031 8,064 8,500
CPO revenue (IDRbn) 1,260 1,901 853 790 855 927
House CPO ASP forecast (MYR/ton) 2,450 2,400 2,500
Refined sugar sales volume (tons) 18,000 108,000 0 200,000 200,000 200,000
White sugar production (tons) - - - - 84,000 95,625
Refined sugar ASP - - - 10,500 10,000 10,000
White sugar ASP - - - - 10,500 10,500
September 28, 2016 25 We expect TBLA’s net profit to grow by 245% to IDR680b in 2016F and by
32% to IDR896b in 2017F as the sugar business starts to really kick in. From 2018 onwards, we acknowledge that earnings growth will slow as sugar earnings boost should peak and stabilize unless there is capacity expansion. However, both sugar volume and ASP should grow together with Indonesia’s population and inflation, respectively. Additionally, we still expect growth coming from its maturing oil palm trees.
1H16 net profit of IDR310b was within expectations, making up 45% of our forecast, as TBLA was carried by its sugar division, while its oil palm division suffered from severely weak FFB yield due to the El Nino impact. We are expecting a stronger 2H16, on the back of recovering output for oil palm and sustainable refined sugar sales from its raw sugar import quota. TBLA has only sold 78,430 tons of sugar as of 1H16, as raw sugar import only started in 2Q16, leaving room to sell more sugar in 2H16. 1Q16 net profit was only IDR50b compared to 2Q16’s IDR260b.
7.2
Sensitivity analysis
Our sensitivity analysis suggests that changes in refined sugar ASP will have the most impact on our earnings forecast. Despite generating lower margins compared to the retail white sugar business, refined sugar sales volume is almost double that of retail white sugar. For every IDR1,000/kg increase/decrease in refined sugar price, our 2016-17F earnings will increase/decrease by 21% and 16% respectively.
Figure 37: Earnings most sensitive towards changes in refined sugar prices
Sensitivity Analysis 2016E 2017E 2018E
While overall margins have been under pressure for the past several years due to the decline in CPO prices, we expect an improvement on the back of its sugar business. As we have pointed out, margins for the sugar business (both refined and white sugar) are very high (EBIT margin of 34% and 57% respectively), and as such, will propel TBLA’s margins.
For 2016/17F, we expect TBLA to generate 17%/19% EBIT margins as the company sells 200,000 tons of refined sugar in 2016F and an additional 84,000 tons of white sugar in 2017F as its mill becomes fully operational. Net profit margins should also significantly improve from 4% in 2015 to 10% in 2016F and 12% in 2017F.
Figure 38: Gross and operating margin forecast
Source: Company, Maybank
Figure 39: EBITDA & net margin forecast
Source: Company, Maybank
2011 2012 2013 2014 2015 2016F 2017F 2018F
Gross margin (%) Operating margin (%)
22%
2011 2012 2013 2014 2015 2016F 2017F 2018F
September 28, 2016 26
7.4
Balance sheet: Deleveraging opportunity
Figure 40: Balance sheet
in IDRb 2013A 2014A 2015A 2016E 2017E 2018E
Cash & Equivalents 648 520 296 636 272 136
Total Non-Current Liabilities 2,270 2,590 2,708 4,736 4,652 4,492
TOTAL LIABILITIES 4,414 4,864 6,405 7,512 7,286 7,091 gearing ratio will fall to 1.25x in 2016F and 0.83x in 2018F.
For its total debts, c.30% is denominated in USD, while the rest is in IDR. Average cost of debts is c.6% pa.
Figure 41: Total debt since 2012
Source: Company, Maybank
Figure 42: Company plans to deleverage going forward after the completion of its sugar mill in 2017
Source: Company, Maybank
2012 2013 2014 2015 2016F 2017F 2018F
Total debt (IDR Bn)
2012 2013 2014 2015 2016F 2017F 2018F
September 28, 2016 27
7.5
Cash flow analysis
Figure 43: Cash flow statement
in IDRb 2013A 2014A 2015A 2016E 2017E 2018E
Operating (13) 536 (90) 564 932 1,119
Net Income 84 433 197 680 896 947
Depreciation & Amortization 211 270 239 305 355 375
Changes in Working Capital (236) (355) (238) (319) (233) (135)
Others (73) 188 (288) (102) (86) (68)
Free Cash Flow (910) (421) (2,026) (436) 332 519
Investing (897) (957) (1,936) (1,000) (600) (600)
Capital Expenditures (897) (957) (1,936) (1,000) (600) (600)
Financing 1,083 319 1,933 834 (423) (297)
Equity 23 256 344 - - -
ST Liabilities 893 (66) 165 (204) (340) (136)
LT Liabilities 60 97 1159 820 (242) (242)
Others 106 33 265 219 159 81
Dividend Paid (73) (26) (131) (59) (272) (358)
Changes in Cash & Equivalents 100 (128) (224) 340 (364) (136)
Ending Cash and Equivalents 648 520 296 636 272 136
Source: Company, Maybank
Post-completion of its sugar mill in 2017, we expect the company’s capex to fall to IDR600b/annum after peaking at IDR1.9t back in 2015 (beginning of mill construction) and thus start to generate positive FCF. TBLA’s sugar business should generate high free cash flows as margins for both refined sugar and retail white sugar are high while annual maintenance capex for refinery and mill are expected to be IDR10b and IDR30b respectively.
Management stated that deleveraging will be the focus for TBLA once its sugar mill is fully operational. As such, we expect the company will start paying off its debt starting in 2017.
7.6
Dividend policy
September 28, 2016 28
8.
Valuation
8.1
SOTP valuation
Our SOTP target price of IDR1,500 implies 8.9x 2017F P/E (still below its 5-year historical mean of 10.4x). We use EV/ha valuation methodology for TBLA’s palm oil business, DCF methodology for its sugar business and P/E methodology for its refined sugar business, considering the different nature of the divisions.
We assume an EV/ha of USD9,000 for the palm business, a slight discount to its local peers’ average of c.USD10,000 EV/ha due to its lower productivity compared to its peers and also due to anticipation of the industry’s current challenges.
We assign a LT growth rate of 3% and WACC of 10.5% (70-30% debt to equity capital structure for both TBLA’s sugar refinery and sugar mill financing) for TBLA’s sugar business’ DCF methodology. We believe contribution from its sugar business should significantly increase TBLA’s earnings going forward as profit margins are thick for both refined sugar and retail white sugar business.
Figure 44: SOTP valuation
2017 Assumption Cash Debt Net Debt Equity Value Valuation methodology
EV IDRb IDRb IDRb IDRb IDRb
Palm Oil Business 4,859 EV/ha (USD 9,000/ha)
Refined sugar business 3,936 8x 2017 P/E
White sugar business 3,521 DCF (LT 3%, WACC 10.5%)
Sub-total 12,316 272 (4,432) (4,160) 8,156
# of shares, bn 5.34
NAV / Share, IDR 1,527
Price Target, IDR 1,500
WACC assumptions:
Rf 7.0%
Rp 9.5%
Beta 1.0
CoE 16.5%
CoD 10.5%
Tax 25%
Net CoD 7.9%
WACC 10.5%
Source: Company, Maybank
8.2
Attractive P/E and P/BV
TBLA’s P/E and P/BV valuations are at 1SD below their LT means, which is undemanding as the share price has yet to recover from the disappointing 2015 results (due to weak CPO prices and no raw sugar import quota). We believe the share price should recover given the brighter outlook of both its oil palm and sugar divisions this year.
September 28, 2016 29
Figure 45: Forward P/E band
Source: Maybank KE, Bloomberg
Figure 46: Historical P/BV band
Source: Maybank KE, Bloomberg
8.3
Local and regional peer comparisons
TBLA trades at a discount to its local and regional peers’ average. We believe this is due to the relatively lower productivity of its oil palm division, and also due to worries that the import sugar quota from the government is not sustainable.
However, as explained above, we see much upside on the brighter outlook of the oil palm division this year and also the completion of the sugar mill. We also believe the sugar import quota will be sustainable as the current domestic sugar deficit will be hard to change.
Figure 47: Against local peers
Company Rating Mkt Cap
(USD m) Shr Px
(IDR)
TP (IDR)
EV/Ha
(USD/ha) PE (x) EV/EBITDA (x) P/B (x) Div Yield (%) ROE (%)
23 Sept 23 Sept 23 Sept 16E 17E 16E 17E 17E 16E 17E 17E
Astra Agro (AALI IJ) BUY 2,276 15,450 19,000 10,460 20.9 18.1 10.0 8.9 1.7 1.9 2.2 9.9
Sawit Sumbermas (SSMS IJ)* N.R 1,192 1,635 N.R 19,196 28.3 19.1 16.4 11.7 3.9 1.0 1.4 20.9
London Sumatra (LSIP IJ) BUY 799 1,530 1,750 6,381 20.8 13.1 8.6 5.9 1.3 1.9 3.0 10.1
Eagle High Plant'n (BWPT
IJ)* N.R 523 218 350 7,764 N/A N/A N/A N/A 1.1 0.0 0.0 2.6
Tunas Baru Lampung (TBLA
IJ) BUY 356 870 1,500 13,555 6.8 5.2 6.3 5.0 1.1 5.9 7.7 23.6
Dharma Satya (DSNG IJ)* N.R 341 420 N.R 8,484 14.0 9.3 9.2 7.7 1.3 1.8 1.7 14.6
Sampoerna Agro (SGRO IJ)* N.R 281 1,940 N.R 4,445 14.7 11.8 9.5 6.9 1.0 1.2 1.8 9.3
Indonesia Average (excl.
BWPT) 20.8 15.8 2.0
Source: Maybank KE, Bloomberg ( * = not rated, based on Bloomberg numbers)
Additionally in the region, Malaysian planters command higher valuations due to differences in land values. Most Malaysian planters own their land while Indonesian planters only have the rights to plant on their land. As Singapore-listed planters’ estates are mostly located in Indonesia, their valuations are broadly similar to Indonesian planters.
0 5 10 15 20 25 30 35 40
2009 2010 2011 2012 2013 2014 2015 2016 PER Mean SD - 1 SD + 1
SD +1
SD -1
0 1 2 3 4 5 6 7
2007 2008 2009 2010 2011 2012 2013 2014 2015 2016
September 28, 2016 30
Figure 48: Against regional peers
Company Rating Mkt Cap
(USD m) Shr Px
(LCY) TP (LCY)
EV/Ha
(USD/ha) PE (x) EV/EBITDA (x) P/B (x) Div Yield (%) ROE (%)
26 Sept 26 Sept 16E 17E 16E 17E 16E 16E 17E 16E
Sime Darby (SIME) Hold 12,151 7.90 7.56 11,526 21.3 20.7 14.6 13.8 1.4 3.2 3.1 7.0
IOI Corp (IOI) Hold 6,848 4.48 4.20 34,714 28.5 26.2 19.6 17.0 4.2 1.8 1.9 12.5
KL Kepong (KLK) Hold 6,224 24.04 21.60 19,858 28.0 25.1 16.4 15.2 2.5 2.1 2.4 12.7
Felda Global (FGV) Hold 2,137 2.41 1.80 7,511 62.7 34.9 15.1 12.8 1.4 1.0 1.7 2.2
Gent Plant (GENP) Hold 2,110 10.96 10.18 11,461 33.5 25.2 23.7 18.6 1.9 0.6 0.8 5.9
Swk Oil Palms (SOP) Hold 408 3.80 4.00 8,197 15.6 11.3 7.9 6.3 1.1 1.3 1.8 7.5
TSH Resources (TSH) Hold 620 1.88 1.95 22,345 25.2 18.5 23.1 18.3 1.8 1.2 1.6 7.2
Ta Ann (TAH) Buy 389 3.60 3.75 5,130 14.4 13.3 7.0 6.6 1.3 3.1 3.4 9.2
TH Plant (THP) Hold 243 1.13 1.20 10,512 33.2 33.2 14.7 14.2 0.8 0.9 0.9 2.3
Bous Plant (BPlant) Hold 580 1.49 1.50 4,894 74.6 41.4 27.9 20.9 1.1 4.4 2.4 6.8
Malaysia Average 28.8 24.2
Golden Agri (GGR)* N.R 3,373 0.36 N.R 12,079 15.6 14.7 11.6 9.8 0.6 2.3 2.6 3.7
First Resources (FR) Buy 2,168 1.86 1.80 13,279 24.4 18.0 13.2 10.3 2.7 1.2 1.7 11.5
Bumitama (BAL) Buy 956 0.74 0.97 11,506 18.3 10.9 12.7 7.9 2.2 1.1 1.9 12.4
Indofood Agri (IFAR)* N.R 462 0.45 N.R 5,624 17.4 9.9 7.8 6.4 0.5 0.7 0.9 2.8
Singapore Average 18.8 14.9
September 28, 2016 31
9.
Risks
9.1
Regulatory risks
Regulatory risks remain an unpredictable factor regarding the profitability of plantation companies. For the oil palm industry, import tariffs levied by the top importing or consuming countries, enforcement of export levies, and also environmental certification are among the common barriers faced.
For the sugar industry, regulatory risks are relatively low, in our view, considering the current rigid demand and supply situation. However, its impact can be huge if there are regulatory changes. Regulations that may affect existing sugar players are those relating to import quota, floor price for local sugar, and refinery licensing.
9.2
Resistance from NGOs
We are concerned that if NGOs gain more support from the government, new plantings of oil palm may become harder to execute. Additionally, they may hinder operations through constant inspections and audits. This may also affect TBLA’s expansion strategy as well as their profitability.
9.3
Weather impact
Weather anomaly will always be a wildcard for planters, and its impact is significant on production. After the strong 2015-16 El Nino event, there is a 50% chance of a La Nina developing in 4Q16. Depending on its severity, a mild La Nina could boost production yields and dampen CPO prices, while a severe La Nina could hinder harvesting and damage infrastructure temporarily, and also decrease soybean yields in South America leading to a positive boost in CPO prices.