www.elsevier.comrlocaterdsw
An analysis of process industry production and inventory
management systems
Daina R. Dennis
a, Jack R. Meredith
b,) aDepartment of Management, Miami UniÕersity, Oxford, OH, USA
b
Babcock Graduate School of Management, Wake Forest UniÕersity, P.O. Box 7659, Winston-Salem, NC 27109, USA
Abstract
The process industries — those firms that add value by mixing, separating, forming andror chemical reactions by either batch or continuous mode — continue to lag behind the discrete industries in the identification and implementation of
Ž .
effective production and inventory management P & IM techniques. A contributing factor is that the process industries have traditionally been lumped together and contrasted from the discrete industries as a whole, thus leading to misunderstandings regarding individual process industries. From site interviews and the literature, we identified four critical dimensions —
Ž .
planning resource requirements for materials and capacity , tracking resource consumption, control of work-in-process ŽWIP , and degree of computerization — represented by seven variables by which to contrast and analyze process industries.. Based on in-depth field studies of 19 diverse process plants, we find that there exist at least four distinct types of process
Ž . Ž . Ž . Ž .
industry P & IM systems: 1 simple, 2 common, 3 WIP-controlled, and 4 computerized.q2000 Elsevier Science B.V. All rights reserved.
Keywords: Production and inventory management; Process industries
1. Introduction and background
Identifying the right kind of production and
inven-Ž .
tory management P & IM system for a manufactur-ing firm can be a difficult and complex task. Since the investment in a P & IM system is large and remains fixed over a considerable length of time, the correct system choice is critical to both a firm’s short and long-term profitability. Research on the selection and implementation of P & IM systems for different manufacturing environments has been extensive. The
)Corresponding author. Tel.:q1-336-758-4467; fax:q
1-336-758-4514.
Ž .
E-mail address: [email protected] J.R. Meredith .
majority of the research, however, has been for industries handling discrete units that are fabricated
andror assembled during manufacturing. This
re-search has resulted in numerous successful develop-ments in taxonomies, P & IM systems, and imple-mentation strategies for the discrete industries.
The process industries, consisting of firms that
Aadd value by mixing, separating, forming andror
chemical reactions by either batch or continuous
w x
modeB Wallace, 1992 , continue to have difficulty
realizing the benefits of many of the management system developments in the discrete industries.AThe process sector, although more automated than dis-crete industries at the process control level, lags discrete when it comes to overall manufacturing
0272-6963r00r$ - see front matterq2000 Elsevier Science B.V. All rights reserved. Ž .
Ž .
management systems toolsB Crow, 1992 . The
rea-sons for this are many and varied. A brief review of past and current research sheds some light on the essence of this problem.
Unfortunately, as shown in the left column of Table 1, the great majority of process industry re-search simply reports general characteristics of the industry without reference to their P & IM systems. There are three subgroups of research in this column. The research listed in item 1 focuses on the unique characteristics of the process industries and com-pares them as a whole to discrete industries. This group of research nevertheless provides some back-ground understanding of the problems unique to the process industries that are caused by the handling of non-discrete materials involving variability, sequenc-ing, co-products, shelf-life, and so on. A smaller segment of research, item 2, addresses the general problems that process industries encounter regarding P & IM. A very small segment, item 3, describes the varying degrees of success that specific process firms have had with material requirements planning
ŽMRP implementations..
A smaller overall group of research pertains to P & IM systems in process industries. The references in item 4 address specific P & IM problems that
process firms have encountered and their solutions. Item 5 captures much of the current scheduling research on P & IM systems focused primarily on high volume process flow manufacturers and illus-trates the application of a technique called process
Ž .
flow scheduling PFS . PFS has been described both theoretically and analytically, and shown in certain circumstances to be successful in practice. However, the full extent of applicability of the PFS logic has not yet been established.
Item 6 includes three references, each of which provides a different perspective for creating a basic taxonomy of process industry P & IM systems. These three perspectives may be considered to constitute the entirety of current theory about different types of process industry P & IM systems. Robinson and
Tay-Ž .
lor 1986 classify P & IM systems by the primary
resource that must be managed: material dominated,
capacity dominated, or a combination of both. Knowing which resource is primary provides valu-able P & IM information, particularly about schedul-ing priorities and resource constraints. In contrast,
Ž .
Vollmann et al. 1997 in their well-known manufac-turing planning and control book categorize P & IM systems by distinguishing between time-phased and rate-based systems. The third categorization by Finch
Table 1
Process industry literature
General process industry characteristics Process industry P & IM systems
1 — process industry uniqueness 4 — specific P & IM problems and solutions
Adelberg, 1984; Aiello, 1982; Allen, 1980; Allen and Schuster, 1994; Allen and Schuster, 1994; Baumeister, 1997; Daniels, 1983; Baumeister, 1997; Clark, 1983; Cohen, 1980; Cokins, 1988; Dayvolt and Symonds, 1994; Eads, 1989; Gerchak et. al., 1996; Covey, 1984; Dayvolt and Symonds, 1994; Doganaksoy and Hahn, Katayama, 1996; Parker, 1997; Thompson, 1991
1996; Duncan, 1981; Eads and Undheim, 1984; Fransoo, 1992;
Fransoo and Rutten 1994; Haxthausen, 1995; Katayama, 1996; 5 — high-Õolume P & IM scheduling
Nelson, 1983; Nichols and Ricketts, 1994; Parker, 1997; Bolander and Taylor, 1990; Bolander and Taylor, 1993; Rice and Norback, 1987; Rutten, 1993; Shelley, 1995; Swann, Hubbard et al., 1992; Taylor and Bolander, 1990; Taylor and
1984; Tiber, 1981 Bolander, 1991; Taylor and Bolander, 1993; Taylor and Bolander,
1995; Taylor and Bolander, 1997
2 — general P & IM problems 6 — basic P & IM taxonomies
Burt, 1980; Crow, 1992; Dennis, 1993; Finch, 1986; Finch and Cox, Robinson and Taylor, 1986; Volmann et al., 1997; 1987; Fransoo, 1992; Fransoo and Rutten 1994; Taylor, 1979 Finch and Cox, 1988
3 — specific MRP successes
Ž .
and Cox 1988 looks at whether the P & IM systems are driven by make-to-stock, assemble-to-order, or make-to-order requirements.
A primary goal of this research study was to help build operations management theory in this area by identifying the range of P & IM systems being used at individual plants in the process industries, the unit of analysis in this study. Since theory testing should not be conducted using the same data that built the
Ž
theory Green, 1978, p. 432; Meredith et al., 1989,
.
pp. 301–303 , no attempt was made here with this limited data set to also test the theory. Nor was it used to try to identify the AbestB P & IM systems under various circumstances, such tests and applica-tions thus being deferred for future studies.
A detailed analysis of the P & IM systems of 19 diverse processing plants was carried out. The focus was on both the similarities and differences between the P & IM systems. Overall, this paper addresses the following three questions:
1. What are the relevant variables by which process industry P & IM systems can be differentiated? 2. How do these variables differ between different
P & IM systems?
3. Can the different P & IM systems be put into manageable subgroups based on their P & IM vari-ables and, if so, what are the subgroups and their characteristics?
The following sections provide the background for answering these three questions. In the next section, the choice of variables, the research sample, and the analysis process will be addressed.
2. Identifying the key P & IM system variables
In order to effectively compare the P & IM sys-tems, the characteristics that best differentiate be-tween different P & IM systems had to be identified. The challenge was to isolate those characteristics that would provide a parsimonious yet thorough description of the sites’ P & IM systems. Research suggests that this description must distinguish be-tween materials and capacity. Many researchers
ŽPlossl and Wight, 1967; Abraham et al., 1985;
.
Dietrich, 1987; Vollman et al., 1997 recognize that
the basic elements of any P & IM system include attention to both materials and capacity. Robinson
Ž .
and Taylor 1986 expand on this by suggesting that P & IM systems may be classified by the primary resource that must be managed: materials, capacity, or a combination of both. Knowing which resource is
primary provides valuable information about
scheduling priorities and resource constraints. As such, the variables used in this research always considered materials and capacity separately.
Any description of a P & IM system must also address both the planning and control of resources.
Ž
Several researchers Abraham et al., 1985; Dietrich,
.
1987; Vollman et al., 1997 illustrate the relationship between planning and control within P & IM systems using hierarchical frameworks. As one moves down these hierarchies, the required input and output infor-mation shifts from plans for resource requirements to the actual tracking of resources consumed. The information also become more detailed and compre-hensive as the time horizon changes from long range to short range.
These two sets of research thus indicated the necessity for variables that measure the planning of
Ž .
material requirements MAT-REQUIREMENTS ,
Ž
the planning of capacity requirements
CAP-RE-.
QUIREMENTS , the tracking of actual materials
Ž .
consumed MAT-CONSUMPTION , and the
track-Ž
ing of actual capacity consumed
CAP-CONSUMP-.
TION .
Ž .
Plossl and Wight 1967 describe work-in-process
ŽWIP. as one of the most significant inventories
because of its direct effect on manufacturing lead times. They also indicate that tracking WIP can be
Ž .
difficult and complicated. Vollman et al. 1997 state that WIP can be determined by using detailed WIP systems based on shop order transactions at one extreme. At the other extreme, it may be simply calculated by exploding the bills of materials for whatever has been delivered into finished goods less whatever is left in raw materials. Because of the importance of WIP and the varied methods that may be applied to monitor it, the variable WIP-CON-TROL was included to describe the manner in which WIP was tracked.
from the above sources, the fraction of materials and capacity planned and controlled by computerization is also an important characteristic because highly detailed and complex P & IM systems require
com-puterization. As one plant manager stated:AWe had
to computerize this process to get good information.
It was too complicated to keep track of manually.B
Another manager said: AWe need input from so
many different areas that we had to develop an
information system to manage it.B Both managers
indicated that degree of computerization was an important factor in distinguishing P & IM systems. Thus, the variables MAT-COMPUTERIZATION and CAP-COMPUTERIZATION were added.
However, this characteristic was intentionally lim-ited to P & IM elements; it was not meant to include general firm sophistication in computers, decision
support, information systems, and other non-P & IM aspects. Moreover, given the quickly evolving nature of the computer area, this characteristic was inten-tionally kept as straightforward as possible. A great
Ž .
number of papers e.g., Boyer et al., 1996, 1997 have investigated the impact of computerized tech-nology on performance but again, that was not the purpose here. The aim here was to identify the most simple and straightforward characteristics that would distinguish between P & IM systems, and fraction of computerized control, again of both materials and capacity, was such a characteristic.
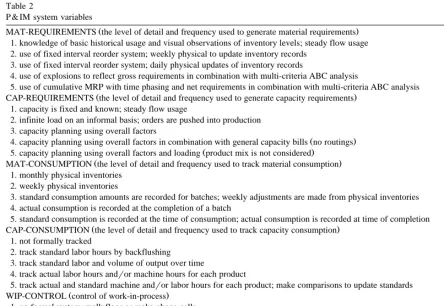
Combining all the above information resulted in the seven composite variables described in Table 2 that were believed to differentiate process industries’ P & IM systems from each other. These seven
vari-Ž .
ables are: 1 planning of material requirements
Table 2
P & IM system variables
Ž .
MAT-REQUIREMENTS the level of detail and frequency used to generate material requirements 1. knowledge of basic historical usage and visual observations of inventory levels; steady flow usage 2. use of fixed interval reorder system; weekly physical to update inventory records
3. use of fixed interval reorder system; daily physical updates of inventory records
4. use of explosions to reflect gross requirements in combination with multi-criteria ABC analysis
5. use of cumulative MRP with time phasing and net requirements in combination with multi-criteria ABC analysis
Ž .
CAP-REQUIREMENTS the level of detail and frequency used to generate capacity requirements 1. capacity is fixed and known; steady flow usage
2. infinite load on an informal basis; orders are pushed into production 3. capacity planning using overall factors
Ž .
4. capacity planning using overall factors in combination with general capacity bills no routings
Ž .
5. capacity planning using overall factors and loading product mix is not considered
Ž .
MAT-CONSUMPTION the level of detail and frequency used to track material consumption 1. monthly physical inventories
2. weekly physical inventories
3. standard consumption amounts are recorded for batches; weekly adjustments are made from physical inventories 4. actual consumption is recorded at the completion of a batch
5. standard consumption is recorded at the time of consumption; actual consumption is recorded at time of completion
Ž .
CAP-CONSUMPTION the level of detail and frequency used to track capacity consumption 1. not formally tracked
2. track standard labor hours by backflushing 3. track standard labor and volume of output over time
4. track actual labor hours andror machine hours for each product
5. track actual and standard machine andror labor hours for each product; make comparisons to update standards
Ž .
WIP-CONTROL control of work-in-process 1. no formal system; walk floor or make phone calls
2. physical inspections are supported by daily meetings and use of shift notes
Ž .
3. can back into WIP information from other inventory information backflushing ; use of more detailed shift notes 4. batched starts are tracked at regular intervals.
5. starts and completions are tracked on a perpetual basis
ŽMAT-REQUIREMENTS ; 2 generating capacity. Ž .
Ž . Ž .
requirements CAP-REQUIREMENTS , 3 tracking
Ž . Ž .
material consumption MAT-CONSUMPTION , 4
Ž
tracking capacity consumption
CAP-CONSUMP-. Ž . Ž . Ž .
TION , 5 tracking WIP WIP-CONTROL , 6
computerization used to plan and control materials
ŽMAT-COMPUTERIZATION , and 7 computeri-. Ž .
Ž
zaused to plan and control capacity
CAP-COM-.
PUTERIZATION .
3. The research sample
Three important issues with respect to the selec-tion of the research sample are: deciding what consti-tutes a true process firm, determining how to select the firms, and deriving a procedure to determine what constitutes a separate type of P & IM system.
3.1. What constitutes a process firm
Approximately 50% of all firms consider
them-Ž
selves to be in the process industries Novitsky,
.
1983 . Many of these firms are actually hybrids due to the fact that their nondiscrete units become dis-crete at some point during the manufacturing pro-cess. How far into a manufacturing process a product becomes discrete can vary widely.
To eliminate most of the confusion that these hybrids can cause, this research was limited to firms with products that only become discrete at either the point of containerization or during the last process
Ž
immediately prior to containerization e.g., baked
.
goods, tablets, capsules, and blended meat products . The materials of the firms chosen for this research are in the forms of gases, liquids, slurries, pulps, crystals, powders, pellets, films, andror semi-solids and can only be tracked by weight or volume. Be-cause of the similarities in the physical nature of the materials used, the firms share similar problems in the storing, tracking, and transporting of their materials.
At this early stage of theory building for identify-ing different kinds of process industry P & IM sys-tems, it was decided that a limited but heterogeneous sample of firms would be necessary. The sample needed to be limited because the data was to be collected through a labor-intensive field study but
heterogeneity was needed to be able to distinguish between different types of P & IM systems. In partic-ular, heterogeneity was desired across firm size, process industries, and product types. In addition, firm size heterogeneity would likely include build-to-stock as well as build-to-order and assemble-to-order heterogeneity.
3.2. Selecting the firms
This issue was addressed in several steps. First, a list of firms that could potentially be considered for the research was compiled. Second, each firm was contacted to determine if it met the criteria for constituting a process firm described above. And third, the firm had to give its permission to be included in this research.
Several sources were solicited to assist in compil-ing a list of potential firms to consider for this research. The primary source was the American
Pro-Ž .
duction and Inventory Control Society APICS .
Ž .
APICS has a special interest group SIG for process industries whose membership list is available upon special request. This source accounted for over half of the contact list. Another important source was the local Business-to-Business directory. Firms listed un-der products typically consiun-dered part of the process industries were added to the contact list. Finally, some participants provided referrals and contacts for other firms.
The initial contact with each of 62 potential firms was made by telephone. The primary purpose of
Ž .
these initial telephone contacts was to: 1 determine
Ž .
a willingness to participate, 2 find out what process
Ž .
industry the firm belonged to, 3 determine if the
Ž .
firm met the process criteria outlined above, 4
obtain some preliminary ideas on the kind of
manu-Ž .
facturing systems used by the firm, 5 establish the
Ž .
existence of a functioning P & IM system, and 6 schedule an onsite meeting. It took at least two and as many as 12 telephone calls to obtain this informa-tion. About a third of the firms required some written explanation of the research before they would give the request further consideration.
facil-Ž
ities were too far away more than a 2-hour driving
.
radius . The rest of the non-participants were elimi-nated because they either did not want to share information they considered to be confidential or they simply did not want to invest the time required to participate.
To help ensure that appropriate and well-managed P & IM systems were being used, the P & IM systems
Ž .
were evaluated using Landel’s 1982 audit. The use of this audit provided information on whether the conditions related to the P & IM system were excel-lent, good, average, very poor, or unacceptable. Any firm that rated below average was disqualified from participain the research study. After the results of this audit were considered, 13 firms qualified to be included in the research study.
To test for possible non-respondent bias, a
two-Ž
wave test was conducted Armstrong and Overton
Ž1977..since we had no data at all on the firms that
declined to participate in the study. Four sites were very late holdouts in joining the study and thus used as our second wave, considered to be typical of the non-respondents. The overall MANOVA test was not
Ž .
significant ps0.81 so the two waves were treated
as one group in the study.
3.3. What constitutes a separate type of P & IM system?
A particular firm may have one or more different types of P & IM systems in use in their plant. In some companies, the different P & IM systems are located in separate plants, the unit of analysis, making the distinction clear. In other companies, the different P & IM systems shared the same plant site. In these situations, considering only entirely different product lines, different types of processes, separate profit centers, and independent P & IM systems resulted in a clear separation. In each of the firms, the separa-tion between the different P & IM systems was thus very apparent.
The 13 firms provided data on 19 different P & IM systems. In the firms where only one site existed, the site and the firm were considered to be equivalent research units. Six of the firms, however, provided two separate research sites resulting in two units of analysis each. To test for possible correlation be-tween these six pairs of sites, Spearman
non-para-metric rank correlation coefficients were computed for each of the seven variables. The highest correla-tion obtained was 0.55 and none were significant. Moreover, in the cluster analysis described later, three of the pairs clustered in different clusters, almost what would be expected by chance. Thus, all 12 sites were treated as having independent P & IM systems.
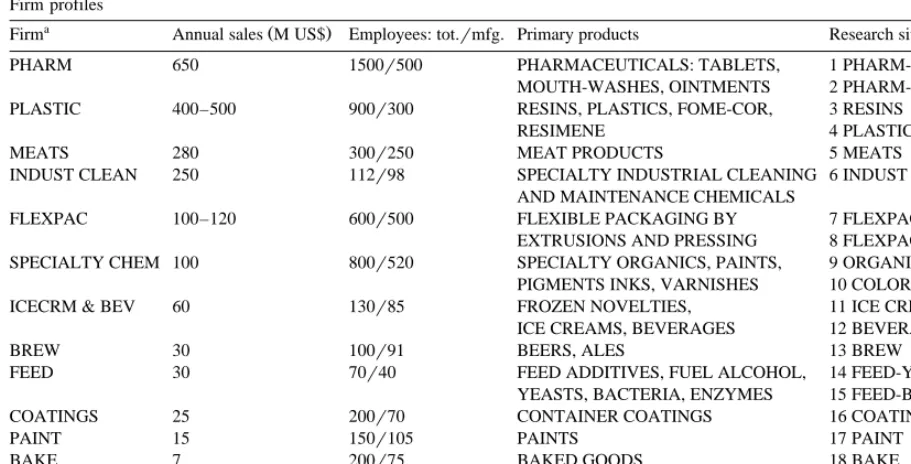
The 19 research sites represent a wide variety of
Ž .
different process industries see Table 3 . The 19 sites vary in size, number of employees, available products, transformation system, and so on. All of these sites, however, share one very important char-acteristic described earlier — each of the sites use non-discrete materials throughout the majority of the manufacturing process. In all cases, the products do not become discrete until either containerization or the step immediately prior to it. For a complete
Ž .
description of the sites, refer to Dennis 1993 .
3.4. Data collection
Each plant visit was extensively planned and combined interviews with physical tours, thereby resulting in the desired extensive documentation. Anywhere from 6 to 16 h were spent on-site asking questions. Between one and eight people were inter-viewed at each site. In addition, approximately 1 to 3 h were spent on the telephone for follow-up or clarification after each on-site visit. To minimize the use of everyone’s time, preliminary information about the company was obtained prior to the on-site visit. Information was acquired from the firm’s personnel department, stockholders’ reports, the library, and other such sources. Also, pre-set schedules were used to structure the day so that the sequence of information was obtained in the desired order.
Table 3 Firm profiles
a Ž . a
Firm Annual sales M US$ Employees: tot.rmfg. Primary products Research sites
PHARM 650 1500r500 PHARMACEUTICALS: TABLETS, 1 PHARM-TABLETS
MOUTH-WASHES, OINTMENTS 2 PHARM-LIQUIDS
PLASTIC 400–500 900r300 RESINS, PLASTICS, FOME-COR, 3 RESINS
RESIMENE 4 PLASTIC
MEATS 280 300r250 MEAT PRODUCTS 5 MEATS
INDUST CLEAN 250 112r98 SPECIALTY INDUSTRIAL CLEANING 6 INDUST CLEAN
AND MAINTENANCE CHEMICALS
FLEXPAC 100–120 600r500 FLEXIBLE PACKAGING BY 7 FLEXPAC-EXTRUD
EXTRUSIONS AND PRESSING 8 FLEXPAC-PRESS
SPECIALTY CHEM 100 800r520 SPECIALTY ORGANICS, PAINTS, 9 ORGANICS
PIGMENTS INKS, VARNISHES 10 COLORS
ICECRM & BEV 60 130r85 FROZEN NOVELTIES, 11 ICE CREAM
ICE CREAMS, BEVERAGES 12 BEVERAGES
BREW 30 100r91 BEERS, ALES 13 BREW
FEED 30 70r40 FEED ADDITIVES, FUEL ALCOHOL, 14 FEED-YEASTS
YEASTS, BACTERIA, ENZYMES 15 FEED-BLEND
COATINGS 25 200r70 CONTAINER COATINGS 16 COATINGS
PAINT 15 150r105 PAINTS 17 PAINT
BAKE 7 200r75 BAKED GOODS 18 BAKE
FINISHES 2.5 22r14 PAINTS, STAINS, LACQUERS, 19 FINISHES
SEALERS, ENAMELS
a
Identified by this descriptor through the remainder of this paper.
Triangulation was used to ensure reliability by obtaining the same piece of information from three different sources: oral statements from knowledge-able people, documentation, and visual observation. It was possible to obtain information from at least two of these sources for almost all of the data. Three sources, however, were possible for only a few of the characteristics.
Referring back to Table 2, it was possible to obtain direct and continuous measures for both
MAT-COMPUTERIZATION and
CAP-COM-PUTERIZATION simply by estimating the percent of P & IM tasks that are performed manually and those that are performed by the computer systems. There are no direct measures, however, for the re-quirements and consumption variables
MAT-RE-QUIREMENTS, CAP-REQUIREMENTS,
MAT-CONSUMPTION, and CAP-MAT-CONSUMPTION, as well as WIP-CONTROL. Thus, it was necessary to establish the relative indirect measures shown in the table for these five variables. Since a cluster analysis was to be conducted on the variables, the indirect
measures were scaled so that the site with the least amount of detail on each variable received the lowest score and the site with the greatest detail received the highest score. Each P & IM system was evaluated and then assigned a score between one and five where a 1 represents the least amount of detail and a 5 the most.
4. Analysis of the P & IM system variables
The data for the P & IM system variables were examined in several ways. First, a non-statistical general overview of the raw data was performed.
Ž .
Next, Ward and Jennings’ 1973 clustering method was used to cluster the sites based on the P & IM system variables. Finally, an analysis of the means, standard deviations, coefficients of variation, medi-ans, and ranges of the variables was conducted to provide information for within-group comparisons and between-group comparisons for each of the indi-vidual clusters.
4.1. OÕerÕiew of the P & IM system data
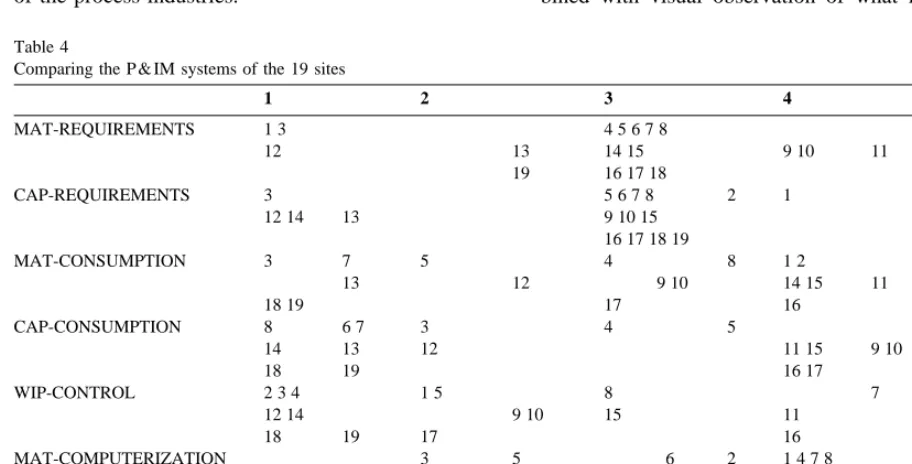
Some interesting insights into the similarities and differences between the 19 individual process indus-try P & IM systems were gained from the raw data
Ž .
concerning the seven P & IM variables see Table 4 . Although our conclusions about the types of process industry P & IM systems can only be considered valid for the industries we investigated, because of the wide diversity of process firms included here, we believe that the sample provides a good cross-section of the process industries.
First, an overall inspection of Table 4 illustrates the wide range of data collected. Some variables clump in the middle, others congregate at the ends and are sparse in the middle, others are relatively evenly dispersed, and still others are somewhat
ran-Ž
domly spread along the scale. The two computeriza-tion variables were transformed from their fraccomputeriza-tional range of 0 to 1, to match the other variables with a
.
range of 1 to 5. Also of interest is that no site scored consistently across all measures at the same values, although we tend to see some that stay closer to one end than the other, such as 12 near the bottom and 11 near the top. Some general insights are described below. Those variables that tended to be similar across the sites are discussed first, followed by those that tended to differ among the sites.
4.1.1. MAT-REQUIREMENTS
The inter-site diversity in the level of detail re-quired for the generation of raw material
require-Ž
ments is large but most sites are at the middle score
. Ž
of 3 . The simplest systems sites 1, 3, and 12 in
.
Table 4 use methods of generating requirements that are based on knowledge of historical usage com-bined with visual observation of what is on hand.
Table 4
Comparing the P & IM systems of the 19 sites
1 2 3 4 5
MAT-REQUIREMENTS 1 3 4 5 6 7 8 2
12 13 14 15 9 10 11
19 16 17 18
CAP-REQUIREMENTS 3 5 6 7 8 2 1 4
12 14 13 9 10 15 11
16 17 18 19
MAT-CONSUMPTION 3 7 5 4 8 1 2 6
13 12 9 10 14 15 11
18 19 17 16
CAP-CONSUMPTION 8 6 7 3 4 5 12
14 13 12 11 15 9 10
18 19 16 17
WIP-CONTROL 2 3 4 1 5 8 7 6
12 14 9 10 15 11
18 19 17 16
MAT-COMPUTERIZATION 3 5 6 2 1 4 7 8
14 12 15 9 10 13 11
18 19 16 17
CAP-COMPUTERIZATION 6 3 5 7 8 4 1 2
14 12 15 9 10 13 11
This can be done effectively because of steady us-age.
The most detailed systems use a combination of methods including a form of cumulative MRP and multiple-criteria ABC analysis. In these systems, regular bills of materials are used but the time buckets are monthly. Material requirements are met by maintaining appropriate days of on-hand levels. If amounts fall below the desired days of on-hand levels, materials are ordered regardless of what the monthly MRP explosion calls for. Multiple-criteria ABC classifications influence the decisions on what amounts of raw material inventories to maintain. This method cannot function as a regular MRP sys-tem because the computerized inventory tracking is not perpetual. Inventory changes to the computer are batched and therefore not timely enough to rely on for ordering purposes. Even though the range for MAT-REQUIREMENTS is large, over half of the
Ž .
sites received a score of three out of five for this variable reflecting their use of some sort of fixed interval reorder system with set minrmax inventory levels. Within these P & IM systems, the inventory levels are updated from either physical inventories or a batched method and are not in real time.
4.1.2. CAP-REQUIREMENTS
The distribution on this variable is very similar to that on MAT-REQUIREMENTS. At three of the
Ž .
sites 3, 12, and 14 the capacities are fixed and known and production is run at basically the same capacity all the time.
Eleven of the sites use capacity determination methods that are so similar that there were no signif-icant differences noted for the variable CAP-RE-QUIREMENTS. At these eleven sites the capacities are not fixed and are quite difficult to measure. In each, the capacity varies with the product mix and the rough-cut capacity planning technique called
ca-Ž .
pacity planning using overall factors CPOF is used. Individual work centers are scheduled by knowl-edgeable people using historical information. The capacity scheduling process is informal and manual; problems due to insufficient capacity are dealt with as they arise.
Ž .
The most sophisticated methods sites 4 and 11 for determining capacity requirements go through the mechanics of finite loading. The results, however,
provide only approximate figures because the effects of product mix and sequencing are not taken into consideration. In these systems, forecasted informa-tion is used to plan overtime or inventory buildups. However, once the aggregate capacity is set at these levels, actual orders are infinite loaded at the disag-gregate level. Again, problems due to insufficient capacity are dealt with as they arise.
4.1.3. MAT-CONSUMPTION
The inter-site diversity in the tracking of raw material consumption is quite large. Also, the distri-bution across this variable from the site using the
Ž .
simplest method 19 to the site using the most
sophisticated raw material consumption tracking
Ž .
method 6 is fairly even. In the simplest methods, consumption is not even tracked on a batch basis; a monthly inventory is conducted primarily for ac-counting purposes. Most of the firms that fall in the middle of the distribution use a backflushing tech-nique to calculate estimated raw material consump-tion based on yields.
The most sophisticated method tracks inventory on almost a perpetual basis. The standard amounts of raw materials consumed are sent to the computer at the time of consumption and actual amounts are reported when the batch is completed. The lead times are short so the information is fairly timely. It is interesting to note that even though this system is supported by the most accurate and timely inventory records, it still does not use MRP. The raw materials are ordered based on reorder points.
4.1.4. CAP-CONSUMPTION
4.1.5. WIP-CONTROL
Six of the sites were ranked at the lowest level for the tracking of WIP. These sites have P & IM sys-tems that do not track WIP on a formal basis. Walking the floor or making telephone calls are the primary sources of information for WIP at these
Ž .
sites. Only one site 6 was ranked at the highest level of detail for tracking WIP. This site tracks WIP on a board that is kept in production where the exact location of all batches is recorded. All movement, stages, and locations are tracked on a real time basis. It is interesting that this most sophisticated WIP tracking method is a manual one.
4.1.6. MAT-COMPUTERIZATION
The fraction of computerization of the materials
Ž
control methods REQUIREMENTS,
MAT-.
CONSUMPTION, and WIP-CONTROL varies
widely. Two sites use methods for the control of materials that are completely manual. Eleven of the P & IM systems use methods that are less than half computerized. The most computerized systems have about three-quarters of their material control meth-ods computerized.
4.1.7. CAP-COMPUTERIZATION
Three sites have not computerized any of the methods used for capacity control in their P & IM systems. Ten sites are less than half computerized. The most computerized systems with respect to ca-pacity control methods are almost fully computer-ized.
5. P & IM system subgroups
The third research question is answered in this section: can the different P & IM systems be put into manageable subgroups based on their P & IM vari-ables and, if so, what are the subgroups and their characteristics?
5.1. Clustering the 19 P & IM systems
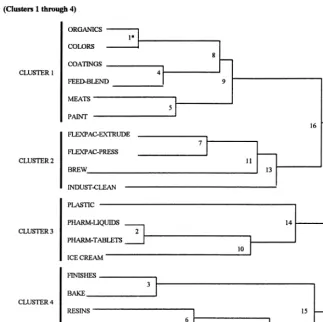
The full clustering sequence for the 19 P & IM systems based on the seven P & IM variables is shown in the dendrogram in Fig. 1. Ward and Jennings’
Ž1973 hierarchical clustering method was used to.
identify the P & IM system clusters. In this method,
the distance between two clusters is the sum of the squares between the two clusters summed over all the variables. This method was chosen primarily on
Ž .
the recommendation of Anderberg 1973 , and be-cause it is hierarchical.
Since Ward’s method uses the sum of the squares of distances, it is not necessary for the data to have normality. However, for this same reason, it was necessary to standardize the data to keep certain variables from influencing the results more heavily than others. All the variables were thus standardized to a mean of zero and a standard deviation of one.
Ž .
SAS 1988 was the statistical package used to per-form Ward’s method.
After Ward’s method was used on the data, it was necessary to determine how many different clusters were actually formed. Deciding on a method to use
Ž
for this determination is not straightforward Everitt,
. Ž .
1979, 1980 . SAS Institute 1988 , however, sug-gests that when cluster analysis is used for the
purpose of dissection, the R2 value provides an
appropriate cut-off point. Thus, the criterion chosen to determine the final number of clusters in this analysis was the R2 value. The R2 values in Fig. 2
show the amount of explained variance that is lost by reducing the number of clusters. The plot of the
number of clusters versus the R2 values in Fig. 2
shows that a substantial drop-off in the R2 values
Ž
occurs below four clusters only 0.088 from 5 to 4
.
versus 0.111 from 4 to 3 . Consequently, the number of clusters should not be reduced beyond four. The dendrogram in Fig. 1 shows the final four P & IM
Ž
system clusters on the left Cluster 1 through Cluster
.
4 that were formed by using this cutoff point.
5.2. Four types of P & IM systems
Ž .
Fig. 1. Dendrogram for P & IM systems Clusters 1 through 4 .
Table 5 gives the actual values and standard deviations of each of the seven variables. An ANOVA test was performed on the clusters for each
Fig. 2. Determining the number of P&IM system clusters.
variable and the p-values are listed at the right side of Table 5, along with the clusters that were identi-fied as significantly different on that variable from a
post-hoc Scheffe test. As can be seen, there were
´
highly significant differences on all the variables except capacity requirements, which was only signif-icant at the 0.10 level rather than 0.05 as used in this
Ž
Scheffe test. If the 0.10 level had been considered
´
significant, the corresponding different clusters would
.
have been 3 and 4. As might be expected, Clusters 3
Žthe AcomputerizedB cluster and 4. Žthe AsimpleB .
vari-Table 5
Variable means and standard deviations for P & IM system clusters
Variables Cluster 1: Cluster 2: Cluster 3: Cluster 4: p-Value Significantly different
common WIP-controlled computerized simple clusters
MAT-REQUIREMENTS 3.33r0.52 2.88r0.25 4.38r0.95 2.00r1.00 0.0021 3–4
CAP-REQUIREMENTS 3.00r0.0 2.63r0.75 4.38r0.75 1.80r1.10 0.1090
MAT-CONSUMPTION 3.25r0.74 2.88r1.70 3.88r0.63 1.90r1.34 0.0010 2–3, 3–4
CAP-CONSUMPTION 4.08r0.38 1.38r0.25 4.25r0.96 1.50r0.50 0.0001 1–2, 1–4, 2–3, 3–4
WIP-CONTROL 2.67r0.75 4.13r0.85 2.00r1.41 1.10r0.22 0.0020 2–3, 2–4
MAT-COMPUTERIZATION 2.70r0.48 3.56r0.84 4.00r0.12 1.64r0.60 0.0001 1–3, 1–4, 2–4, 3–4 CAP-COMPUTERIZATION 2.28r0.60 2.68r0.64 4.52r0.36 1.52r0.88 0.0001 1–3, 2–3, 3–4
ables. For example, Cluster 3, the computerized clus-ter, was found to differ more than all the other clusters, differing eleven times from the other clus-ters among the seven variables. Cluster 4, the simple cluster, was next most different, differing nine times. Not surprisingly, Cluster 1, the AcommonB cluster, differs the least from the other clusters, being signifi-cantly different only five times.
Cluster 4 was termed the ASimpleB cluster
be-cause it had the lowest scores on almost all the seven variables, only once slightly exceeding another
clus-Ž .
ter Cluster 2 on CAP-CONSUMPTION . Cluster 3
was termed theAComputerizationB cluster because it had the highest scores on both computerization vari-ables. As might be expected due to the demonstrated need for computerization, this cluster also scored high on both measures of requirements, as well as
consumption. Cluster 2 was termed the A
WIP-CON-TROLBcluster due to its exceedingly high score on
that variable whereas its other scores were close to those of the Simple cluster. Finally, Cluster 1 was termed theACommonBcluster due to its having more sites than any other cluster and scoring in the middle of all the variables.
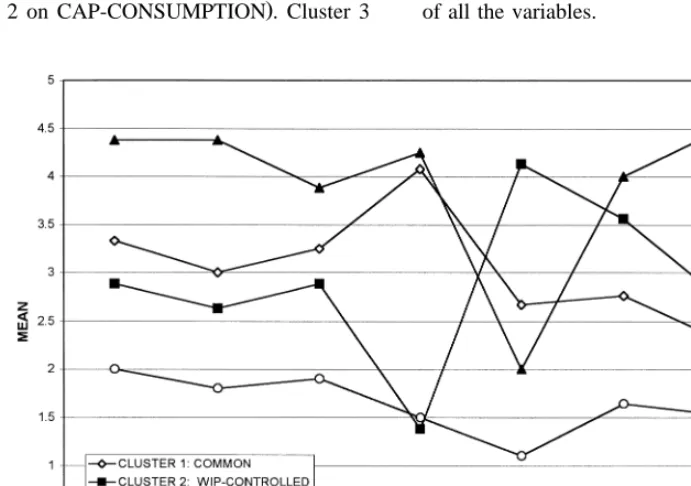
Given the difficulty of seeing the patterns in Table 5, the relative positions of the clusters are more clearly displayed in terms of the seven vari-ables in the graph of Fig. 3. Here, each cluster is plotted against the seven variables at the bottom. The figure more clearly illustrates the points made in the previous explanation such as the Simple cluster hav-ing the lowest scores, the WIP-Controlled cluster being substantially higher in WIP-CONTROL than the other clusters, and so on.
5.3. Validating the clusters
To validate the clusters, two methods suggested
Ž .
by Jobson Jobson, 1992, p. 564 were employed: validating the cluster results by conducting other forms of cluster analyses to see if they form the same clusters, and running a split-half cluster analy-sis to see if both halves form the same set of clusters. The two additional clustering analyses to validate Ward’s method were centroid heirarchical cluster analysis and average linkage cluster analysis. Both methods resulted in the same identical four clusters as Ward’s method. We also used Ward’s method to run the split-half analysis, both halves again resulted in the same four clusters.
In addition, the observations themselves tend to validate the clusters in the following sense. Three sets of variables in Table 5 have two items each that might be expected to run somewhat similarly within each cluster: material and capacity requirements, ma-terial and capacity consumption, and mama-terial and capacity computerization. Although these pairs need not be highly correlated within a cluster, it would be surprising if one variable of a pair was quite high while the other was quite low. As it happens, in all four clusters, all three pairs of variables tend to be near the same values and the same rank among the four clusters. For example, cluster 1 is ranked second on material requirements and also second on capac-ity requirements, it is ranked third on material com-puterization and also third on capacity computeriza-tion, and finally, it is ranked second on material consumption and second on capacity consumption. The same can be seen in Fig. 3 for the other clusters.
5.4. Interpretation of the clusters
The interpretation of the characteristics of each of the clusters is next described in more detail.
5.4.1. Cluster 1: common
The site members of this cluster are COLORS, COATINGS, ORGANICS, FEED-BLEND, MEATS, and PAINT. The means of the planning and control variables — MAT-REQUIREMENTS, MAT-CON-SUMPTION, CAP-REQUIREMENTS, CAP-CON-SUMPTION — all rank second indicating that this cluster is the second most detailed with respect to the generation of materials and capacity requirements and the tracking of materials and capacity consump-tion. The specific characteristics implied by the
Ž .
means of these four variables are: a a fixed interval reorder point method is used to generate raw mate-rial requirements; updates to records are made daily;
Ž .b material consumption is tracked by recording
standard consumptions with periodic actual
adjust-Ž .
ments; c the capacity requirements are generated
Ž .
by CPOF; and d actual labor hours andror
ma-chine hours are tracked for each product.
The mean score for the variable WIP-CONTROL also ranks second and suggests that WIP is tracked by physical observations supplemented with detailed shift notes. The computerization variables MAT-COMPUTERIZATION and CAP-COMPUTERIZA-TION both rank third and indicate that somewhat less than half of their materials and capacity control systems are computerized.
5.4.2. Cluster 2: WIP-controlled
The members of this cluster include: FLEXPAC-EXTRUDE, FLEXPAC-PRESS, BREW, and IN-DUST CLEAN. The means of the planning and control variables suggest the following
character-Ž .
istics: a raw material requirements are generated by the use of a fixed interval reorder point system with set minrmax inventory levels; material updates
oc-Ž
cur somewhere between weekly and daily less
fre-. Ž fre-.
quently than for cluster 1 ; b raw material con-sumption is tracked by a combination of physical inventories and standard consumption recording at
Ž .
the start of each batch; c the generation of capacity requirements falls between informal infinite load to use of capacity planning using overall factors
ŽCPOF ; and d the tracking of capacity consump-. Ž .
starts of batches are tracked and that some of the tracking is actually done by the processing equip-ment. The variables CAP-COMPUTERIZATION and MAT-COMPUTERIZATION rank second, with ma-terials control being somewhat over half computer-ized and capacity being somewhat less than half computerized.
5.4.3. Cluster 3: computerized
The members of Cluster 3 are PLASTIC, PHARM-LIQUIDS, PHARM-TABLETS, and ICE CREAM. All the planning and control variable means
— MAT-REQUIREMENTS,
MAT-CONSUMP-TION, CAP-REQUIREMENTS, CAP-CONSUMP-TION — for Cluster 3 rank first, implying that this cluster uses the greatest amount of detail for generat-ing materials and capacity requirements and trackgenerat-ing materials and capacity consumption. This amount of detail is obviously what generates the need for the high degree of computerization. The characteristics,
Ž .
as implied by the means, are: a raw material re-quirements are generated by a combination of meth-ods including some use of explosions for gross re-quirements, multiple-criteria ABC analysis, and fixed reorder point methods; materials are updated
fre-Ž . Ž .
quently almost real time ; b the actual consump-tion of raw materials is tracked at the compleconsump-tion of
Ž .
a batch; c capacity requirements are generated by
Ž .
finite loading using approximate values; and d
capacity consumption is tracked by recording actual labor hours and machine hours for each product. The mean for the WIP-CONTROL variable is exception-ally low and suggests that WIP is tracked very simplistically by the use of physical inspections, meetings, and shift notes. Both of the means for the computerization variables rank first, of course, and their control is highly computerized.
5.4.4. Cluster 4: simple
The members of Cluster 4 are RESINS, BEVER-AGES, FINISHES, BAKE, and FEED-YEAST. The planning and control variable means generally rank
Ž .
last and suggest the following: a the methods used for the generation of raw material requirements fall between knowing the steady flow usage and the occasional use of fixed interval reorder points with
Ž .
semi-weekly updates; b raw material consumption is tracked by a combination of taking weekly
physi-cal inventories and recording standard consumptions at the completion of a batch forAkeyBraw materials;
Ž .c capacity requirements are either known and fixed Ž .
or generated by using CPOF; and d the methods used to track the consumption of capacity are either
Ž
a combination of informal tracking e.g., meetings,
.
shiftnotes plus tracking of standard labor hours or are not tracked formally at all. The mean for the WIP-CONTROL variable also ranks last implying the WIP is tracked by walking the floors, making phone calls, or through informal discussions in pro-duction meetings. Understandably, this cluster also ranks last on both computerization variables.
5.5. Managerial interpretation of the four clusters
In managerial terms, these four basic types of P & IM systems generally make sense for process industries, although they cannot be confidently ex-trapolated beyond the industries investigated here. There is a Simple P & IM system for those process industries that are relatively straightforward and a Common system for those that are more normally demanding, especially in terms of their materials and capacity requirements and consumption. However, many firms that have the most complex and demand-ing production processes have turned to computer-ized technology to more precisely monitor and con-trol those processes; these more technologically sophisticated P & IM systems are thus called Com-puterized. However, there is yet another type of P & IM system that does not have especially high demands for generating and tracking the consump-tion of materials and capacity but very closely moni-tors WIP, usually through the processing equipment itself. Their goal is often to maintain short lead times; this P & IM system is thus called WIP-Con-trolled. As might be expected, the level of computer-ization of this system is relatively high.
clusters. For example, beverage P & IM systems have more in common with baking systems due to their
Ž
simplicity than they do with brewing close control
. Ž .
of WIP , ice cream computer controlled , or paints
Žcommon demands , all of which are liquids like.
beverages. Similarly, the P & IM system for paints is
Ž .
more like that for meats common demands than it
Ž .
is for other chemicals like finishes simple demands
Ž
or industrial cleaning chemicals close control of
.
WIP . What this means for the manager is that some analysis of the seven variables identified here is required to determine which P & IM systems would be best to benchmark, or what colleagues to talk to about similar problems in their production process. Based on this research, what might seem like an industry with a similar P & IM system may lead a manager into taking precisely the wrong actions.
6. Conclusion
As stated in the Introduction, the goal of our research here was to identify dimensions that could discriminate between process industry P & IM sys-tems, determine how these systems differ from one another, and identify major subgroups of such sys-tems and their characteristics. An essential step re-quired to accomplish this goal has been offered here: the detailed analysis and categorization of 19 process industry P & IM systems. The systems were shown to differ significantly on six of the seven identified variables: materials requirements, materials and ca-pacity consumption, WIP control, and degree of materials and capacity computerization. The catego-rization resulted in four distinct groups of P & IM
Ž . Ž . Ž .
systems: 1 common, 2 WIP-controlled, 3
com-Ž .
puterized, and 4 simple. Since these 19 sites exhib-ited four clearly understandable P & IM systems, they appear to be relatively generic to the process indus-tries, though we cannot confidently extrapolate be-yond our sample. A larger sample might, of course,
Ž
uncover more unexpected types similar to the largely
.
unexpected WIP-controlled cluster here but those identified here would probably surface also. For example, a AsimpleB cluster and a AcomputerizedB
cluster would certainly represent two expected ex-tremes. However, there may be more subclasses of
what we have identified here as the AcommonB
cluster. Future research should be directed toward testing the results of this study, extending the results with larger and more varied groups of sites, and eventually determining the AbestB P & IM system under various processing circumstances.
In addition to the categorization, this phase of the research provided other important insights, par-ticularly in the realm of existing theory. Some
Ž
researchers Bolander, 1981a,b, 1983; Taylor and
.
Bolander, 1991 have suggested that process
indus-Ž
tries need to focus primarily on capacity based on
.
the assumption that they tend to be capital intensive and that materials should be considered secondarily. In this sample, only 53% of the firms considered themselves to be capital intensive and only one site
ŽFEED-YEASTS considered maximizing the use of.
capacity to be a particularly important goal. Also, in this sample, the level of detail exercised for capacity planning and control was generally less than that required for materials planning and control. In fact, it was secondary to material control at most sites. Finally, an increased level of sophistication in capac-ity control was associated with an increased level of sophistication in materials control, implying that as materials are more closely controlled, so are capaci-ties. That is, as firms invest in their P & IM system, they tend to invest in both capacity and material control.
In general, dividing process industry P & IM sys-tems between material-dominated versus capacity-dominated, or time-phased versus rate-based, or even make-to-stock versus make-to-order versus assem-ble-to-order, as existing theories advocate, provides insufficient guidance for managers to identify P & IM systems similar to their own. As indicated above, selecting another plant that also has a rate-based
Ž .
system or capacity-dominated or make-to-stock may well result in selecting a system from a totally different cluster that is not at all comparable to one’s own. Thus, existing theory is not only insufficient; it may be wrong. That is, if you have a rate-based system and find another to compare yours to, it is not just that not all rate-based systems will be appropri-ate, the most appropriate comparison may well be to a time-based system.
that this understanding provide firms with an en-hanced ability to share P & IM system accomplish-ments with other similar types of process firms and foster additional study in this critical and largely under-researched area.
Acknowledgements
We would like to acknowledge the statistical help rendered us by Mark Weaver and Clinton Dart, and the SAS data analysis by Alex Wilson.
References
Abraham, C., Dietrich, B., Graves, G.W., Maxwell, W.L., Yano, C., 1985. Discrete Manufacturing Taxonomy, working docu-ment. IBM Research, Yorktown Heights, NY.
Adelberg, A.H., 1984. An improved analysis of production-mix variances. Production and Inventory Management Journal 25
Ž .4 , 35–41.
Aiello, J.L., 1982. Production cost measurement and control in the process industry. APICS 25th Annual International Conference Proceedings, Falls Church, VA. pp. 542–544.
Allen, R.L., 1980. The applicability of standard manufacturing software to primary metals processing. APICS 23rd Annual Conference Proceedings, Falls Church, VA. pp. 85–89. Allen, S.J., Schuster, E.W., 1994. Practical production scheduling
with capacity constraints and dynamic demand: family plan-ning and disaggregation. Production and Inventory
Manage-Ž .
ment Journal 35 4 , 15–21.
Anderberg, M.R., 1973. Cluster Analysis for Application. Aca-demic Press, NY.
Armstrong, J.S., Overton, T.S., 1977. Estimating non-response bias in mail surveys. Journal of Marketing Research 4, 362– 402.
Baumeister, W., 1997. Building an infrastructure. Manufacturing
Ž .
Systems 15 1 , 34–36.
Bolander, S.F., 1981a. Capacity planning through forward scheduling. APICS Process Industry Seminar Proceedings, Falls Church, VA. pp. 73–79.
Bolander, S.F., 1981b. Capacity planning with TPFS. APICS 24th Annual International Conference Proceedings, Falls Church, VA. pp. 207–209.
Bolander, S.F., 1983. Time-phased forward scheduling: a capacity dominated scheduling technique. Production and Inventory
Ž .
Management Journal 24 1 , 83–97.
Bolander, S.F., Taylor, S.G., 1993. System framework for process flow industries. Production and Inventory Management
Jour-Ž .
nal 34 4 , 12–17.
Bolander, S.F., Taylor, S.G., 1990. Process flow scheduling: mixed-flow cases. Production and Inventory Management
Ž .
Journal 31 4 , 1–6.
Boyer, K.K., Ward, P.T., Leong, G.K. Approaches to the factory of the future: an empirical taxonomy. Journal of Operations Management, Vol. 14, No. 4, 297–314.
Boyer, K.K., Leong, G.K., Ward, P.T., Krajewski, L.J. Unlocking the potential of advanced manufacturing technologies. Journal of Operations Management, Vol. 15, No. 4, 331–348. Clark, F.T., 1983. Sperry and the process industry. APICS Process
Industries Seminar Proceedings, Falls Church, VA. pp. 50–63. Cohen, R.L., 1980. Production and inventory control in the pro-cess industry. APICS 23rd Annual Conference Proceedings, Falls Church, VA. pp. 153–154.
Cokins, G.M., 1988. Control systems for process industries. Man-ufacturing Systems, 79–83, May.
Covey, R.E., 1984. MRP for process manufacturers. Production
Ž .
and Inventory Management Review and APICS News 4 3 , 44–48.
Crow, D.A., 1992. Process industries need a new generation of system solutions. APICS — The Performance Advantage 2
Ž .4 , 29–32.
Daniels, V.L., 1983. The lot sizing and sequencing problem in the process industries. Ph.D. dissertation. Ohio State University, Columbus, OH.
Dayvolt, B.H., Symonds, F.P., 1994. Automate batching in a
Ž .
multi-product facility. Chemical Engineering 10 7 , 151. Dennis, D.R., 1993. Defining Production and Inventory
Manage-ment Systems for Process Industries. Ph.D. dissertation. Uni-versity of Cincinnati, Cincinnati, OH.
Dibono, P., 1997. Flow manufacturing improves efficiency and customer responsiveness. IIE Solutions, 25–29, March. Dietrich, B.L., 1987. A Taxonomy of Discrete Manufacturing
Systems. Manufacturing Research. IBM Watson Research, Yorktown Heights, NY, pp. 1–15.
Doganaksoy, N., Hahn, G.J., 1996. Evaluating the potential im-pact of blending on product consistency. Journal of Quality
Ž .
Technology 28 1 , 51–60.
Duncan, R.M., 1981. The by-product bill of material. APICS 26th Annual International Conference Proceedings, Falls Church, VA. pp. 288–292.
Eads, G., 1989. Manufacturing systems for the process and repeti-tive industry. Production and Inventory Management Review and APICS News, Vol. 9, No. 2, 32, 34.
Eads, G., Undheim, H., 1984. Inventory control with lot traceabil-ity and qualtraceabil-ity assurance. Readings in Production & Inventory Control and Planning. APICS 27th Annual International Con-ference, Falls Church, VA. pp. 57–61.
Everitt, B.S., 1979. Unresolved problems in cluster analysis. Biometrics 35, 169–181.
Everitt, B.S., 1980. Cluster Analysis. 2nd edn. Heineman Educa-tional Books, London.
Finch, B.J., 1986. Production planning and control for process manufacturing. Ph.D. dissertation. University of Georgia, Athens, GA.
and control: factors that influence system design. Academy of
Ž .
Management Journal 31 1 , 123–153.
Fransoo, J.C., 1992. Demand management and production control in process industries. International Journal of Operations and
Ž .
Production Management 12 7 , 187–196.
Fransoo, J.C., Rutten, W.G.M.M., 1994. A topology of production control situations in process industries. International Journal of
Ž .
Operations and Production Management 14 12 , 47–57. Gerchak, Y., Tripathy, A., Wang, K., 1996. Co-production models
with random functionality yields. IIE Transactions 28, 391– 403.
Green, P.E., 1978. Analyzing Multivariate Data. Dryden Press, Hinsdale, IL.
Haxthausen, N., 1995. The painkiller for batch control headaches.
Ž .
Chemical Engineering 2 10 , 118–124.
Hubbard, D.T., Taylor, S.G., Bolander, S.F., 1992. Process flow scheduling in a high-volume repetitive manufacturing
environ-Ž .
ment. Production and Inventory Management Journal 33 4 , 21–26.
Jobson, J.D., 1992. Applied Multivariate Data Analysis. Springer-Verlag, NY.
Katayama, H., 1996. On a two-stage hierarchical production plan-ning system for process industries. International Journal of
Ž .
Production Economics 44 1 , 63–72.
Landel, R.D., 1982. Taking the pulse of a business: a plant-tour guide for assessing management effectiveness. Operations Management Review, 44–48.
McKaskill, T., 1992. Applying the process production model to discrete manufacturing. Manufacturing Systems, 70–72, Octo-ber.
Meredith, J.R., Raturi, A., Amoako-Gyampah, K., Kaplan, B., 1989. Alternative research paradigms for operations. Journal of Operations Management 8, 297–326.
Nelson, N.S., 1983. MRP and inventory and production control in process industries. Production and Inventory Management 24
Ž .4 , 23–32.
Nichols, W.E., Ricketts, J.D., 1994. Identification, tracking,
con-Ž .
trol key to minimizing mill liquor loss. Pulp and Paper 68 3 , 111–121.
Novitsky, M.P., 1983. Process industries — where are you?
Ž .
Production and Inventory Management Journal 24 1 , 118– 121.
Parker, K., 1997. A configurator for process industries.
Manufac-Ž .
turing Systems 5 9 , 30–32.
Plossl, G.W., Wight, O.W., 1967. Production and inventory
con-trol, Principles and Techniques. Prentice-Hall, Englewood Cliffs, NJ.
Rice, J.W., Norback, J.P., 1987. Process industries production planning using matrix data structures. Production and
Inven-Ž .
tory Management Journal 28 2 , 15–23.
Robinson, W.E., Taylor, S.G., 1986. Alternatives for planning and scheduling production: matching tools and tasks. Working paper.
Rutten, W.G.M., 1993. Hierarchical mathematical programming for operational planning in a process industry. European
Jour-Ž .
nal of Operational Research 64 3 , 363–369. SAS Institute, 1988. Statistical Analysis System. Cary, NC. Shelley, S., 1995. On-line device automates conductivity
measure-Ž .
ments. Chemical Engineering 2 3 , 151.
Swann, D., 1984. MIS for process industries. Production and
Ž .
Inventory Management Review and APICS News 4 6 , 65–70. Taylor, S., 1979. Production and inventory management in the process industries: a state of the art survey. Production and
Ž .
Inventory Management 20 1 , 1–16.
Taylor, S., Bolander, S., 1990. Process flow scheduling: basic
Ž .
cases Part 1 . Production and Inventory Management Journal
Ž .
31 3 , 1–4.
Taylor, S., Bolander, S., 1991. Process flow scheduling principles.
Ž .
Production and Inventory Management Journal 32 1 , 67–71. Taylor, S., Bolander, S., 1993. Process flow scheduling
calcula-Ž .
tions. Production and Inventory Management Journal 34 1 , 58–64.
Taylor, S., Bolander, S., 1995. A framework for flow
manufactur-Ž .
ing scheduling systems. Industrial Management 37 6 , 1–4. Taylor, S., Bolander, S., 1997. Process flow scheduling: past,
present, and future. Production and Inventory Management
Ž .
Journal 38 2 , 21–25.
Thompson, O., 1991. Manufacturing in the process industries. Production and Inventory Management and APICS News 11
Ž .2 , 38–39.
Tiber, J.S., 1981. Use of the dynamic bill in process industries. APICS Process Industries Seminar Proceedings, Falls Church, VA.
Vollman, T.E., Berry, W.L., Whybark, D.C., 1997. Manufacturing Planning and Control Systems. IrwinrMcGraw Hill, Burr Ridge, IL, pp. 4–7.
Ž .
Wallace, T.F. Ed. , APICS Dictionary. 7th edn. American Pro-duction and Inventory Control Society, Falls Church, VA. Ward, J.H. Jr., Jennings, E., 1973. Introduction to Linear Models.