www.elsevier.nlrlocatereconbase
A note on eliciting distributive preferences for
health
Jan Abel Olsen
)Institute of Community Medicine, UniÕersity of Tromsø, 9037 Tromsø, Norway
( )
Health Economics Research Programme at the UniÕersity of Oslo HERO , Norway
Received 8 September 1998; received in revised form 28 July 1999; accepted 7 December 1999
Abstract
While in theory the strength of preferences for equity in health can be expressed in an ‘inequality aversion parameter’, in practice, analysts would have to obtain them from people’s choices. We are faced with a number of methodological problems when turning to this type of empirical research. This note investigates which types of preference could explain the choices people make when responding to equity-efficiency questions of this kind. Respondents may be heavily influenced by concerns that are not related to their equity preferences, something which may lead them to choose distributions that are not consistent with models on the equity-efficiency trade-off. Specifically, a threshold effect is identified, which could explain why some people would rather prefer to concentrate than to diffuse health gains. The second aim of this note is to offer some lessons from a survey which was designed for eliciting people’s distributive preferences for health gains.q2000
Elsevier Science B.V. All rights reserved.
Keywords: Health care programmes; Distributive preferences; Welfare function
1. Introduction
The types of cost-effectiveness analyses used in economic evaluations of health care programmes ignore differences in the distribution of total health gains across
)Tel.:q47-77-64-4832; fax:q47-77-64-4831.
Ž .
E-mail address: [email protected] J.A. Olsen .
0167-6296r00r$ - see front matterq2000 Elsevier Science B.V. All rights reserved.
Ž .
patients when comparing programmes, i.e., whether the gains are distributed with a little to each of the many or with much to each of a few. Acknowledging that this does not correspond with an important aspect of equity in health, Wagstaff
Ž1991 applied a social welfare function, to illustrate a possible trade-off between.
the maximization of the sum of health and its distribution. He suggested that the strength of preferences for equity could be expressed in an ‘inequality aversion parameter’. Following Wagstaff’s contribution, there are more recent theoretical
Ž
papers in this journal on QALYs and the equity-efficiency trade-off see, e.g.,
.
Culyer and Wagstaff, 1993; Clark, 1995; Olsen, 1997; Dolan, 1998 .
However, while in theory preferences can be elegantly expressed within a formula, in practice, analysts would have to obtain them from peoples’ choices. So, if these trade-offs are to be taken into account in economic evaluations, we are faced with a considerable methodological problem — that of how to elicit distributive preferences in order to adjust the social value of health gains.
The aims of this note are; first, to explore which types of preferences could explain choices of this kind. This is important as the answers may be heavily influenced by concerns not related to one’s equity preferences, and hence lead respondents to choosing distributions which are not consistent with models on the equity-efficiency trade-off. Specifically, a threshold effect is identified, which could explain why some people would rather prefer to concentrate than to diffuse health gains. The second aim is to offer some lessons from a survey that was designed for eliciting peoples’ distributive preferences for health gains.
2. Theoretical background
We shall distinguish between which distributive preference a respondent
re-Õeals in a choice and which underlying preferences could explain this choice.
2.1. Three ‘ preference camps’
Ž .
In cost-utility analyses, two programmes with identical costs are considered to be equally good, i.e., their socialÕalues are identical, if the total sum of QALYs
are the same:
Õ
Ž
Pq.
sÕŽ
pQ , when Pq.
spQ.Ž .
1Ž .
p and P refer to numbers of persons P)p , while q and Q refer to number of
1 Ž .
QALYs gained per person. Those who subscribe to Eq. 1 will be referred to as
1
Ž .
being distributiÕe neutral Olsen, 1997 . In other words, they are maximizers
since the only thing that should matter is to have the largest possible health gains. The equity-efficiency trade-off, however, implies a preference for distributing a given total QALY-sum with a small gain to each of many rather than a large gain
Ž .
to each of a few. Thus, the equality sign of Eq. 1 is substituted by an inequality sign in:
Õ
Ž
Pq.
)ÕŽ
pQ , when Pq.
spQ and P)p.Ž .
2Ž .
Those who support Eq. 2 will be referred to as diffusors, because of their preference for spreading the gains over the many. While they would seem to reveal a preference for equity, their ‘pure’ equity preferences do not have to be
Ž .
any stronger than among those in the other camps see Section 2.2 .
Ž .
The inequality sign in Eq. 2 could, however, take the reverse direction. Elitists may hold such preferences, but there is a different argument in support of this seemingly counter-intuitive distributive preference: If the q represents a very small gain, there may be a preference for substantial improvements for the few
rather than insignificant improvements for the many.2 Those who reveal such
distributional preferences will be referred to as the concentrators.
The methodological challenge, then, becomes that of finding combinations of
P, p, Q and q, which satisfies:
Õ
Ž
Pq.
sÕŽ
pQ , when q.
-Q and PGp.Ž .
3The issue is essentially a simple and basic welfare economic one of finding two combinations of two goods to which the respondent is indifferent. In this case, the
Ž . 3
two normal goods are number of persons benefiting and QALYs gained. Thus, when responding to a choice of this kind, in principle people would put themselves in either of three camps: maximizers who care only about the size of the total health effects; diffusors who would go for the larger number of persons; and concentrators who would rather have a large effect for each beneficiary. In practice, however, respondents do not put themselves in one of these camps based on their distributive preferences only. Rather, they end up in one camp or another after having been influenced by other preferences than those related to their concern for equity. These other preferences are discussed briefly below.
2.2. Four types of underlying preferences
When a respondent chooses between a small benefit for the many and a large benefit for the few, this choice may reflect the aggregate of possibly four distinctly
2
This is analogous to a situation on the value of time-savings, e.g., 10 s saved by each of 600 people may be valued less than 10 min saved by each of 10 people, although the total time-savings are the same.
3
The approach bears a strong resemblance to work undertaken by Erik Nord, who introduced the
Ž .
person-trade-off ‘PTO’ label to the approach of eliciting implicit social values from comparisons of
Ž .
different types of preferences, only one of which concerns ‘pure’ equity prefer-ences. This preference for a more equitable distribution implies that the pro-gramme benefiting most patients is preferred. The first of the three contaminating effects would accentuate this choice: PositiÕe time preferences suggest that the
programme with the shortest duration is preferred, since the present value of the health experienced over the longer time period is reduced by relatively more.
However, if the smaller health gain to each of the many is considered to be too small for each recipient to be able to appreciate it, one may rather choose to concentrate the health gains on some few. There might, in other words, be a minimum threshold quantity that is required before the gains are considered worth to diffuse. If less than this threshold, the programme benefiting least patients would be preferred. While time preferences and equity preferences may have a fairly continuos form, we believe that the threshold effect is more discrete: a given minimum of health gain is required before one’s time and equity preferences take effect. Of course, the threshold quantity does not refer to an absolute value
Ž .
independent of the comparator. It depends on how small the smaller gain q is
Ž .
relative to the larger gain Q . When relative differences are small equity concerns may dominate in that the differences are considered too small to justify any discrimination between the groups.
A possible additional effect is risk aÕersion. The welfare gain from insurance is
greater when reducing a small probability of a large potential loss than reducing a large probability of a tiny loss. Thus, if respondents also think which programme they would prefer for themselves, and they are risk averse, there is a further argument for expecting them to prefer the programme with the larger effect.
To sum up, according to the health economics literature on equity-efficiency, it is generally assumed that people have non-neutral distributive preferences, and that these point in the egalitarian direction. We have suggested, though, that while two types of preferences point in this direction, there are two other types which point in the reverse direction, i.e., towards concentrating health gains. Therefore,
Ž
those who reveal distributive neutrality would be at the point where two normally
.
assumed positive effects have been exactly out-weighed by two negative effects. And those who reveal a preference for concentration would still be at a point
Ž .
where they consider the threshold effect and possibly risk aversion to more than out-weigh their time and equity preferences.
3. From theory to practice
3.1. AlternatiÕe formulations of quantities of health
different magnitudes of this good to deal with different quantities of health, i.e., that the units in question have identical physicalÕalues. There are essentially four
ways of presenting differences in quantities of health, i.e., the values to be inserted
Ž . Ž . Ž . Ž .
as q and Q in Eq. 3 . These are: 1 life years, 2 QALYs, 3 units on a cardinal
Ž .
health state utility scale, and, 4 years with a given health improvement. Unfortu-nately, each way of describing differences in health gains have their problems.
3.1.1. Life years
When different quantities of health gains are expressed in terms of differences in life years gained, respondents are led to believe that the actual groups of people are of different ages and hence implicitly take account of life stages. There is increasing evidence that people attach different values to different life stages, implying that the value of the life years gained would differ.
3.1.2. QALYs
The problem with using QALYs is that respondents would then have to be given a lengthy introductory explanation of the meaning of this concept, which is impossible in a self-administered questionnaire.4 Hence, we are left with express-ing differences in health gains along one of the two key dimensions of QALYs; health state increments or durations.
3.1.3. Increments on a cardinal health state utility scale
Not only may respondents have problems in relating to what the values on the cardinal scale mean in health terms, but they might attach different subjective
Ž .
utility weights to the identical intervals on the health scale see also Dolan, 1998 . They might not understand or accept that a health state improvement from, e.g., 0.3 to 0.6 implies three times as much health as an improvement from 0.3 to 0.4. I believe respondents more easily accept that 3 years with a given health improve-ment implies three times as much health as one year with the same improveimprove-ment.
3.1.4. Years with a giÕen health improÕement
While this looks like the best of the four alternatives, still, it has many problems, some of which are discussed below. It is my experience from a number of small scale pilot surveys that the important property of respondents perceiving the units in question to have identical physicalÕalues is better secured when using
years with a given health improvement than when using increments on a cardinal health state utility scale.
Ž . Ž .
In Eqs. 1 – 3 , we will define the q and Q as representing products of the two
Ž
QALY-dimensions duration and health state: qstDHS and QsTDHS where t
and T indicate durations with improved health, and DHS indicates a given
4
. Ž .
increment in health state . If we make the assumption that Õ DHS is time
5 Ž .
independent, then Eq. 3 could be changed to:
Õ
Ž
Pt.
sÕŽ
pT , when t.
-T and PGp.Ž .
4The issue is that of having respondents choose a value for p, when P, t and T are given.
3.2. Empirical testing
Ž
A pilot study, which had used ts2 and 5 years in each of two samples both
.
compared with Ts20 suggested a weak tendency for more concentrators when
Ž .
ts2 Olsen and Heiberg, 1996 . This lead us to believe that a threshold — if it existed — would lie somewhere below this time horizon. In the survey reported from here, we therefore added ts1 for a third sub-sample.
The null hypothesis is that the proportion of concentrators relative to diffusors is higher when the small health gain is below a critical value, most likely when
ts1. The survey also aimed at exploring whether lay persons were capable of responding to choices of this kind in a postal questionnaire.
Ž .
Respondents were taken through the exercise in two steps see Appendix . First, there was an ordinal question between two programmes, X and Y, yielding
Ž .
the same total health gains; PtspT. There were four options; X diffusors , Y Žconcentrators , X or Y are equally good maximizers , and Don’t know. Subjects. Ž .
who stated a clear preference for either of the two programmes had a second question which asked to circle their indifference value, p , that would make themi consider the programmes to be equally good. P and T were given the same values in all three samples; 100 persons and 20 years. Again, t was varied in the samples with values of 1, 2 and 5 years. The listed p -values included two values less thani
p, three values between p and P, and one equal to P. Consistency requires pi)p
only for those who had chosen X in the preceding question, and pi-p only for
those who had chosen Y.
Ž
Two omnibus samples of in total 2089 which are supposed to be representative
.
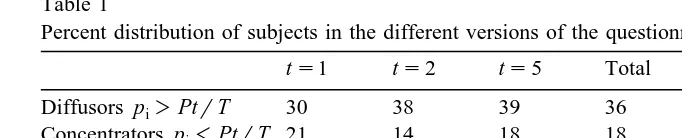
of the Norwegian adult population were asked to take part in a survey which dealt with some issues related to priority setting in health care. 51.5% said they were positive to fill out a questionnaire which would be sent to them. After a reminder, 716 handed in the questionnaire, giving a response rate of 34.3% from the original sample. Table 1 shows the distribution of respondents within each sub-sample
Žts1, ts2, ts5 and the total sample Total . The table also gives the number. Ž .
of respondents who actually filled out the subsequent question on indifference
5
Admittedly, the assumption that the utility of the health state is independent of its duration is a strong one, but for many practical purposes, it is still acceptable, see, e.g. the recent discussion on
Ž . Ž .
Table 1
Percent distribution of subjects in the different versions of the questionnaire
ts1 ts2 ts5 Total Indifference Inconsistent
Diffusors pi)PtrT 30 38 39 36 94% of 258 1% of 242
Concentrators pi-PtrT 21 14 18 18 68% of 126 69% of 86
Maximizers pisPtrT 38 38 37 38
Don’t know 10 9 6 9
N 100% 231 100% 258 100% 227 100% 716
Ž . Ž
value Indifference , and how many of these who answered inconsistently
Incon-.
sistent . Inconsistent were those who gave a pi-p if having chosen X in the
preceding question, or they gave a pi)p if having chosen Y .
3.2.1. Lowering the t-Õalue
Among those who gave a clear preference for either of the two programmes
Ždiffusors chose X, concentrators chose Y , there was a clear majority within all.
three samples in favour of a more equal distribution. The proportions of
concentra-Ž .
tors as compared with diffusors were 0.7 21%r30% when ts1, it was 0.37
when ts2, and 0.46 when ts5. When ts1, there were significantly less
diffusors and significantly more concentrators as compared with the two samples of ts2 or 5. This leans support to the hypothesis that a threshold value may exist, and that it lies somewhere around ts1 when Ts20.
3.2.2. Concentrators appear to be inconsistent
The majority of those who expressed a preference for concentration answered inconsistently. First, only 68% answered the follow-up question of stating their indifference number, and 69% of those who actually answered this question gave
Ž .
an inconsistent answer. In other words, only 21% 27 out of 126 gave consistent answers, whereas 93% among diffusors were able to give consistent answers.
The concentrators found the choice context much more difficult to answer than the other groups of respondents,6and it seems that the follow-up question is what caused their problems. First, it was only for diffusors and concentrators to fill out, and secondly — when in doubt — the larger of the listed values appear more attractive. When choosing one of these listed values, the diffusors were consistent, while the concentrators became inconsistent.
6
3.2.3. Maximizers don’t know?
Within each sub-sample, the median value of pisPtrT implies that the
Ž .
‘social weight rate’ Olsen, 1994 is 1, i.e., that there is a constant social value to each additional QALY gained by each person. However, one should be cautious to interpret this to be the finding of the survey. Interestingly, the fraction of respondents who are implied to be maximizers is much the same across
sub-sam-Ž .
ples 37–38% . Bearing in mind the text related to this option in the questionnaire;
X or Y are equally good, it might have appeared as a substitute to stating Don’t know among those who did not hold a clear view. Some socio-demographic
variables support the idea that respondents may have interpreted the option X or Y
are equally good as a ‘no-choice alternative’ to Don’t know. Those who answered Don’t know are more similar to the maximizers than to any of the other groups.
When partial comparisons of mean values for the variables gender, education and income gave no significant differences between diffusors vs. concentrators, nor between maximizers vs. Don’t know, the first two groups were collapsed into one
Ž‘the prioritisers’ and compared with the no-choice groups. The p-values for.
differences between the collapsed groups were: 0.004 for gender, 0.018 for education, and 0.174 for income. While this may suggest that maximizers in fact do not know, more empirical research is needed on this very important psychomet-ric issue.
4. Conclusions with some lessons
This paper can be seen as an attempt to take the cumbersome route from intuition and theory via methodology to measurement and interpretation. If distributive preferences are to be taken into account in economic evaluations, we need to go beyond the concept of an ‘inequality aversion parameter’. The methodology for measuring distributive preferences for health is still at an infant
Ž .
stage. Dolan 1998 has suggested a social welfare function in which preferences
Ž .
may have a Cobb–Douglas form. Olsen 1994 suggested a method for estimating implicit equity weights based on trade-offs between numbers of persons and numbers of years with improved health. This paper has sought to inquire into some problems with eliciting the numbers that are to be fed into such functions.
of a minimum threshold level for health gains, below which, they would rather concentrate the gains on some few, and lastly, they may think about their own probabilities of ending up in the patient groups.
It is hard to know which preferences are predominant. An inquiry into the underlying preferences suggested that time preferences and equity preferences would take respondents in the expected directions. However, if the smaller gain is below the threshold, or they are risk averse, this may take them in the reverse direction, i.e., they may prefer to concentrate the health gains on some few. The study referred to in this paper challenges the conventional wisdom in the literature that there is a universal preference towards a more equal distribution of health gains than the health maximising one. The results indicated that a minimum
Ž .
threshold of benefit may exist see also Dolan and Cookson, 2000 .
The constant proportion of subjects in the three sub-samples who opted for the alternative X or Y are equally good, as well as some socio-demographic similari-ties with the Don’t know-group suggest that researchers in this field should be cautious to interpret ‘equally good’-options as reflecting well-considered indiffer-ence values. More research is needed on the idea that subjects may interpret the equally good-option as a close substitute to stating ‘don’t know’. The most important empirical lesson to learn from the survey reported here is probably that equity-efficiency trade-offs of this kind are cognitively too difficult for postal questionnaires.
Acknowledgements
I am indebted to Paul Dolan for stimulating discussions and his detailed comments on earlier drafts. I would also like to thank Jeff Richardson and two anonymous referees for helpful comments and suggestions. Financial support from the Norwegian Research Council is acknowledged.
Appendix A
Ž .
The full text as presented to respondent Version ts1 . Different durations of health gains
When comparing different health care programmes, one would wish to take into account both the magnitude of people’s total health gains, and how these gains are being distributed between people. The total health gains can be expressed as the number of years with improved health that people get in total.
Ž
Imagine two diseases which involve the same misery reduced functioning and
.
treatments which give complete relief. An extra funding involves two options, each of which would yield the same total health gains.
Programme X: 100 persons would have relief for 1 year each. Programme Y: 5 persons would have relief for 20 years each.
None of the treatments affect the life expectancies. Imagine that you have the same probabilities as everyone else to get the diseases.
On which of the two programmes would you prefer to spend the additional funding?
Put a cross in one of the below alternatives
IProgramme X
IProgramme Y
II consider increased funding to X or Y as equally good.
IDon’t know
If you answered alternatives 1 or 2:
How many persons do you think would have to get relief for 20 years in order for you to consider it equally good to spend the money on programme Y?
Put a cross in one of the below alternatives
I2 I4 I10 I30 I60 I100
References
Clark, D., 1995. Priority setting in health care: an axiomatic bargaining approach. J. Health Econ. 14, 345–360.
Culyer, A.J., Wagstaff, A., 1993. Equity and equality in health and health care. J. Health Econ. 12, 431–457.
Dolan, P., 1998. The measurement of individual utility and social welfare. J. Health Econ. 17, 39–52. Dolan, P., Cookson, R., 2000. A qualitative study of the extent to which health gain matters when
choosing between groups of patients. Health Policy, in preparation.
Nord, E., 1992. Methods for quality adjustment of life years. Soc. Sci. Med. 34, 59–69.
Olsen, J.A., 1994. Persons vs years: two ways of eliciting implicit weights. Health Econ. 3, 39–46. Olsen, J.A., 1997. Theories of justice and their implications for priority setting in health care. J. Health
Econ. 16, 625–640.