Jordan D. Matsudaira is an assistant professor in the Department of Policy Analysis and Management at Cornell University. He thanks Damon Clark, Heather Royer, and seminar participants at RAND for helpful comments. He is grateful for grants from the Cornell Population Program and the National Science Foun-dation (SES- 0850606), and to the Robert Wood Johnson FounFoun-dation’s Scholar in Health Policy Program for supporting the early stages of this work. Margaret Jones provided excellent research assistance. The data used in this article can be obtained beginning August 2014 through July 2017 from the author at jdm296@cornell .edu.
[Submitted August 2011; accepted December 2012]
ISSN 0022- 166X E- ISSN 1548- 8004 © 2014 by the Board of Regents of the University of Wisconsin System
T H E J O U R N A L O F H U M A N R E S O U R C E S • 49 • 1
Government Regulation and the
Quality of Healthcare
Evidence from Minimum Staf
fi
ng
Legislation for Nursing Homes
Jordan D. Matsudaira
A B S T R A C T
This paper investigates the effect of a regulation mandating a minimum nurse- staffi ng level on the quality of healthcare in nursing homes. To comply with the regulation, fi rms increase employment of nurses in proportion to the gap between their initial staffi ng level and the legislated minimum threshold. If higher nurse staffi ng causes better quality, then the changes in quality outcomes should mirror these changes. Despite inducing increases in nurse aide hours of 10 percent on average and up to 30 percent for some fi rms, I fi nd no impact of the regulation on patient outcomes or overall facility quality.
I. Introduction
staff-Matsudaira 33
ing legislation for hospitals beginning in 2004, and as of early 2008 13 other states were considering such legislation (Thrall 2008). Staffi ng standards for nursing homes have existed since the early 1980s, but they are perceived to be too lenient and many states have increased their staffi ng standards in the last ten years (Park and Stearns 2009). Meanwhile, calls for more aggressive national standards have intensifi ed (NAP 2004).
At least since Arrow (1963), economists have recognized that government involve-ment in the medical care industry might be desirable to overcome market failures stemming from imperfect and asymmetric information. For example, in a model similar to Akerlof’s (1970) market for lemons, Leland (1979) shows that minimum quality standards (licensing requirements for physicians in his context) can improve welfare by preventing low quality providers from driving out high quality ones. Regu-lation carries its own hazards, however, including the possibility that rent- seeking through the political process may result in a quality standard set ineffi ciently high (or low). Moreover, since it is diffi cult to regulate the quality of medical care through its outcomes, policymakers are left to prescribe limits on the inputs of a complex and poorly understood production function. For both reasons, there is a risk that regula-tion may increase healthcare costs without generating commensurate improvements in health.
Calls to raise minimum nurse staffi ng ratios have been motivated by a number of studies showing cross- sectional links between higher nurse to patient ratios and bet-ter patient outcomes across healthcare facilities (Aiken, Clarke, Sloane, Sochalski, and Silber 2002; Needleman, Buerhaus, Mattke, Stewart, and Zelevinsky 2002; Har-rington, Zimmerman, Karon, Robinson, and Beutel 2000). Standard concerns about omitted variables and patient sorting based on unobserved patient acuity suggest, however, that these correlations may not refl ect a causal relationship (Dobkin 2003). Recent studies by Evans and Kim (2006) and Dobkin (2003) better isolate exogenous variation in nurse staffi ng levels and fi nd little evidence of a causal effect of nurse staffi ng on patient outcomes. But the variation they isolate is temporary—due, for example, to (unexpectedly high) admissions shocks over a weekend—and therefore may not identify the effect of a permanent increase in nurse staffi ng that would be the goal of government intervention.
This study directly assesses the case for minimum nurse- to- patient ratios by evalu-ating the impact of an actual instance of such legislation on patient health and quality of care outcomes. In 2000, the California legislature enacted a large increase in mini-mum nurse staffi ng standards for long- term care facilities (nursing homes), requiring that all facilities employ at least 3.2 hours of direct care nurse labor for each resident, every day (HPRD, for “hours per resident- day”). While an older staffi ng law had been in place, the new standard was aggressive: Nearly 70 percent of all facilities had staff-ing levels below 3.2 HPRD in 1999 with an average staffi ng level of fi rms below the threshold of about 2.7 HPRD.1
This setting lends itself to a transparent research design for estimating the impact
The Journal of Human Resources 34
of minimum staffi ng legislation on patient outcomes, providing arguably the clean-est evidence to date. If facilities mechanically comply with the law, then we would expect changes in staffi ng to mirror the gap between their staffi ng levels before the law passed and the mandated threshold of 3.2. That is, the fi rms with the lowest initial staffi ng levels should increase their nurse employment the most and fi rms with staffi ng levels already above 3.2 should increase staffi ng levels little, if at all. To the extent that nurse- staffi ng levels positively affect patient and quality of care outcomes, then changes in these outcomes across facilities should mirror the staffi ng trends. Firms with low initial staffi ng levels should see large improvements in these outcomes, and
fi rms already above the threshold should see little to no change. Causal inference relies on assuming that in the absence of the legislation, fi rms with different initial staffi ng levels would have had similar trends in staffi ng and quality of care outcomes. The similarity of trends in the years leading up to passage of the law suggests this assump-tion is supported by the data available.
Two points about what effects are identifi ed in the analysis below are worth empha-sizing up front. While the research design identifi es the effect of the law on quality of care, making inferences about the structural parameters of a patient health production function—for example, the marginal effects of particular types of nurse labor on pa-tient health—rests on exclusion restrictions that are hard to verify. Many inputs into the quality production function might be affected by the law, including each of the dif-ferent types of nursing staff, but also other inputs such as materials (use of restraints or catheters, for example), treatment protocols, and so on. With only one instrument (the pressure to raise staffi ng produced by the law), we cannot hope to isolate the effects of each of these inputs. I use the data to shed light on which mechanisms might be most important in effecting observed changes in quality of care, but the possibility remains that changes in unobserved inputs are part of the story. Relatedly, the effects estimated below are identifi ed from fi rms whose nurse staffi ng levels are initially low. This is arguably a more policy- relevant parameter than an average treatment effect because public policies are clearly targeting nursing homes with low staffi ng levels rather than increases in staffi ng in fi rms with already high staffi ng levels. Regardless, the results may not generalize to facilities with higher staffi ng levels.
I fi nd that the law was quite effective in increasing staffi ng levels among facilities initially out of compliance with the law. Firms complied with the law primarily by increasing their employment of nurse aides, who provide primarily custodial care and earn the lowest wages of various nurse occupations, by an average of about 10 percent for fi rms initially out of compliance. Facilities with the lowest levels of staffi ng had legislation induced increases in nurse aide employment of over 20 percent. In contrast, I fi nd no evidence of a correlation between initial staffi ng levels and changes in patient and quality of care outcomes. Overall, the results cast doubt on the supposition that mandated increases in staffi ng levels for facilities with low initial levels will improve quality of care. Moreover, total costs rose by an average of 4 percent among affected
Matsudaira 35
a descriptive overview of nurses and nursing homes in California. The results are presented in Section V, and the fi nal Section concludes.
II. Background
Despite the interest in this topic, few studies have employed research designs that can credibly estimate the effect of a permanent staffi ng increase on patient health outcomes. Aiken et al. (2002) uses cross- sectional data and a survey generated measure of patient loads for RNs and fi nds that each additional patient per registered nurse is associated with 7 percent increase in the risk- adjusted likelihood of dying within 30 days of admission and a 7 percent increase in odds of failure- to- rescue in hospitals. Subsequent studies have found similar results for other settings and out-comes and in the nursing home as well as hospital sectors (Harrington et al. 2000; Kane, Shamliyan, Mueller, Duval, and Wilt 2007; Mark, Harless, McCue, and Xu 2004; Needleman, Buerhaus, Pankratz, Leibson, Stevens, and Harris 2011; Needleman et al. 2002; Sochalski 2004). As documented elsewhere (Dobkin 2003; Evans and Kim 2006), however, there are strong reasons to doubt that these correlations refl ect causal effects. Because hospitals with higher nurse staffi ng also likely have higher levels of other inputs (doctors, support staff, or advanced equipment) and attract more sched-uled visits, the apparent effects of more nurses may be due partially to these other omitted inputs or favorable patient selection.
Recent studies by Dobkin (2003) and Evans and Kim (2006) better isolate exog-enous variation in nurse staffi ng levels and fi nd little evidence of a causal effect of nurse staffi ng on patient outcomes. Dobkin (2003) focuses on reductions in staffi ng and services offered by hospitals over the weekend, controlling for differences in un-observed illness severity among patients admitted on different days of the week. He shows that all the apparent excess mortality over the weekend found in an earlier study (Bell and Redelmeier 2001) was driven by nonrandom patient selection—even conditional on extensive initial diagnoses codes—rather than low staffi ng levels.2
Ev-ans and Kim (2006) analyze differences in patient outcomes due to changes in nurse to patient ratios that are caused by “surges” in admissions. They isolate all patients admitted to California hospitals on a Thursday over the years 1996 to 2000, and ex-amine how their outcomes vary with the number of patients admitted the following Friday and Saturday. Because staffi ng levels are predetermined, surges in admission reduce the effective staffi ng ratios for patients already admitted. Despite deviations in admissions from predicted values of 40 percent or more, Evans and Kim conclude that patient mortality and other outcomes are largely unaffected by changes in effective staffi ng ratios.
While these studies go a long way to solving the internal validity issues of sectional studies, their estimates may not be relevant for inferring the likely effects
The Journal of Human Resources 36
of legislating higher nurse- patient ratios. One important reason is that permanent in-creases in nurse staffi ng levels that would be effected through minimum staffi ng legis-lation may have quite different effects than these transitory fl uctuations. Hospital stays average about fi ve days in length, and changing the amount of nursing care over all
fi ve of these days is likely to impact care more than for just the fi rst one or two days.3
More generally, the care received by any patient may react more to permanent rather than temporary staffi ng changes for a number of reasons. The effort levels of nurses may respond (inversely) to temporary surges in admissions, or hospitals may increase triage efforts and encourage less acutely ill patients to return for care at a later date when staffi ng ratios have normalized. Both mechanisms might lead to muted apparent effects of staffi ng levels on outcomes.
Despite the interest in mandated increases in nurse staffi ng ratios as a means to improve the quality of healthcare, few studies have effectively addressed this question. Zhang and Grabowski (2004), Park and Stearns (2009), and Tong (2010) all study the effects of legislation aimed at increasing nurse staffi ng but the current study improves methodologically on each in several ways.4 For example, Zhang and Grabowski
re-gress changes in quality of care measures on changes in staffi ng levels among nursing homes surrounding passage of the national Nursing Home Reform Act (NHRA) in 1987, and fi nd no signifi cant effects. Unfortunately, for these relationships to refl ect the causal effect of staffi ng it must be the case that all of the time- series variation in staffi ng levels is exogenous, an assumption that is untested and hard to accept as plausible, especially given the other components of the NHRA (for example, a man-dated reduction in the use of unnecessary restraints or drugs, etc.). Tong (2010) uses a research design similar to that employed in this paper, but focuses on mortality as the quality of care measure for nursing homes. Mortality is an awkward quality of care measure in this context since acutely ill patients are often transferred to a hospital so may not die in the nursing home. Moreover, in a recent national survey some 56 percent of nursing home residents had do- not- resuscitate advanced directives (Center for Disease Control 2009), and so allowing a patient to die may not necessarily refl ect poor care in this setting.
III. California Minimum Nurse Staf
fi
ng Regulations
and Research Design
This paper assesses the causal impact of a law requiring a minimum threshold of nurse staff per patient on the quality of healthcare provided by nurs-ing homes in California. On July 22, 1999, then Governor Gray Davis responded to growing concerns about quality of care in nursing homes by signing Assembly Bill (AB) 1107, a law that required all skilled nursing facilities (nursing homes) to provide
3. Average length of stay in hospitals was 4.8 days in 2006 according to Health, United States, 2009, www .cdc .gov / nchs / data / hus / hus09 .pdf#102
Matsudaira 37
a minimum of 3.2 HPRD of direct nursing care. Medi- Cal (California’s Medicaid program) reimbursement rates increased via a wage pass- through to (partially) com-pensate fi rms for increased labor costs. The law was silent on the skill- mix of this care, so fi rms could meet the requirement by increasing their total hours worked by the combination of three types of nurses: registered nurses (RNs, the most skilled and highest paid), licensed vocational nurses (LVNs, frequently referred to as licensed practical nurses, or LPNs, in other states), or nurse aides (NAs, the least skilled, also called nurses’ aides). AB 1107 supplemented the Federal standards established by the 1987 NHRA studied by Zhang and Grabowski (2004) and replaced a previous state standard that required nursing homes to provide three nurse hours per resident day (HPRD), but allowed double counting of RN and LVN hours.5 While in 1999 nearly
all facilities were in compliance with the previous standard, nearly three- quarters of all fi rms had staffi ng levels below the 3.2 HPRD threshold required by the new law as of January 1, 2000 (Matsudaira forthcoming).6 Facility compliance with the staffi ng
law was monitored through regular visits by state auditors that included checks of staffi ng records and patient registers, and a range of penalties ranging from monetary
fi nes up to a loss of license were established for noncompliance.7
The structure of AB 1107 lends itself to a transparent research design to study its effects on quality of care outcomes, and to explore the relationship between nurse staffi ng and patient outcomes. The crux of the research design employed here is to compare changes in quality of care outcomes for fi rms with varying degrees of expo-sure to the minimum staffi ng law. Let the variable GAPi represent the staffi ng increase that would be necessary for a facility to just comply with the law, based on their aver-age staffi ng level in the years 1997 and 1998 (HPRD9798i)—the two years prior to
adoption of the AB1107. Thus, for a fi rm employing 2.7 HPRD (the average for fi rms not in compliance prior to passage), GAPi = 0.5 and for a fi rm employing 3.3 HPRD, GAPi = 0.8 If facilities comply with the law’s mandates, then we should expect to see
staffi ng increases that are proportional to GAPi—fi rms with staffi ng levels below 3.2 HPRD should increase their staffi ng, with greater increases for fi rms initially fur-ther below the threshold. On the ofur-ther hand, fi rms with staffi ng levels already above the threshold face no legislatively induced pressure to hire more nurses. So although we may observe increases in nurse staffi ng levels among these higher staffed facilities due to common shocks to all nursing homes, these should be more muted. To the ex-tent that more nursing hours per resident causes higher quality of care, then we should observe similar patterns in the changes in quality of care measures across fi rms with different initial staffi ng levels.
To be more precise, let yitc represent some nursing home outcome like the number of registered nurse hours employed or the fraction of residents with pressure sores in
5. Among other provisions, the NHRA required that 1) all homes have licensed nurses (RNs or LVNs) on duty 24 hours per day, 2) all homes have an RN on duty at least 8 hours every day, and 3) homes with 60 or more beds have a full- time RN employed as a director of nursing (DON).
6. Facilities were notifi ed, however, that enforcement of the new standard would begin in April of 2000. A separate law, AB 394, addressed hospitals but was not implemented until 2004.
7. Unfortunately, there is little information about how vigorously the law was enforced though as shown later fi rms did comply, albeit imperfectly, with the law.
The Journal of Human Resources 38
facility i in county c and year t, and defi ne ∆yic≡yic(2004) – yic(1999), or the change in the outcome four years after the policy was enacted.9 I estimate the impact of the
mini-mum nursing staffi ng legislation through variations of the following equation
(1) ∆yic=β0+θGAPi+γc+πHPRD9798
i
+νic
where HPRD9798i represents the facility’s initial staffi ng level and yc represents a vector
of 31 “county” fi xed effects.1011 The parameter of interest is θ which measures the
effect of the staffi ng legislation on yitc. I estimate three permutations of this equation, variably imposing the restrictions that yc and / or π are equal to zero. Since the depen-dent variable is the change in the outcome, the model implicitly controls for time- invariant facility characteristics that might affect either staffi ng levels or quality of care, such as permanent components of technology or patient mix, or location- specifi c factors (such as proximity to nurse training centers). The inclusion of county- level
fi xed effects (yc) accounts for county- level changes in determinants of ∆yic such as changes in county supply and demand conditions in both the labor and “output” mar-kets (local population demographics and economic conditions), changes in Medicaid or Medicare reimbursement regimes, market concentration ratios, and so on.
I also test the sensitivity of the results to inclusion of the initial staffi ng level
HPRD9798i. This controls for other changes in the determinants of outcomes that may
be correlated with initial staffi ng levels. One potential source of this type of confound-ing is the switch to a prospective pay system for Medicare, which some researchers have suggested led to reductions in RN staffi ng. The ability to make such reductions may be correlated with staffi ng levels, since low staff facilities may be constrained by federal standards for licensed nurses created by the NHRA. Another possibility, how-ever, is that inclusion of HPRD9798i may pick up the effects of competitive pressures to
increase staffi ng for fi rms initially above the threshold. If the law causes initially low- staffed fi rms to increase their staffi ng levels, fi rms already in compliance may be induced to increase their staffi ng levels to maintain a competitive edge as it is an indi-cator of quality that is easy for potential customers to observe. If so, θ might underes-timate the full impact of the law.
Because the model above identifi es the impact of the law by comparing changes in outcomes across fi rms with differing initial staffi ng levels, similar to a standard differ-ence in differdiffer-ences model, the key identifi cation assumption is that in the absence of the minimum staffi ng law there would be no difference in the changes in the outcome related to GAPi . I test this “common trends” assumption by estimating Equation 1 for key outcome variables in the preperiod (1996–99), and verifying that the estimates of
θ are statistically indistinguishable from 0. While not necessarily a source of bias for estimating the causal effect of the law, a potential concern in making inferences about the impact of staffi ng on quality of care outcomes involves behavioral responses to the
9. I have estimated models with various difference lengths, but present these longer term results only for brevity of presentation. All results are qualitatively similar, with the exception that staffi ng impacts of the law are more muted over a shorter time horizon as can be seen in Figure 1.
10. Some small counties are grouped together with contiguous larger counties. A list of the county groupings with the number of facilities in each county and the fraction that were out of compliance before the minimum staffi ng legislation was passed appears in Appendix Table 1.
Matsudaira 39
law by both nursing homes and patients. For example, nursing homes might substitute away from other inputs into quality of care as they increase their nurse employment and patient sorting to nursing homes might change as well. To the extent that patient sorting by unobserved acuity changes in such a way that more ill patients become more likely to sort into nursing homes with low initial staffi ng levels (and thus bigger increases in staffi ng) after the law becomes effective, this might lead to no apparent effect of staffi ng on patient outcomes. In the results section below, I show that there appears to be no effect of the law on observable measures of either facility- level fac-tor substitution or patient level sorting. While the potential for unobserved responses exists, the scant prior literature on this suggests the magnitudes of such a response are likely to be very small.
While it might seem natural to use this setup to study the causal effect of total staff-ing (all nurse hours) on patient outcomes through an instrumental variables design— for example instrumenting the change in total nurse staffi ng with GAPi—I eschew such an approach here. In this context it is very likely that the causal effect of a change in staffi ng will depend heavily on the mechanism that induces such a change, violating the so- called “stable unit treatment- value assumption” (SUTVA) discussed by Rubin (1986). Put simply, one can easily imagine that a different minimum staffi ng law that required increases in higher- skilled nurses (RNs) would have quite different effects on patient outcomes than the California legislation. While the California legislation is similar to legislation adopted or proposed in many other states and so the results here have broad applicability, it may be inappropriate to use the results to infer the causal effects of different types of staffi ng increases. Keeping these concerns in mind, the two- stage least squares estimates can be easily inferred from the “fi rst- stage” esti-mates of the effects on nurse staffi ng and the “reduced form” estimates of the effect of the law on patient outcomes presented below.
IV. Data and Descriptive Overview
This paper uses data from two main data sources. Data on staffi ng and facility characteristics are taken from administrative data used to certify and license nursing homes for Medicare and Medicaid eligibility collected by the California
Of-fi ce for Statewide Health Planning and Development (OSHPD). The most important elements used from this data are the staffi ng levels at each facility, reported as the total number of hours worked by occupation over the relevant reporting period. For nurses, staffi ng levels are reported separately for supervisors and management, geriatric nurse practitioners (GNPs), registered nurses, licensed vocational nurses, and nurse aides. I compute the facility’s total number of nursing staff hours as the sum of all hours worked by nonmanagement RNs, GNPs, LVNs, and NAs.12 I divide this measure by
the reported number of patient days to compute the facility’s HPRD staffi ng level. These data are then matched to quality of care measures from the federal Online Survey Certifi cation and Reporting System (OSCAR) data, collected by the Centers for Medicare and Medicaid Services (CMS). These data are used to determine whether
The Journal of Human Resources 40
facilities are complying with federal regulations, and facilities are surveyed for com-pliance at least every 15 months, though surveys are typically conducted at 12- month intervals. Harrington et al. (2000) argue that these data are accurate and reliable mea-sures of nursing home quality, and an IOM panel on nursing home quality recom-mended more intensive use of OSCAR data in future research (IOM 2001).
In the analyses presented here, I focus on two important patient outcomes in the OSCAR data where some adjustment for patient acuity at admission is feasible: the fraction of residents with pressure sores (excluding Stage 1) that were not present on admission, and the fraction of residents with contractures that were not present on admission. Pressure sores (also known as bed sores or decubitus ulcers) are injuries to skin tissue caused by constant pressure caused, for example, by lying or sitting station-ary in the same position. Stage 2 or higher sores involve open wounds that risk infec-tions, and can be life- threatening if not properly treated. Contractures are shortenings of muscles or tendons, usually resulting from a lack of use of a joint and leading to loss of motion in that joint. Both of these measures are frequently used in measuring quality of care in nursing homes, because they are thought to be preventable if patients with mobility problems are aided in moving about or preventive exercises, care that is usually provided by nurse aides.
I also examine the effects of minimum staffi ng regulations on two indicators for modes of care: the fraction of residents physically restrained who were not admitted with orders for restraints, and the fraction of residents with in- dwelling or external catheters not present on admission. These types of care are often considered substan-dard, as they generally are used as substitutes for nursing care (such as help with toilet-ing) (Zinn 1993). Indeed, Cawley, Grabowski, and Hirth (2006) fi nd that nationwide, nursing homes in high- wage markets tend to use more “materials- intensive” modes of care (use of catheters rather than nurse aides to assist incontinent patients). Similarly, higher nurse- staffi ng ratios might induce less “materials- intensive” care. Finally, I use OSCAR data on defi ciency citations as an overall measure of quality of care in the facility. Defi ciencies are given by surveyors on regularly scheduled visits for failure to comply with any of some 179 specifi c standards of care. I focus on total defi ciencies, and the subcategory “quality of care” defi ciencies that includes requirements to pre-vent pressure sores, falls, and physical decline. The total fi gure includes these defi cien-cies, and those related to other requirements covering quality of life (resident rights) issues, and administrative and record keeping practices (Harrington et al. 2000).
To generate an analysis sample, I begin with the universe of private skilled nursing facilities (including investor and church owned) submitting data to OSHPD in each year from 1994 to 1998. I start with these 1,133 fi rms to avoid analyzing new entrants, whose staffi ng ratios often fl uctuate wildly in their fi rst few years of operation as utilization ramps up.13 I drop six facilities with extremely high staffi ng levels, and
attempt to match the remaining 1,127 fi rms to the OSCAR data. 125 of these fi rms did not have adequate data on preperiod outcomes so were dropped, leaving 1,002. To simplify the analysis further, I restricted the analysis sample to the 965 fi rms re-maining in the sample in each year through 2004. I verify in Appendix Table A2 that attrition is not related to staffi ng levels in 1997–98, so attrition should not bias the
Matsudaira 41
results below. The Appendix describes variable defi nitions, matching procedures, and analyzes sample selection in greater detail.
Skilled nursing facilities, or nursing homes, provide both long- term medical and custodial care to their residents. Nationwide, residents are predominantly elderly—of approximately 1.5 million residents nationwide in 2004, 88.3 percent were aged 65 years or older—though younger individuals may spend some time recovering from surgery or a major accident in a nursing home.14 Stays in nursing homes are
gener-ally long: The median number of days since admission for 2004 residents was 463 days, with a mean of 835 days. More than half of residents require assistance with all
fi ve “activities of daily living” (ADL)—bathing, dressing, toileting, transferring, and eating.
Table 1 shows some descriptive statistics for the 965 nursing homes in California used in this analysis. The fi rst column shows the overall mean of various variables, and the next four columns show means for fi rms in each of four “quartiles” of the average HPRD staffi ng distribution for 1997 and 1998. Facilities had 101.4 beds on average, ranging from a low of 19 beds to a high of 391, with only slight differences across staffi ng quartiles. Total healthcare expenditures averaged about $4 million (in 2005 dollars), and facilities employed an average of 61 people, with an obvious gradi-ent across staffi ng level. The overall production process is quite labor intensive, with nurse salaries and benefi ts accounting for about 40 percent of all expenditures.
Care in nursing homes is provided nearly entirely by nurses, though doctors may supervise the development of treatment plans and patients may be transferred to a hospital emergency department in life- threatening situations. Most care—two- thirds of the total hours worked by nurses—is provided by NAs in the form of assisting residents with the activities of daily living listed above. LVNs and RNs account for 18 and 10 percent of all nurse hours worked, respectively, and are staffed primarily to develop and supervise medical treatment protocols.
There is a clear skill gradient across these nursing occupations that is refl ected both in the amount of training necessary to get the corresponding occupational license, and in the average wages of each occupation. RNs are typically required to complete be-tween two and six years of postsecondary education, whereas LVNs typically require only one year. Nursing aides require no formal training to be hired, but must complete 100 hours of on the job training, and 50 hours of classroom training to be certifi ed, and must pass a state medical exam within four months of being hired.15 In 1999, RNs made
an average hourly wage of $23.84, followed by LVNs at $18.29 and NAs at $9.50. In some ways, the nursing home sector is an ideal place to study the effect of higher nurse- patient ratios on patient outcomes. The fact that nearly all care is administered by nurses means that for many patient outcomes, the quantity and quality of nursing labor may be the most important input in production. This contrasts with the hospital setting, where patient outcomes are likely also heavily infl uenced by the quality of doctor and equipment inputs. In terms of measurement, there may also be better cor-respondence between data on staffi ng and effective staffi ng for patients, since there is less segregation of patients and staff across subunits of a nursing home.
14. Statistics in this paragraph are taken from Jones et al. (2009).
T
he
J
ourna
l of H
um
an Re
sourc
es
42
Table 1
1997–98 Descriptive Statistics for LTC Facilities in Analysis Sample by Staffi ng Level
Quartiles of 1997–98 HPRD Distribution
Facility Descriptives All 1st 2nd 3rd 4th
Number of beds 101.4 91.3 101.7 108.2 103.9
[49.3] [41.2] [46.3] [49.6] [56.3]
Total healthcare expenditures ($1,000s) 3,925.70 3,043.30 3,646.00 4,110.70 4,755.60
[2053.4] [1,615.5] [1,673.4] [1,863.9] [2,453.9]
Number of total employees 100.5 78.3 94.8 105.5 120.0
[47.4] [32.0] [40.6] [42.2] [58.0]
Number of direct care nurses 61.0 47.9 58.0 65.7 70.7
Percent of total nursing hours by RNs 11.0 9.1 11.0 11.3 12.3
M
at
suda
ira
43
Utilization
Percent occupancy 88.4 89.1 88.5 88.6 87.4
Percent patient days paid by MediCal 67.7 78.8 72.1 67.0 52.8
Percent patient days self- paid 23.5 11.7 19.0 21.4 39.4
Resident outcomes
Percent with pressure sores not present on admission 3.9 3.3 3.8 4.0 4.3
Percent with contractures not present on admission 7.3 5.6 6.8 8.8 8.0
Percent with catheters not present on admission 1.7 1.4 1.5 2.1 1.6
Percent with restraints not present on admission 14.6 13.6 14.5 15.6 14.6
Total defi ciencies (regular surveys only) 11.4 11.7 11.3 12.0 10.8
[6.4] [5.1] [6.0] [7.2] [6.9]
Quality of care defi ciencies 2.9 3.0 2.8 3.1 2.7
[2.0] [1.8] [1.7] [2.2] [2.1]
Number of facilities 965 230 232 232 271
The Journal of Human Resources 44
V. Results
Below, I present estimates of the impact of the minimum staffi ng leg-islation on staffi ng levels, quality of care measures, and a variety of other margins for skilled nursing facilities in California. In each section I present graphical evidence allowing both for visual identifi cation of the impact of the legislation and evaluation of the key identifying assumptions, followed by OLS estimates of Equation 1 to provide point estimates and standard errors.
A. Nurse Staffi ng
Figure 1 provides the most direct illustration of the effect of the minimum staffi ng requirements on overall staffi ng levels, and depicts the essence of the research de-sign employed in the paper. I divided fi rms with initial staffi ng levels below the 3.2 threshold into seven roughly equal groups based on their average HPRD staffi ng level in the years 1997 and 1998. These seven “decile groups” all have roughly 100 fi rms (between 99 and 101), with decile 1 having the 100 fi rms with the lowest initial staff-ing levels, decile 2 havstaff-ing the 100 next lowest, and so on. Similarly, I divided fi rms above the 3.2 threshold into three roughly equal groups, so deciles 8 through 10 each contain roughly 90 fi rms with progressively higher pre- period staffi ng levels. The six lines in the fi gure all depict trends in the average staffi ng levels between 1996 and 2004 for six of these decile groups; the remaining four decile groups are omitted to simplify presentation of the results. Several features of this fi gure are important to note. The most striking feature is the trend break in average staffi ng levels that oc-curs in the year 2000, when the staffi ng legislation becomes effective. As we would expect if this change is due to fi rms attempting to comply with the law, the increases in staffi ng are more pronounced for fi rms with lower initial staffi ng levels, and are smaller for the fi rms in the top three staffi ng deciles who already were in compliance with the law as of 1997 and 1998. Staffi ng levels are mostly unchanged throughout the period for fi rms in the 10th decile—with the highest initial staffi ng levels—but increase by nearly 0.6 HPRD for fi rms in decile 1, with intermediate changes for the deciles in between. If nurse staffi ng levels positively affects quality of care in nursing homes, then we should expect to see similar patterns in the changes of such outcomes: Firms should see improvements in quality that are proportional to how far below the threshold their staffi ng levels were in the preperiod (that is, proportional to GAP), and
fi rms initially in compliance should see relatively small changes with little relationship to initial staffi ng levels. In this research design, drawing a causal link between staffi ng changes and quality of care changes rests on an assumption that in the absence of the minimum staffi ng law, the trends in unobserved determinants of outcomes should be similar for fi rms with different initial staffi ng levels. The fact that Figure 1 shows staff-ing levels trendstaff-ing in similar ways in the four years before AB 1107 becomes effective lends support to this assumption.16
Matsudaira 45
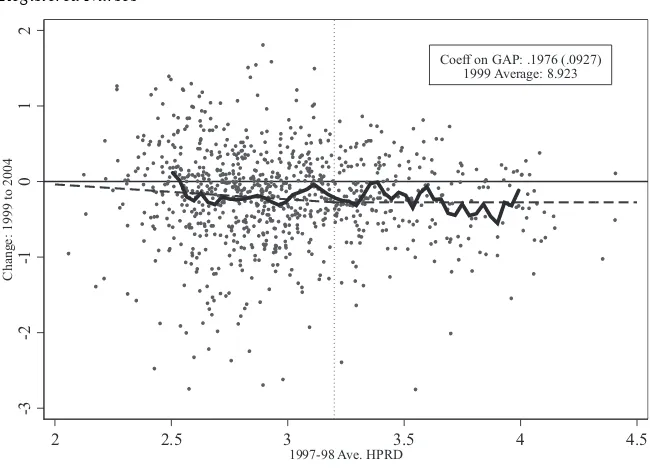
Figure 2 displays the impact of the law on the staffi ng levels of particular types of nurses—nurse aides (top panel) and registered nurses (bottom panel)—in a way that is more tightly linked to the research design described in Equation 1. Each dot in the fi gures represents one of the nursing homes in the sample, and plots the change in the log of total annual hours worked for each type of nurse from 1999 to 2004 against its average staffi ng level in 1997 and 1998, the two years prior to passage of the staffi ng law. The dashed line in the Figure shows fi tted values from the simplest specifi cation for Equation 1, regressing the change in staffi ng levels on a constant term and GAP. For nurse aides, the estimated coeffi cient on GAP is 0.23 (standard error: 0.029), indicating that on average fi rms increased their nurse aide staffi ng by about 23 percent for every 1 HPRD below the 3.2 threshold they were in the preperiod. While the estimated constant term is nonzero, indicating that fi rms initially above the threshold did increase their staffi ng levels, there does not appear to be a relationship between initial staffi ng levels and the size of this increase for fi rms that were already in compliance. This is borne out by the solid line in the Figure, which shows that a Figure 1
Effects of Legislation on Nurse Hours per Resident Day by Initial Staffi ng Level
“Deciles”
The Journal of Human Resources 46
nonparametric (local linear) regression nearly matches the fi t of the linear specifi cation in Equation 1.17 While the bottom panel shows a similar pattern of results for
regis-tered nurses—the estimated coeffi cient on GAP is 0.19—the wider dispersion of dots around that trend line suggests that the result is less statistically precise. Similar graphs for LVNs show average employment levels increasing by roughly the same magnitude across all levels of preperiod staffi ng.
Table 2 adds some precision to these fi ndings, showing the results of estimating various specifi cations of Equation 1 for nurse aides, licensed vocational nurses, and registered nurses. Three models are estimated for each type of nurse using the change
17. The solid line shows the (connected) predicted values from a local linear regression using a triangular kernel and a bandwidth of 0.05 HPRD, shown over the subset of observations with 2.5 to 4 HPRD on the x- axis.
Nursing Assistants
Facilities with extreme values are omitted for presentation purposes. Data for 913 of 961 facilities shown in fi gure.
Figure 2
Effect of Legislation on Nurse Staffi ng by Occupation
Notes: Each fi gure displays the change in log of total annual hours worked for the relevant occupation as a function of preperiod staffi ng level for each nursing home in the sample. The dashed line plots the fi tted values from a regression of this change on GAP and a constant term (as described in the text), and the solid line shows the fi t of a local linear regression through these points using a triangular kernel and bandwidth of 0.05 HPRD.
Coeff on GAP: .232 (.0289) 1999 Average: 10.978
-.5
0
.5
1
Change: 1999 to 2004
2 2.5 3 3.5 4 4.5
Matsudaira 47
in log annual hours between 1999 and 2004 as the dependent variable: the fi rst (in Col-umns 1, 4, and 7) regresses the change in outcomes on GAP and a constant term only, the second (Columns 2, 5, and 8) adds county fi xed effects, and the third adds a linear control for average HPRD in 1997 and 1998 (recentered so that 3.2 HPRD is zero). As described above, the causal effect of the staffi ng law is captured by the coeffi cient on GAP. For nurse aides, the estimated coeffi cient is positive and signifi cant across all three models: The law caused nursing facilities to hire more nurse aides in proportion to how far out of compliance they were before the staffi ng law was passed. To get a sense for the magnitude of the coeffi cients, note that fi rms with initial staffi ng levels below the 3.2 threshold had an average staffi ng level of 2.7 HPRD, or a GAP of 0.5. Thus, for the average fi rm (in this sense) not already in compliance, the law induced a roughly 10.4 percent increase after four years.18
For more skilled nurses, the results are quite different. On average, nursing homes increased their employment of LVNs by about 0.20 log points from 1999 to 2004 (the constant term in Column 4 of Table 2). But this increase was uniform across
18. The calculation is 0.5 × 0.2082, taking the coeffi cient from Model 2. The estimate is smaller, and some-what less precise, when I control additionally for HPRD in the regressions (Column 3).
Figure 2 (continued) Registered Nurses
Facilities with extreme values are omitted for presentation purposes. Data for 902 of 950 facilities shown in fi gure.
Coeff on GAP: .1976 (.0927) 1999 Average: 8.923
-3
-2
-1
0
1
2
Change: 1999 to 2004
2 2.5 3 3.5 4 4.5
T
he
J
ourna
l of H
um
an Re
sourc
es
48
Table 2
Effects of Staffi ng Legislation on Nurse Employment (change in log annual hours between 1999 and 2004)
Nurse Aids LVNs RNs
1 2 3 4 5 6 7 8 9
GAP 0.232 0.2082 0.1352 –0.001 –0.0095 0.0628 0.1976 0.1751 –0.2314
[0.0289] [0.0289] [0.0446] [0.0468] [0.0494] [0.0826] [0.0927] [0.098] [0.2000]
HPRD9798
– 3.2 –0.0468 0.0465 –0.2588
[0.0213] [0.0438] [0.1222]
Constant 0.0916 0.1979 –0.0773
[0.0114] [0.0188] [0.0257]
County fi xed- effects No Yes Yes No Yes Yes No Yes Yes
R2 0.081 0.120 0.125 0.000 0.047 0.049 0.006 0.052 0.052
Observations 961 961 961 958 958 958 952 952 952
Notes: The table presents estimates of several specifi cations of Equation 1, described in the text. In each column the dependent variable is the change in log total annual hours worked between 1999 and 2004 of the relevant nurse occupation. The key independent variable of interest is $GAP$, which represents the gap between the 3.2 HPRD minimum staffi ng level and a facility’s pre- period (1997–98) staffi ng level, defi ned to be 0 for fi rms with staffi ng levels already above 3.2 in the pre- period. HPRD9798– 3.2 is a linear
Matsudaira 49
homes with different initial staffi ng levels, and in fact the increase is fi rst discernible between 1998 and 1999, before the staffi ng legislation was passed.19 For RNs, there
is an evident reduction in the average hours worked across all fi rms, but the reduc-tions are largest among those fi rms that had the highest initial staffi ng levels. Thus, the coeffi cients on GAP in Table 2 in Models 1 and 2 suggest that the law may have increased RN staffi ng by about 10.5 percent for the homes initially out of compli-ance with the law but this should be understood as the law preventing a decline in these hours in an absolute sense. But, these results are not robust to the inclusion of a control for HPRD, and an analysis of preperiod trends shows that the change had already become apparent before the law had passed. Other research has suggested that a switch to Medicare prospective payment for skilled nursing homes in the Balanced Budget Act of 1997 may have created fi nancial pressure beginning in July of 1998 for nursing homes to substitute away from RNs in favor of LVNs (Konetzka, Norton, Sloane, Kilpatrick, and Stearns 2006).20 It may be that fi rms with low staffi ng levels
were more constrained in their ability to do this, producing the patterns in staffi ng by occupation observed.
B. Patient Outcomes and Facility Defi ciencies
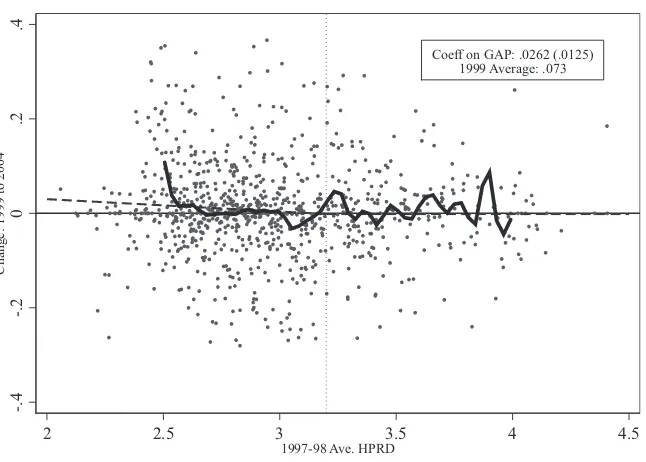
Figure 3 presents changes in two important patient outcomes as a function of their preperiod staffi ng levels. Changes in the fraction of patients with pressure sores not present on admission are presented in the top panel, and changes in the fraction of contractures not present at admission are displayed in the lower panel. Recall that both of these outcomes are believed to be preventable with regular assistance with mobility, the type of care generally provided by nurse aides. If increased nurse aide hours reduce the prevalence of these outcomes, we would expect to see patterns that are a mirror image (refl ected around the X- axis) of those found for nurse aide hours worked in the top panel of Figure 2. That is, we would expect that the prevalence of such outcomes changes relatively little for fi rms with the highest initial staffi ng levels, and then ex-hibits greater and greater declines for fi rms with initial staffi ng levels further below the 3.2 threshold. No such patterns are evident in the data for either outcome, suggesting little impact of the staffi ng legislation.
Table 3 tells this story with more precision. Panel A presents the results for pressure sores (Columns 1 to 3) and contractures (Columns 4 to 6), with the coeffi cient on GAP estimated using the three specifi cations described above for Table 2. For pres-sure sores, the point estimates of GAP are positive across each model suggesting an adverse impact on patient outcomes. The effects are never statistically distinguishable from zero, however, and are small in magnitude.21 In Panel B, I present tests of the
common trends assumption by estimating the relationship between GAP and changes in the outcomes in the preperiod (1996–99). In each specifi cation, there is no evidence
19. See Figure 3 of the Appendix.
20. There was also some concern that repeal of the Boren amendment in 1997 may also have led states to cut Medicaid rates, but Grabowski, Feng, Intrator, and Mor (2004) documents that Medicaid reimbursements did not change much over the time period.
The Journal of Human Resources 50
of differential trends in the preperiod, supporting the validity of the research design used here.
Columns 4 to 6 in Table 3 show similar results for the fraction of residents with contractures not present on admission. The point estimates on GAP are positive in all specifi cations, but none are statistically signifi cant. Again, the magnitudes of the estimates are small in an economic sense as well, and there is no evidence in Panel B of the table that differential trends in the fraction of patients with contractures were present before passage of the law.
Total defi ciency citations during yearly certifi cation inspections are often used in the nursing home quality literature as an overall proxy for the quality of care provided by a facility. Table 4 examines whether the staffi ng legislation had an impact on this Figure 3
Effects of Minimum Staffi ng Legislation on Patient Outcomes (3- Year Moving
Averages)
Notes: Each fi gure displays the change in the fraction of patients with pressure sores (top panel) or contractures (bottom) not present at admission as a function of pre- period staffi ng level for each nursing home in the sample. The dashed line plots the fi tted values from a regression of this change on GAP and a constant term (as described in the text), and the solid line shows the fi t of a local linear regression through these points using a triangular kernel and bandwidth of 0.05 HPRD.
Pressure Sores Not Present at Admission
Facilities with extreme values are omitted for presentation purposes. Data for 915 of 963 facilities shown in fi gure.
Coeff on GAP: .004 (.0038) 1999 Average: .034
-.1
-.05
0
.05
Change: 1999 to 2004
2 2.5 3 3.5 4 4.5
Matsudaira 51
indicator of quality, as well as a subset category capturing “quality of care” defi cien-cies that may more directly depend on nurse labor. There is some signifi cant evidence that the staffi ng legislation decreased overall defi ciency citations in Columns 1 to 3. For example, the coeffi cient on GAP in Column 2 suggests an average fi rm with low initial staffi ng levels might have improved by about 0.27 citations (relative to an aver-age across fi rms of 11.4). That fi nding, however, is sensitive to inclusion of the HPRD control. For “quality of care defi ciencies,” the magnitudes of the effect are small and statistically insignifi cant.
C. Factor Substitution
As nursing homes were forced to hire more nurses, it seems likely that they may have reduced their use of substitute inputs in production. It is clear already that there was substitution toward less- skilled nurse aides from LVNs and RNs, but Zinn (1993) and Cawley et al. (2006) point out that facilities may also substitute between intensive and labor- intensive modes of care. For example, an alternative to nurse aide assistance with mobility and toileting might be to catheterize patients or use physical restraints to prevent patients from moving about.
Contractures Not Present at Admission
Facilities with extreme values are omitted for presentation purposes. Data for 916 of 963 facilities shown in fi gure.
Figure 3 (continued)
Coeff on GAP: .0262 (.0125) 1999 Average: .073
-.4
-.2
0
.2
.4
Change: 1999 to 2004
2 2.5 3 3.5 4 4.5
T
he
J
ourna
l of H
um
an Re
sourc
es
52
Table 3
Effect of Staffi ng Legislation on Patient Outcomes
Pressure Sores (1999 Mean: 0.039) Contractures (1999 Mean: 0.073)
1 2 3 4 5 6
A. Change in Fraction of Residents with Conditions Not Present on Admission, 1999 to 2004
GAP 0.0028 0.0071 0.0077 0.022 0.0251 0.0262
[0.0058] [0.0068] [0.009] [0.0183] [0.0195] [0.0310]
HPRD9798
– 3.2 0.0004 0.0007
[0.0036] [0.0139]
Constant –0.0051 –0.0047
[0.0022] [0.0081]
County fi xed- effects No Yes Yes No Yes Yes
M
at
suda
ira
53
B. Validity check: Change in Fraction of Residents with Conditions not Present on Admission, 1996 to 1999
GAP 0.0008 0.000 0.0077 –0.0029 –0.0082 –0.0022
[0.0056] [0.0061] [0.0122] [0.0172] [0.0182] [0.0283]
HPRD9798
– 3.2 0.0051 0.004
[0.0079] [0.0114]
Constant –0.0081 0.0023
[0.003] [0.008]
County fi xed- effects No Yes Yes No Yes Yes
R2 0.000 0.051 0.052 0.000 0.042 0.042
Notes: The table presents estimates of several specifi cations of Equation 1 (described in the text) for two important patient outcomes: the (change in the) fraction of patients at a facility with pressure sores not present on admission and the fraction of patients at a facility with contractures not present on admission. In each column the dependent variable is the change in fraction of patients at a facility with the relevant condition. The key independent variable of interest is GAP, which represents the gap between the 3.2 HPRD minimum staffi ng level and a facility’s preperiod (1997–98) staffi ng level, defi ned to be 0 for fi rms with staffi ng levels already above 3.2 in the preperiod.
HPRD9798– 3.2 is a linear control for preperiod staffi ng levels, “recentered” so that 3.2 is equal to zero. Columns 2, 3, 4, and 6 also include a vector of 31 county fi xed effects,
T
he
J
ourna
l of H
um
an Re
sourc
es
54
Table 4
Effect of Staffi ng Legislation on Facility Defi ciency Citations
Pressure Sores (1999 Mean: 11.4) Contractures (1999 Mean: 2.9)
1 2 3 4 5 6
A. Dependent Variable: Change in Defi ciencies 1999 to 2004
GAP –1.4223 –0.5384 0.2431 0.1248 0.1699 0.5669
[1.0446] [1.0854] [1.7356] [0.322] [0.3426] [0.5332]
HPRD9798
– 3.2 0.5189 0.2637
[0.8282] [0.262]
Constant –1.9821 –0.8534
[0.4475] –0.1397
County fi xed- effects No Yes Yes No Yes Yes
M
at
suda
ira
55
B. Validity check: Change in Defi ciencies 1996 to 1999
GAP 0.702 1.1035 0.12 0.1277 0.1823 [–0.4739]
[1.1205] [1.1818] [1.8503] [0.3736] [0.4077] [0.7008]
HPRD9798
– 3.2 –0.6529 –0.4357
[0.8923] [0.3889]
Constant 0.6829 0.7906
[0.5224] [0.1696]
County fi xed- effects No Yes Yes No Yes Yes
R2 0.000 0.063 0.064 0.000 0.056 0.058
Notes: The table presents estimates of a variety of specifi cations of Equation 1 (described in the text) for two important facility- level quality- of- care outcomes: the (change in the) number of total defi ciency citations and the number of quality- of- care- related defi ciency citations. In each column the dependent variable is the change in the num-ber of citations a facility receives. The key independent variable of interest is $GAP$, which represents the gap between the 3.2 HPRD minimum staffi ng level and a facil-ity’s preperiod (1997–98) staffi ng level, defi ned to be 0 for fi rms with staffi ng levels already above 3.2 in the preperiod. HPRD9798– 3.2 is a linear control for pre- period
The Journal of Human Resources 56
Panels 1 and 2 of Table 5 present estimates of the impact of the law on two in-dicators for treatment modality using Specifi cations 2 and 3 from Tables 2 through 4 (I omit results that do not include county fi xed effects): the fractions of residents with physical restraints and catheters not present on admission. Panel 1 of Table 5 shows no impact on restraint use. The magnitudes of the coeffi cients are vanishingly small compared to an overall rate of restraint use of 14.6 percent. Panel 2, however, is suggestive of a small effect of the staffi ng legislation on catheter use, though the results hover on the edge of statistical signifi cance. The point estimates suggest that the law caused an average fi rm with low initial staffi ng to reduce catheter use by about 0.25 to 0.48 percentage points, a sizable effect relative to an average across fi rms of 1.7 percent. The law appears to have had no meaningful impact on the fraction of pa-tients taking psychoactive medications (Panel 3), in contrast to the fi nding by Cawley et al. (2006) of substitution between these drugs and labor in response to high nurse wages.
D. Other Outcomes and Evidence on Sorting
Many other health outcomes are measured in the OSCAR data, but in contrast to the outcomes highlighted above for most we cannot discern whether residents developed these conditions while under care at the facility or already had them at admission since no there is no measure of whether these conditions were “not present at admission.” With this caveat, the second group of results in Table 5 (“Health Outcomes”) shows the impact of the staffi ng legislation on a variety of other outcomes for which no risk adjustment is possible. For each outcome I show coeffi cient estimates only from the models with county fi xed effects, with and without the added linear control for HPRD for the change in the outcome from 1999 to 2004. For each outcome, the 1999 mean is reported to contextualize the size of the estimated effects. Panels 4 to 8 reveal no signifi cant (statistically or economically) effects on the fraction of patients who are chair- fast, are bed- fast, have signs of depression, have a psychiatric diagnosis aside from depression, or who experience unplanned changes in weight. These results sup-port the conclusion that the law did not cause meaningful changes in patient health.
57 Table 5
Effect of Staffi ng Legislation on Other Outcomes: Change from 1999 to 2004
Modes of Care
1. Physical restraints 2. Catheter use
3. Percent Psych. Meds
GAP 0.0133 0.0226 –0.005 –0.0095 –0.0247 –0.0323
[0.0167] [0.0255] [0.0037] [0.0051] [0.0254] [0.0459]
HPRD9798
– 3.2 0.0062 –0.003 –0.0051
[0.0122] [0.0022] [0.0272]
R2 0.04 0.04 0.043 0.043 0.033 0.033
1999 mean .146 .017 0.43
Health Outcomes
4. Percent Chair- fast 5. Percent Bed- fast 6. Percent Depressed
7. Percent Other Psychological
Diagnoses
8. Percent Weight Change
GAP –0.0309 0.0194 0.0225 0.0322 0.0036 –0.0393 0.0458 0.0121 0.0312 0.0362
[0.0353] [0.0591] [0.0127] [0.0194] [0.0301] [0.0489] [0.0221] [0.0358] [0.0131] [0.0186]
HPRD9798
– 3.2 0.0334 0.0065 –0.0285 –0.0224 0.0033
[0.0321] [0.0074] [0.0237] [0.0176] [0.0077]
R2 0.024 0.025 0.045 0.045 0.04 0.042 0.053 0.055 0.049 0.049
1999 mean 0.564 0.064 .293 0.138 0.073
58
Table 5 (continued)
Patient Characteristics (Selection)
9. Occupancy
10. Percent PS on Administration
11. Average ADL Score
GAP 0.6617 2.8864 –0.0109 –0.0052 –0.0007 –0.0868
[1.2274] [2.3326] [0.0079] [0.0149] [0.0705] [0.1026]
HPRD9798
– 3.2 1.4291 0.0038 –0.0572
[1.3718] [0.0089] [0.0536]
R2 0.081 0.083 0.049 0.05 0.043 0.045
1999 mean 88 0.046 3.97
Healthcare Costs
12. Ln Nurse
Wage Bill 13. Ln H.C. Exp.
GAP 0.1679 0.0716 0.0796 0.0437
[0.0317] [0.0558] [0.0243] [0.049]
HPRD9798
– 3.2 –0.0619 –0.0231
[0.0299] [0.029]
R2 0.11 0.116 0.124 0.125
1999 mean 13.97 15.05
Notes: The table presents estimates of various specifi cations of Equation 1 (described in the text) for a variety of outcomes. In each panel the dependent variable is the change in the aver-age outcome (averaver-aged across patients) at the facility level between 1999 and 2004. The key independent variable of interest is $GAP$, which represents the gap between the 3.2 HPRD minimum staffi ng level and a facility’s preperiod (1997–98) staffi ng level, defi ned to be 0 for fi rms with staffi ng levels already above 3.2 in the preperiod. HPRD9798– 3.2 is a linear control
Matsudaira 59
risk- adjustment in studies of nursing home quality of care, also appears unaffected by the law (Panel 11).22 Taken together, these facts suggest that facilities do not admit
sicker (or healthier) patients in response to the law. This mitigates concerns that the apparent null effects of the legislation found above may be driven by facilities admit-ting sicker patients (while providing better quality of care).
The fi nal two panels show the impact of the nursing law on healthcare costs. Panel 12 shows the impact on the (log of the) total wages paid to all types of nurses and Panel 13 shows the impact on all healthcare expenditures of the fi rm. While these results are slightly sensitive to the linear control for HPRD, the specifi cation with GAP and county fi xed effects only suggests fairly large increases in labor and thus overall costs. For the average fi rm initially out of compliance with the law, the legislation increased the total nurse wage bill by about 8.4 percent and increased total healthcare related expenditures by about 4 percent.23
VI. Conclusion
Over the past 10 years, minimum staffi ng legislation has been pursued by many states as a way of improving the quality of patient care in hospitals and nursing homes. This paper shows that such legislation can be effective in increasing staffi ng ratios, as fi rms with the lowest staffi ng levels increased their employment of nurse aides by 35 percent or more and on average fi rms initially out of compliance increased nurse aide employment by about 10 percent. This increase in staffi ng in-creased total healthcare expenses for affected fi rms by about 4 percent. Despite these increases, however, there is no evidence that this increase in nurse staffi ng resulted in better patient outcomes or improved any other of the most commonly used measures of facility quality with the exception of some suggestive evidence on reduced catheter-ization rates.
There is not a simple explanation for these results. One hypothesis is that the effect of staffi ng on outcomes is heterogeneous across facilities and depends positively on initial staffi ng levels. For example, facilities with low staffi ng levels may be of poorer quality overall and lack the resources (managerial ability or other inputs) to produc-tively utilize new nursing staff. Thus, while I estimate null effects, these effects only apply to fi rms with low initial staffi ng and fi rms with higher staffi ng levels may still benefi t from increased staffi ng. This argument does not receive much support from the data, though it is hard to test decisively. Looking at Figures 1 and 2, we see that even fi rms with staffi ng levels just a bit below the 3.2 HPRD threshold experience increases in nurse staff relative to fi rms above the threshold, with these increases get-ting larger for fi rms further out of compliance in the pre- period. If the marginal effects of increased staffi ng are positively related to initial staffi ng levels, then we might expect bigger effects of staffi ng for these fi rms relative to fi rms with lower levels of initial staffi ng. The nonparametric regressions in Figures 2 and 3, however, are more suggestive of a zero effect of staffi ng across all levels of the staffi ng distribution since
22. The ADL score could also be used as an outcome of nursing home quality.
The Journal of Human Resources 60
the zero estimated reduced form impact of the law on patient outcomes clearly does not vary across initial staffi ng levels.24
Another hypothesis is that the staffi ng law induces a decline in the skill mix of nurses (the ratio of licensed (LVN and RN) to total nurse hours) and that this has adverse effects on quality of care. While it may be true that patient outcomes are more responsive to inputs from more highly skilled nurses (though this seems less likely for pressure sores and contractures, the key outcomes highlighted above), it is important to note that the law does not appear to induce a decline in the employment of more highly skilled nurses. The average employment of licensed nurses (LVNs and RNs) increases in every quartile of the initial staffi ng distribution over this time period, though there appears to be substitution of RN toward LVN workers except for fi rms in
the lowest quartile. As noted above, neither of these changes appears to be caused by
the minimum staffi ng law. Overall, however, the decline in skill mix over the period refl ects that total HPRD is increasing due to the large increase in nurse aide HPRD, but licensed nurse HPRD is increasing also, just not by as much. While it seems plausible that reducing skill mix might have an adverse effect on outcomes holding total hours
constant, that is not the nature of the change here. It is possible that there is strong
complementarity in the quality of care production function, such that increases in the employment of nurse aides will only be productive to the extent there are increases in licensed nurses to manage them, but research that can isolate exogenous variation in the levels of each type of nurse occupation is needed to better understand these relationships. A related point made by Zhang and Grabowski (2004) is that staffi ng increases might be necessary but not suffi cient for improving quality—to be effective the increased staffi ng may need to be coupled with changes in a variety of other care practices. If such practices are costly to implement, and facilities cannot charge higher prices to suffi ciently benefi t from providing better care (due to set reimbursement rates through Medicaid / Medicare) then they may undertake adopt these complementary investments.
A fi nal explanation for the null fi nding here is that nursing homes are able to change other inputs into patient care in a way that negates the benefi ts of higher staffi ng levels. While I have not found evidence of this type of behavior, it is possible that facilities adjust on unobserved margins in a way that adversely affects quality of care outcomes. One possibility might be that nurse effort levels are sensitive to overall staffi ng levels as suggested (though not tested) by Currie, Farsi, and Macleod (2005), so that the total amount of “effective” nurse labor is not changed to the same extent as the change in total hours worked would suggest. Importantly, any behavioral response by facilities might undermine our ability to infer the effect of staffi ng levels on patient outcomes, but the results in the paper still accurately capture the important policy parameter: the overall impact of the minimum staffi ng law on patient outcomes.
The fact that none of the outcomes commonly used to measure quality of care in