Control and the Human Capital
Investment Decision
Margo Coleman
Thomas DeLeire
a b s t r a c t
We present an economic model of how teenagers’ outlooks—specifically their locus of control—affect their human capital investments. Locus of control measures the extent to which a person believes their actions affect their outcomes. The model allows locus of control to affect teenagers’ as-sessment of the return to education. The effect of eighth graders’ locus of control on high school completion and college attendance is examined us-ing the National Educational Longitudinal Study. The results indicate that locus of control influences education decisions and suggests that locus of control operates through teenagers’ expectations of the returns to human capital investments.
I. Introduction
Until recently, most economic models have ignored the importance of ‘‘noncognitive’’ factors in the formation of human capital. In particular, economic models of educational attainment have neglected to incorporate teenagers’ outlooks as a factor affecting their education decisions. These outlooks may be important because teenagers who believe that labor market success depends little on their hu-Margo Coleman is a research associate at the Child Welfare League of America, 440 First Street, NW, Third Floor, Washington, DC 20001-2085. Thomas DeLeire is an assistant professor at the Irving B. Harris Graduate School of Public Policy Studies, University of Chicago, Chicago, IL 60637. The au-thors thank Joe Altonji, Jay Bhattacharya, Alex Cavallo, Greg Duncan, Rachel Dunifon, Annamaria Lu-sardi, Will Manning, Shannon Seitz, two anonymous referees, and seminar participants at the Northwestern/University of Chicago Joint Center for Poverty Research and the Canadian International Labour Network who provided many useful comments and suggestions. They also thank Steven Dixon and Meejung Chin for excellent research assistance. Financial assistance was provided by the McCor-mick-Tribune Foundation through a grant to the Center for Human Potential and Public Policy at the Irving B. Harris Graduate School for Public Policy Studies. The data used in this article can be ob-tained February 2004 through January 2007 from Thomas DeLeire at the address listed above. [Submitted October 2000; submitted March 2002]
man capital investments and more on luck, fate, or other ‘‘external’’ factors might be more likely to drop out of high school or fail to attend college. On the other hand, teenagers who believe that their human capital investments or other ‘‘internal’’ factors will have a strong impact on their future opportunities might be more likely to complete high school or attend college. Thus, the ‘‘internal-external’’ outlook or locus of control of teenagers may be a relevant noncognitive trait in a model of human capital investment. This paper develops a theoretical model of human capital investment that incorporates locus of control and empirically examines its testable implications using data from the National Educational Longitudinal Study (NELS). While this paper is the first to introduce the psychological concept of locus of control into the human capital investment model, education researchers have long recognized the relationship between locus of control and educational attainment. For example, in 1966, the ‘‘Coleman Report’’ found that locus of control ‘‘was more highly related to achievement than any other factor in the student’s background or school’’ (Coleman 1971). We model locus of control as affecting a teenager’s assess-ment of the relationship between the probability of labor market success and his or her level of human capital investment. The model implies that teenagers with an internal locus of control should be more likely to make educational investments. Importantly, the model has testable implications that distinguish it from a model in which locus of control is a proxy for unobserved ability.
II. Review of the Literature on the Role of Locus of
Control in Decision-Making
Locus of control, or ‘‘internal-external’’ attitudes, is a psychological concept measuring ‘‘a generalized attitude, belief, or expectancy regarding the nature of the causal relationship between one’s own behavior and its consequences’’ that can influence a variety of behavioral decisions in everyday situations (Rotter 1966). Individuals hold beliefs regarding whether outcomes are due to their own efforts or the result of luck, chance, fate, or the intervention of others. Individuals who believe that outcomes are due to their own efforts have an ‘‘internal’’ locus of control while individuals who believe that outcomes are due to luck have an ‘‘external’’ locus of control (Maddux 1991). Thus, locus of control is often referred to as ‘‘internal-external’’ attitudes.
Locus of control is believed to form during childhood and stabilize during adoles-cence (Sherman 1984). Rotter (1966) hypothesizes that an individual develops a sense of control when reinforcement is perceived as contingent on his or her behavior and that behaviors that result in reinforcement serve to strengthen an individual’s perception of control. On the other hand, when reinforcement fails to occur, an indi-vidual’s perception of control will diminish.
particularly if disruptive and when young, is associated with the development of external locus of control. Third, children with internal locus of control have parents who were more nurturing, emotionally supportive, and warm. Skinner, Zinner-Gembeck, and Connell (1998) examine the development of locus of control in chil-dren and find that parental involvement, family environment, teacher warmth, and academic performance help determine the development of internal locus of control. Locus of control has been found to be associated with a variety of choices people make in their lives including vocational and career decisions (Maddux 1991). Indi-viduals who have an internal locus of control generally are more active in trying to pursue their goals and improve their lives (Rotter 1966). Furthermore, through inge-nuity and perseverance, they often figure out ways of exercising some measure of control even in situations containing limited opportunities and many constraints (Bandura 1990). On the other hand, individuals who believe that they have no control over the outcome of situations are likely to effect little change even in situations that provide many opportunities (Bandura 1990).
The Survey of Educational Opportunity, as reported in Equality of Educational Opportunity or the ‘‘Coleman Report,’’ surveyed 600,000 children at five grade lev-els in 4,000 schools. Among other findings, the survey finds that a measure of locus of control was highly related to academic performance and was a more important determinant of achievement than any other factor in a student’s background or school (Coleman 1966).
Andrisani (1977, 1981) uses the National Longitudinal Survey (NLS) to study how a four-item Rotter (1966) scale of locus of control is related to subsequent labor market outcomes. He finds that locus of control was strongly related to average hourly earnings, total earnings, occupational attainment, and the growth of these variables. He also finds that locus of control could not explain the differences be-tween blacks and whites in labor market outcomes.
Duncan and Morgan (1981) replicate Andrisani (1977) study using the Panel Study of Income Dynamics (PSID). The authors question the causal interpretation of Andri-sani’s results and suggest that achievement might increase an individual’s perceived self-efficacy (or locus of control). Surprisingly and despite this concern over simulta-neity, Duncan and Morgan find a smaller relationship between self-efficacy and labor market outcomes using the PSID than Andrisani finds with the NLS and conclude that there is little evidence that self-efficacy affects labor market outcomes.1
Duncan and Dunifon (1998) also use the PSID and find that this measure of self-efficacy for men aged 20–29 does predict labor market outcomes 15–20 years later. Moreover, the self-efficacy of respondents aged 30–39 predicts the number of com-pleted years of schooling of these respondents’ children 15–20 years later. The au-thors conclude that motivation helps determine economic mobility and can strongly influence both an individual’s future wages and the future educational achievement of their children. Moreover, the fact that the measures of labor market and educa-tional outcomes are measured 15–20 years later mitigates much of the concern that self-efficacy and these outcomes are simultaneously determined.
Goldsmith, Veum, and Darity (1997) use the measures of self-esteem and locus
of control from the National Longitudinal Survey of Youth (NLSY) to test whether ‘‘psychological capital’’ directly affects wages. The authors allow for self-esteem and wages to be determined simultaneously, but obtain identification only though strong exclusion restrictions—the authors assume that locus of control does not af-fect wages but does afaf-fect self-esteem. The study concludes that psychological capi-tal directly increases wages through self-esteem and indirectly increases wages through locus of control.
Heckman, Hsee, and Rubinstein (2000) examine how the wages of high school graduates, GED recipients, and high school dropouts are affected by both cognitive and noncognitive skills. They find that GED recipients have more cognitive skills, but fewer noncognitive skills than high school dropouts and this lack of noncognitve skill can explain much of their low wages.
III. A Model of Locus of Control and the Human
Capital Investment Decision
In this section, we present a model that incorporates the psychologi-cal concept of locus of control into a model of the human capital investment decision. We model locus of control as influencing a teenager’s belief about the return to education. Specifically, teenagers with a more external locus of control believe that their behavior (for example, graduating from high school) will have a relatively small effect on the probability of labor market success. Teenagers with a more internal locus of control believe that their behavior will have a relatively large impact on the probability of labor market success.
A. A Human Capital Investment Model without Locus of Control
In a typical human capital investment model without locus of control, individuals weigh the benefits of continued schooling against the benefits of dropping out when deciding whether to complete additional schooling. We assume individuals calculate the present value of future wages following Becker (1993). Suppose there are two possible wage paths,y¯1andy¯2, over T⫹1 periods of time wherey1(t) represents
the wage in periodtfor a person on Path 1 andy2(t) represents the wage in period
tfor a person on Path 2. Furthermore, suppose that the probability of an individual’s receiving Income Path 1 (the ‘‘high-wage path’’) depends upon her stock of human capital which is assumed to be solely determined by whether she has graduated from high school. Let the probability of receiving Income Path 1 for high school graduates bephand the probability of receiving Income Path 1 for high school dropouts be pd. The net present value of expected future wages will differ for high school gradu-ates and high school dropouts because the respective probabilities of receiving the high wage path differ. Let the expected value of wages at timet for high school graduates beE[yh(t)] and that for high school dropouts be E[yd(t)] and define (1) E[yh(t)]
⫽phyt(t)
⫹(l⫺ph)y
2(t)
E[yd(t)]
⫽pdyl(t)
⫹(1⫺pd)y
2(t)
The net present values of future wages for high school graduates,Vh
0, and high school
dropouts,Vd
(2) Vh
0⫽
冱
T
t⫽S
δ(t)E[yh(t)]
Vd
0⫽
冱
T
t⫽0
δ(t)E[yd(t)]
whereδ(t) is the individual’s discount rate for timetand it takesSperiods to com-plete school. An individual will choose to graduate from high school ifVh
0⬎V0dand
otherwise will choose to drop out. The probability of observing an individual gradu-ating from high school is Pr(Vh
0⬎Vd0). We can estimate the effect of individual and
family characteristics on the probability of an individual’s graduating from high school with a reduced-form probit model using variables that influence earnings, determine the discount rate,δ(t), and determine the probabilities of receiving Income Path 1.
B. Adding Locus of Control to the Human Capital Investment Model
We next incorporate locus of control into the human capital investment model. Un-like much of the previous literature we introduce locus of control into the model of the decision to graduate from high school without having to assume that it directly increases an individual’s labor market productivity as it would if it were a measure of ability.
Locus of control ranges from external to internal. Letθmeasure a person’s locus of control where θis continuously distributed on the range (⫺∞,∞); let positive values represent internal locus of control and negative values represent external locus of control. Our key modeling assumption is that a person’s value ofθwill determine her perception of the values ofphandpd—the probabilities that a person receives Income Path 1 if she graduates from high school or drops out respectively. We as-sume that an individual with a value ofθequal to positive infinity will believe that phis equal to 1 or, in other words, that by graduating from high school they will receive Income Path 1 with certainty. Likewise, an individual with a value ofθequal to positive infinity will believe thatpd—the probability of receiving Income Path 1 if he drops out—is zero. An individual with a value ofθequal to negative infinity will believe thatphandpdare equal (to each other and to some constant,p¯). Thus, an individual’s assessment of the probabilities of receiving Income Path 1 is a func-tion of that individual’s locus of control.2In particular, let
(3) ph(θ)
⫽Φ[θ]⫹(1⫺Φ[θ])p¯ pd(θ)
⫽(1⫺Φ[θ])p¯
whereΦis the standard normal cumulative distribution function.
Teenagers with more internal locus of control tend to believe that their actions, such as graduating from high school, will influence the likehood that they receive a high-wage path while teenagers with more external locus of control tend to believe that graduating from high school will have little effect on the likehood of receiving higher wages.3 Thus, the probability that we observe a teenager graduating from
high school is also a function of his or her locus of control. We can estimate this relationship, again, with a reduced-form probit using variables that influence earnings as well as variables which determinine the discount rate,δ(t), andθ, a measure of locus of control.
C. Testable Implications of the Model and Comparisons with a Competing Model of Locus of Control as a Component of Ability
Our model implies that increases in locus of control (becoming more internal) should be observed to increase the likehood that a teenager graduates from high school. Since the probit equation relating locus of control with high school graduation that we propose is a reduced form relationship, it is consistent with other structural mod-els of how locus of control might affect human capital investments. For example, our measure of locus of control might simply be picking up unobserved determinants of ability and thus might increase the probability of graduating from high school. That is, the mechanism by which locus of control affect human capital investment could be quite different than the one we model, yet we would still find a positive relationship in our empirical analysis. Therefore, we wish to identify testable impli-cations of our economic model that will distinguish it from a model where locus of control is an unobserved ability characteristic.
In our model, the perceived probability of receiving the high-wage path conditional upon graduating from high school is greater for teenagers with internal locus of control than for teenagers with external locus of control. Likewise, the perceived probability of receiving the high-wage path conditional upon dropping out of high school is lower for teenagers with internal locus of control than for teenagers with external locus of control. Teenagers with internal locus of control, recall, believe that their actions will greatly influence what happens to them while teenagers with external locus of control believes outcomes are less related to their actions and perhaps are due to chance. This result is obtained by differentiating Equation 3 with respect toθ:
(4) ∂p h(θ)
∂θ ⫽φ[θ](1⫺p¯)⬎0 ∂pd(θ)
∂θ ⫽ ⫺φ[θ]p¯⬍0
whereθis the standard normal density.
Using Equation 4 we can obtain testable implications for the effect of locus of control on expected income conditional upon graduating from high school and on expected income conditional upon dropping out. Recall that values for expected in-come are given by Equation 1. Differentiating Equation 1 with respect toθyields: (5) ∂E[y
h(t,θ)]
∂θ ⫽φ(θ)(1⫺p¯)(y1(t)⫺y2(t))⬎0 ∂E[yd(t,θ)]
∂θ ⫽φ(θ)p¯(y2(t)⫺y1(t))⬍0.
Thus, expected income conditional upon high school graduation is increasing inθ
(as teenagers become more internal) while expected income conditional upon drop-ping out is decreasing inθ.
To see how the testable implications of our model differ from one in which locus of control is a measure of ability, we need to be more specific about how ability affects income. We assume that higher ability individuals are both more likely to receive the high-wage path if they graduate from high school or if they drop out than are lower ability high school graduates and high school dropouts respectively. In addition, we assume that wages in either state are increasing in ability (although this assumption is not needed, as we will see below). Letψindicate an individual’s ability. We assume:
Differentiating Equation 1 with respect toψyields: (7) ∂E[y
Thus both expected income conditional upon high school graduation and expected income conditional upon dropping out of high school are increasing inψ. Note that the sign of the comparative statics would not change if we had assumed that wages in either state were not directly affected by ability.
Therefore, our model of locus of control yields different empirical predictions for expected income conditional upon education attainment than does a model in which a locus of control is a measure of ability.4
locus of control will have an ambiguous effect on expected income overall as can be seen from Equations 8 and 9. Expected income is given by
(8) E[y(t,θ)]⫽E[yh(t,θ)]Prob(I
⫽1⫹E[yd(t,θ](1
⫺Prob(I⫽1))
whereIis an indicator variable which is equal to 1 if the teenager graduates from high school. Differentiating Equation 8 with respect toθ yields:
(9) ∂E[y(t,θ)]
∂θ ⫽
∂E[yh(t,θ)]
∂θ P[I⫽1]⫹E[y
h(t,θ)]∂P[I⫽1]
∂θ
⫹∂E[y d(t,θ)]
∂θ (1⫺P[I⫽1])⫺E[y
d(t,θ)]∂P[I⫽1]
∂θ
which can be positive or negative.
IV. Data
The data for this study come from the baseline through third follow-up surveys of the NELS. The baseline survey was conducted in 1988 and collected background, cognitive, and psychological data from eighth grade students as well as data from the students’ teachers and schools. Three follow-up surveys were con-ducted at two-year intervals following the baseline survey. Thus, the third follow-up survey occurred in 1994—roughly two years after most students would have graduated from high school. Importantly, as part of the third follow-up survey, infor-mation was collected on students’ graduation status and college attendance as well as their expected income and occupation at age 30. Students who did not graduate but received a General Equivalency Diploma (GED) are included with the high school dropouts.5
The NELS sample is from a nationally representative sample of 1,000 schools; 25,000 eighth graders were initially selected from these schools. For the third follow-up survey, only 14,915 of these students were recontacted. Our sample consists of the 13,720 of these teenagers who had nonmissing eighth grade locus of control.
The NELS contains scales measuring locus-of-control as part of the base-year student questionnaire. Items for the locus-of-control scales were derived from Rot-ter’s (1996) internal-external control scale.6The items were measured on a four point
Likert scale ranging from ‘‘strongly disagree’’ to ‘‘strongly agree’’. Each item was individually standardized to a mean of zero and a standard deviation of 1 and the composite scale is the average of the standardized scores of the individual question-5. Cameron and Heckman (1993) suggest that including GED recipients with high school dropouts is appropriate.
6. Items that make up the Locus of Control Scale include responses to the following questions: How do you feel about the following statements?
naire items. Standardized tests (math, reading, science, and history) were adminis-tered in the base year survey, when students were in the eighth grade.7
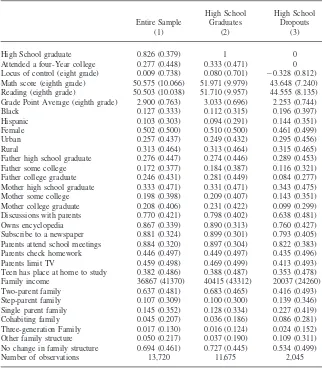
Table 1 reports summary statistics for our entire sample of teenagers and sepa-rately for high school graduates and dropouts. 83 percent of the sample graduated from high school and 28 percent attended a four-year college. High school dropouts come from poorer families, are more likely to be black, Hispanic, and to live in urban neighborhoods than are high school graduates. Moreover, high school dropouts had lower scores in both math and reading and had more external locus of control in the eighth grade. Since locus of control is correlated with ability (for example, the correlation between eighth grade locus of control and eighth grade math ability is 0.286), we use the rich set of measures of cognitive ability available in the NELS as controls in our probit analyses.
V. Probit Analysis of the Effect of Locus of Control
on Investments in Education
We estimate the relationship between locus of control and educa-tional attainment using probit models. We examine two measures of education attain-ment: high school graduation and four-year college attendance. Table 2 reports the key results of the probit models in the form of the marginal changes in the probability of graduating from high school (or attending a four-year college) holding all other variables at their mean values.
Column 1 of Table 2 reports the results of a specification that includes controls for race, ethnicity, gender, whether the teenager lived in an urban or rural neighborhood, region, and the teenager’s eighth grade locus of control. Locus of control in the eighth grade is a strong and statistically significant predictor of whether the teenager will graduate from high school. A one-standard deviation increase in locus of control is estimated to lead to a 6.8 percentage point increase in the likelihood of graduating from high school (0.068⫽0.738⫻0.092).
Column 2 reports the results of a specification which also includes results from reading, math, science, and history tests given in the eighth grade, grade point aver-age, and controls for father’s and mother’s education. Math ability in the eighth grade is highly correlated with the teenager’s high school graduation status six years later. Reading, science, and history scores, on the other hand, neither have a sizeable nor a statistically significant effect on the likelihood that a teenager will graduate from high school. Including the additional controls reduces the estimated marginal effect of locus of control but it is still statistically significant. A one-standard devia-tion increase in locus of control is estimated to lead to a 1.6 percentage point increase in the probability of graduating from high school (0.016⫽ 0.738⫻ 0.022). The effect of locus control on high school graduation is large, but not quite as large as the effect of math ability. For comparison, note that a one-standard deviation increase in math ability is estimated to increase the probability of graduating from high school by 5 percentage points (0.050⫽10.07⫻0.005).
Table 1
Summary Statistics for the Entire Sample and by High School Graduation Status
High School High School Entire Sample Graduates Dropouts
(1) (2) (3)
High School graduate 0.826 (0.379) 1 0
Attended a four-Year college 0.277 (0.448) 0.333 (0.471) 0 Locus of control (eight grade) 0.009 (0.738) 0.080 (0.701) ⫺0.328 (0.812) Math score (eighth grade) 50.575 (10.066) 51.971 (9.979) 43.648 (7.240) Reading (eighth grade) 50.503 (10.038) 51.710 (9.957) 44.555 (8.135) Grade Point Average (eighth grade) 2.900 (0.763) 3.033 (0.696) 2.253 (0.744)
Black 0.127 (0.333) 0.112 (0.315) 0.196 (0.397)
Hispanic 0.103 (0.303) 0.094 (0.291) 0.144 (0.351)
Female 0.502 (0.500) 0.510 (0.500) 0.461 (0.499)
Urban 0.257 (0.437) 0.249 (0.432) 0.295 (0.456)
Rural 0.313 (0.464) 0.313 (0.464) 0.315 (0.465)
Father high school graduate 0.276 (0.447) 0.274 (0.446) 0.289 (0.453) Father some college 0.172 (0.377) 0.184 (0.387) 0.116 (0.321) Father college graduate 0.246 (0.431) 0.281 (0.449) 0.084 (0.277) Mother high school graduate 0.333 (0.471) 0.331 (0.471) 0.343 (0.475) Mother some college 0.198 (0.398) 0.209 (0.407) 0.143 (0.351) Mother college graduate 0.208 (0.406) 0.231 (0.422) 0.099 (0.299) Discussions with parents 0.770 (0.421) 0.798 (0.402) 0.638 (0.481) Owns encyclopedia 0.867 (0.339) 0.890 (0.313) 0.760 (0.427) Subscribe to a newspaper 0.881 (0.324) 0.899 (0.301) 0.793 (0.405) Parents attend school meetings 0.884 (0.320) 0.897 (0.304) 0.822 (0.383) Parents check homework 0.446 (0.497) 0.449 (0.497) 0.435 (0.496) Parents limit TV 0.459 (0.498) 0.469 (0.499) 0.413 (0.493) Teen has place at home to study 0.382 (0.486) 0.388 (0.487) 0.353 (0.478) Family income 36867 (41370) 40415 (43312) 20037 (24260) Two-parent family 0.637 (0.481) 0.683 (0.465) 0.416 (0.493) Step-parent family 0.107 (0.309) 0.100 (0.300) 0.139 (0.346) Single parent family 0.145 (0.352) 0.128 (0.334) 0.227 (0.419) Cohabiting family 0.045 (0.207) 0.036 (0.186) 0.086 (0.281) Three-generation Family 0.017 (0.130) 0.016 (0.124) 0.024 (0.152) Other family structure 0.050 (0.217) 0.037 (0.190) 0.109 (0.311) No change in family structure 0.694 (0.461) 0.727 (0.445) 0.534 (0.499)
Number of observations 13,720 11,675 2,045
Note: Statistics are weighted. Means are reported and standard errors are reported in parentheses.
Coleman
and
DeLeire
711
Effects of Locus of Control on Educational Attainment: Marginal Effects from a Probit Analysis
Graduated from High School Attended a four-Year College
(1) (2) (3) (4) (5) (6) (7) (8)
Locus of control 0.092 0.022 0.019 0.019 0.113 0.014 0.008 0.007
(0.004) (0.004)* (0.004)* (0.004)* (0.006)* (0.006)* (0.006) (0.006)
Math — 0.005 0.005 0.005 — 0.008 0.008 0.008
(.0005)** (.0005)** (.0005)** (0.001)** (0.001)** (0.001)**
Reading — ⫺0.0004 ⫺0.001 ⫺0.0005 — 0.002 0.002 0.002
(0.0005) (0.0005) (0.0005) (0.001)* (0.001)** (0.001)*
GPA (eighth grade) — 0.099 0.094 0.086 — 0.146 0.141 0.136
(0.004)* (0.004)* (0.004)* (0.007)* (0.007)** (0.007)*
Black ⫺0.091 ⫺0.013 ⫺5.3e6 0.014 ⫺0.056 0.090 0.104 0.112
(0.011) (0.008) (0.008) (0.007) (0.011)* (0.015)* (0.016)** (0.016)*
Hispanic ⫺0.066 0.008 0.018 0.016 ⫺0.094 0.042 0.056 0.056
(0.012) (0.008) (0.008)* (0.008)* (0.012)* (0.017)* (0.017)** (0.017)*
Female 0.026 0.010 0.010 0.011 0.034 0.027 0.026 0.026
(0.006) (0.006) (0.005) (0.005)* (0.008)* (0.008)* (0.008)** (0.009)*
Parents’ education No Yes Yes Yes No Yes Yes Yes
Parenting controls No No Yes Yes No No Yes Yes
Family structure No No No Yes No No No Yes
Observations 13,720 13,009 13,009 12,896 13,720 13,009 13,009 12,896
locus of control is estimated to lead to a 1.4 percentage point increase (0.014⫽ 0.738⫻0.019) in the probability of graduating from high school.
Columns 5 through 8 report similar specifications for the probability that the teen-ager has attended a four-year college by the time of the third follow-up survey. Column 5 reports the results of a sparse specification with only controls for race, ethnicity, gender, urban, rural, region, and locus of control. Eighth grade locus of control has a large and statistically significant impact of the probability of college attendance; a one-standard deviation increase in locus of control is estimated to increase the probability of attending college by 8.3 percentage points (0.083 ⫽ 0.738⫻0.113).
Columns 6, 7, and 8 add controls for test scores and parent’s education, parenting behavior, and family structure respectively. In the most expansive specification, re-ported in Column 8, a one-standard deviation increase in math ability is estimate to lead to a 8.1 percentage point (0.081⫽10.07⫻0.008) increase in the probability of college attendance while a one-standard deviation increase in reading ability is estimated to lead to a 2 percentage point increase in the probability of college atten-dance (0.020⫽10.04⫻0.002). In this specification, locus of control is no longer an important nor statistically significant determinant of college attendance. A one-standard deviation increase in locus of control is estimated to increase the probability of attending college by 0.5 percentage points (0.005⫽ 0.738 ⫻ 0.007) and this effect is not statistically different from zero.
VI. Testing the Implications of the Economic Model of
Locus of Control Versus a Model in which Locus
of Control is a Component of Ability
In Section III, we describe the testable implications of our economic model of locus of control that would distinguish it from a model in which locus of control is simply measuring an unobserved component of ability. In our model, teen-agers with an internal locus of control believe that they will be more likely to receive the high-wage path conditional upon graduating from high school than do teenagers with external locus of control. Conversely, teenagers with internal locus of control believe that conditional upon not graduating from high school, they will be less likely to receive the ‘‘high-wage path’’ than do teenagers with external locus of control. If locus of control were a component of ability, then higher ability students should expect to be more likely to receive the ‘‘high-wage path’’ irrespective of graduating from high school than do otherwise identical lower ability students.
Fortunately, in the NELS we have two measures of teenagers’ expectations for the future that we can use to test the implications of our model of locus of control. The two measures are expected income at age 30 and expected occupation. Both measures are asked in the third follow-up survey, after the decision to graduate has already occurred. We separate expected occupations into high-skill and low-skill occupations.
condi-tional upon graduating from high school, than do teenagers with external locus of control. Importantly, it also implies that teenagers with internal locus of control should expect lower incomes and to be less likely to be in a high-skilled occupation, conditional upon not graduating from high school, than do teenagers with external locus of control. If locus of control were a measure of ability, then teenagers with internal locus of control should expect higher incomes and to be more likely to be in a high-skilled occupation than do external teenagers irrespective of high school graduation status.
To test between these competing hypotheses, we estimate the following regression models:
(10) E[y30]
⫽βyX ⫹γy
1Internal⫹γy2Neutral
⫹δy
1Internal∗Educ⫹δy2Neutral∗Educ⫹δy3Educ⫹vy;
(11) E[Occ30]
⫽β0X
⫹γ0
1Internal⫹γ02Neutral
⫹δ0
1Internal∗Educ⫹δ02Neutral∗Educ ⫹δ03Educ ⫹v0.
E[y30] is expected income at age 30 andE[Occ30] is expected probability of being
in a high-skilled occupation at age 30. Internal is a dummy variable indicating whether the teenager’s eighth grade locus of control is in the top quartile.Neutral is a dummy variable indicating whether locus of control is between the 25th and 75th percentiles. The omitted locus of control category includes those whose locus of control is in the bottom quartile.Educis a dummy variable indicating whether the teenager has graduated from high school as of the third follow-up survey. In an alternative set of models,Educindicates whether the teenager has attended a four-year college as of the third follow-up survey.
Table 3 reports the results from OLS regressions estimating Equations 10 and 11 when we condition teenagers’ expectations upon graduating from high school. The first three columns of Table 3 report the results for age 30 expected income while the last three columns report the results for expected probability of being in a high-skilled occupation at age 30.
Column 1 of Table 3 reports predicted expected income for three groups, those with internal, neutral, and external locus of control. Controls include race, ethnicity, gender, and region. Internal teenagers expect a greater amount of income than either neutral or external teenagers, but the expectations for the three groups are not statisti-cally significantly different from one another.
Column 2 of Table 3 reports predicted expected income for six groups—high school graduates with internal, neutral, and external locus of control and high school dropouts with internal, neutral, and external locus of control without additional con-trols. Internal high school graduates expect higher income than do external high school graduates. However, internal high school dropouts expect lower income than do external high school dropouts. The same pattern is exhibited in Column 3, which reports a specification that also controls for race, ethnicity, gender, urban, rural, and region. Internal high school graduates expect to earn more than external high school graduates. However, internal high school dropouts expect to earn less than external high school dropouts.
The
Journal
of
Human
Resources
Table 3
Conditional Expectations of Internal and External Teenagers: High Schoo1
Age 30 Income Expectations Age 30 Occupation Expectations
(1) (2) (3) (4) (5) (6)
High school graduates and dropouts
Internal locus of control 46,988 — — 0.442* — — (1,943) (0.008)
Average locus of control 46,181 — — 0.434* — — (2,511) (0.011)
External locus of control 45,980 — — 0.324* — — (2,688) (0.011)
High school graduates
Internal locus of control — 49,426*** 48,788 — 0.442* 0.478* (1,556) (2,116) (0.007) (0.009) Average locus of control — 47,171 47,062 — 0.469* 0.462* (1,780) (2,608) (0.008) (0.011) External locus of control — 45,086 44,901 — 0.370 0.354
(2,120) (2,907) (0.009) (0.012) High school dropouts
Internal locus of control — 40,100* 36,665* — 0.144* 0.241 (3,490) (3,582) (0.015) (0.015) Average locus of control — 43,557 41,487 — 0.293 0.278
(4,229) (4,678) (0.018) (0.020) External locus of control — 51,056 48,956 — 0.266 0.246
(3,376) (3,975) (0.014) (0.017) Controls Yes No Yes Yes No Yes
Coleman
and
DeLeire
715
Conditional Expectations of Internal and External Teenagers: College
Age 30 Income Expectations Age 30 Occupation Expectation
(1) (2) (3) (4) (5) (6)
College attendees and non-attendees
Internal locus of control 51,727 — — 0.526H — —
(2,010) (0.012)
Average locus of control 46,953 — — 0.515H — —
(2,424) (0.015)
External locus of control 51,130 — — 0.420 — — (2,803) (0.017)
College attendees
Internal locus of control — 57,150*** 56,677 — 0.601* 0.622* (1,822) (2,393) (0.011) (0.014) Average locus of control — 48,975 48,997 — 0.581* 0.580* (2,109) (2,760) (0.013) (0.017) External locus of control — 49,974 50,440 — 0.512 0.518
(3,180) (3,644) (0.019) (0.022) College nonattendees
Internal locus of control — 47,531 44,761* — 0.347* 0.395* (2,144) (2,516) (0.013) (0.015) Average locus of control — 44,760*** 44,608 — 0.453* 0.439* (2,305) (3,024) (0.014) (0.018) External locus of control — 51,358 51,650 — 0.365 0.349
(2,678) (3,347) (0.016) (0.020) Controls Yes No Yes Yes No Yes
skill occupation; a similar pattern of results is found. Internal teenagers are more likely to expect to be in a high skill occupation than are external teenagers. Moreover, internal high school graduates are more likely to expect to be in a high skill occupa-tion than are external teenagers. On the other hand and as in the case of expected income, internal high school dropouts are less likely to expect to be in a high skill occupation than are external high school dropouts, though this difference is both small and is not statistically significant in the specification with additional control variables.
Table 4 reports analogous results from OLS regressions estimating Equations 10 and 11 when we condition teenagers’ expectations upon attending a four-year col-lege. A similar pattern of results is found for expected income at age 30; internal college attendees expect higher income than do external college attendees while inter-nal nonattendees expect lower income than do exterinter-nal nonattendees. However, the results for expectations for being in a high skill occupation at age 30 do not follow this pattern when we condition upon college attendance. Both internal college attendees and internal college nonattendees are more likely to expect to be in a high skill occupa-tion than do external college attendees and external college nonattendees respectively. With the exception of occupational expectations conditioning upon college atten-dance, the patterns of results for income and occupational expectations correspond to that predicted by our human capital investment model incorporating locus of con-trol and are inconsistent with a model in which locus of concon-trol is a proxy for unob-served ability.
VII. Discussion and Robustness Checks
The results reported in Section V show that having an internal locus of control is an important determinant of educational attainment. Moreover, the re-sults reported in Section VI suggest that locus of control is consistent with our eco-nomic model rather than merely representing an aspect of cognitive ability. While locus of control is correlated with cognitive ability it appears to be measuring some-thing distinct.
A major concern remains. If academic success and other positive events in a teen-ager’s life lead him or her to become more internal, we would likely be overstating any causal effect of locus of control.
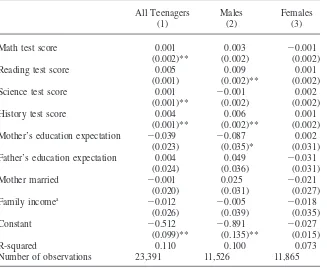
Fortunately, the NELS measures each teenager’s locus of control at the eighth and twelfth grades. In addition, many other variables including cognitive test scores, parental expectations for educational attainment, mother’s marital status, and family income are also measured at both of these grades. Therefore, it is possible to estimate how changes in these variables—test scores, parental expectations, marital status, and income—relate to changes in the teenager’s locus of control using a fixed effects model. While the model does not determine whether changes in these variables caus-ally determine locus of control or vice versa, controlling for fixed effects should eliminate any constant unobserved variable that determines both locus of control and, for example, cognitive test scores.
vari-Table 5
Determinants of Locus of Control: Fixed Effects Models
All Teenagers Males Females
(1) (2) (3)
Math test score 0.001 0.003 ⫺0.001
(0.002)** (0.002) (0.002)
Reading test score 0.005 0.009 0.001
(0.001) (0.002)** (0.002)
Science test score 0.001 ⫺0.001 0.002
(0.001)** (0.002) (0.002)
History test score 0.004 0.006 0.001
(0.001)** (0.002)** (0.002) Mother’s education expectation ⫺0.039 ⫺0.087 0.002
(0.023) (0.035)* (0.031)
Father’s education expectation 0.004 0.049 ⫺0.031
(0.024) (0.036) (0.031)
Mother married ⫺0.001 0.025 ⫺0.021
(0.020) (0.031) (0.027)
Family incomea
⫺0.012 ⫺0.005 ⫺0.018
(0.026) (0.039) (0.035)
Constant ⫺0.512 ⫺0.891 ⫺0.027
(0.099)** (0.135)** (0.015)
R-squared 0.110 0.100 0.073
Number of observations 23,391 11,526 11,865
a. Family income is divided by 10,000.
Note: Models include variables from the base year and second followup waves of the NELS. Standard errors in parentheses. * Significant at 5 percent level; ** Significant at 1 percent level.
ables are the teenager’s locus on control.8We report results for three groups: all
teenagers, males, and females. The results for all teenagers are presented in the first column. Improvements in reading, science, and history test scores are all significantly associated with teenagers’ becoming more internal. This result is particularly true for males and for reading test scores. Surprisingly, for males, increased maternal expectations for education attainment are associated with their becoming more ex-ternal. Unlike for males, for females, no variable is significantly associated with changes in locus of control.
These results suggest that improvements in school performance (as measured by reading scores in particular) may lead male teens to become more internal. If this is the case, then our treatment of locus of control as an exogenously determined
The
Journal
of
Human
Resources
Sensitivity Test Using Locus of Control Measured at Different Ages
Graduated from High School Attended a four Year College
(1) (2) (3) (4) (5) (6) (7) (8)
Tenth grade locus of control 0.076 0.022 0.020 0.021 0.110 0.029 0.025 0.024 (0.004)** (0.003)** (0.003)** (0.003)** (0.005)** (0.006)** (0.006)** (0.006)**
Math — (.0005) 0.004 0.004 — 0.008 0.008 0.008
(0.004)** (.0004)* (.0004)* (.001)** (.001)** (.001)**
Reading — ⫺0.001 ⫺0.001 ⫺0.001 — 0.002 0.002 0.002
(0.0004) (0.0004) (0.0004) (0.0007) (0.0008)* (0.0007)
GPA (eighth grade) — 0.075 0.071 0.064 — 0.151 0.146 0.142
(0.004)* (0.004)* (0.004)* (0.008)* (0.008)** (0.008)*
Black ⫺0.065 0.077 (0.014) 0.023 ⫺0.041 0.112 0.125 0.133
(0.012)* (0.007) (0.006) *(0.006)* (0.013)* (0.017)* (0.017)** (0.018)*
Hispanic ⫺0.072 0.003 0.01 0.008 ⫺0.085 0.047 0.061 0.062
(0.013)* (0.008) (0.007) (0.007)* (0.013)* (0.018)* (0.019)** (0.019)*
Female 0.026 0.006 0.005 0.005 0.054 0.030 0.028 0.029
(0.006)* (0.005) (0.005) (0.005) (0.008)* (0.009)* (0.009)** (0.009)* Observations 13,127 11,892 11,892 11,797 13,127 11,892 11,892 11,797 Twelfth grade locus of control 0.076 0.013 0.013 0.012 0.103 0.017 0.014 0.013
(0.004)** (0.003)** (0.003)** (0.003)** (0.005)** (0.006)** (0.006)** (0.006)*
Math — 0.005 0.005 0.005 — 0.009 0.008 0.008
(.0004)* (.0005)* (.0004)* (0.001)* (0.001)* (0.001)**
Reading — ⫺0.0004 ⫺0.0005 ⫺0.0004 — 0.002 0.002 0.002
(0.004) (0.0004) (0.0004) (0.0007) (0.0007) (0.0007)*
GPA (eighth grade) — 0.078 0.076 0.070 — 0.152 0.147 0.143
(0.004) (0.004) (0.004)* (0.008)* (0.008)* (0.008)**
Black ⫺0.071 0.005 0.013 0.025 ⫺0.041 0.112 0.126 0.135
(0.013)* (0.007) (0.007) (0.006)* (0.013)* (0.017)* (0.017)* (0.018)**
Hispanic ⫺0.085 ⫺0.002 0.005 0.006 ⫺0.098 0.038 0.052 0.051
(0.014)* (0.008) (0.007) (0.007) (0.013)* (0.018)* (0.018)* (0.019)**
Female 0.023 ⫺0.005 ⫺0.004 ⫺0.003 0.045 0.023 0.022 0.021
(0.007)* (0.005) (0.005) (0.005) (0.008)* (0.009)* (0.009)* (0.009)*
Parents information No Yes Yes Yes No Yes Yes Yes
Parenting controls No No Yes Yes No No Yes Yes
Observations 13,179 11,735 11,735 11,638 13,179 11,735 11,735 11,638
Coleman
and
DeLeire
719
Effects of Locus of Control and Math Ability on Expectations
Income Expectations at Age 30 Occupation Expectations at Age 30
(1) (2) (3) (4) (5) (6) (7) (8)
Locus of control 3,980.4 3,887 4,376.1 4,114.4 0.123 0.084 0.120 0.082
(1350.0)** (1440.3)** (1356.2)** (1436.5)** (0.006)** (0.006)** (0.006)** (0.006)**
Math — 272.1 — 299.7 — 0.011 — 0.013
(150.0)** (109.0) (0.001)** (0.001)**
Controls No No Yes Yes No No Yes Yes
Observations 13,720 13,229 13,229 13,229 13,720 13,229 13,229 13,229
Standard errors in parentheses. Complete results are reported in Appendix Table A4. Expected income results are from OLS; Occupational expectation results are marginal effects from a probit model.
personality trait may be incorrect. For females, however, none of these variables can predict changes in locus of control. For this reason, we reestimated our models measuring the effects of locus of control on education attainment for females only and found very similar results (not reported but available upon request).
While changes in locus of control may be determined by changes in school perfor-mance, it is important to recall that we use teenagers’ eighth grade locus of control as our measure. We also reestimated our models using teenagers’ tenth and twelfth grade locus of control and report the key results in Table 6. Using either measure, we obtain similar results as when we use eighth grade locus of control.
Finally, while our results reported in Section VI suggest that locus of control affects teenagers’ expectations in a way that is consistent with our theoretical model, but inconsistent with a model in which locus of control is a measure of ability, one might still be concerned about the extent to which locus of control measures some-thing distinct from cognitive ability. To shed some light on this question, we regress income expectations at age 30 on both eighth grade locus of control and eighth grade math test scores (along with additional controls: race, ethnicity, gender, urban, rural, and region); we also estimate a similar specification using a probit model for expecta-tions of being in a high skill occupation at age 30. For expected income, math ability and locus of control are important determinants of future expectations. A one-stan-dard deviation increase in math ability is estimated to increase expected income by $3,018 (3018⫽10.07⫻299.7) while a one-standard deviation increase in locus of control is estimated to increase expected income by $3036 (3036⫽0.738⫽4114.4). Likewise, both math ability and locus of control are important predictors of the expected probability of being in a high skill occupation. A one-standard deviation increase in math ability is estimated to increase the expected probability of being in a high skill occupation by 13 percentage points (0.13⫽10.07⫻0.013) while a one-standard deviation increase in locus of control is predicted to increase this probability by six percentage points (0.06⫽0.738⫻0.082). These results are reported in Table 7.
VIII. Conclusion
We present a model that implies that locus of control will influence a teenager’s decision to invest in education. It does so through its effect on a teenager’s assessment of the link between his or her actions (graduating from high school) and subsequent outcomes (the likelihood of receiving high wages). This model has the attractive features of both being consistent with the human capital investment model and with psychologists’ concept of locus of control. The empirical results show that eighth grade locus of control exhibits a strong influence on teenagers’ human capital investment decisions. Furthermore, the patterns of teenagers’ expectations are con-sistent with our model of locus of control and are inconcon-sistent with a model in which locus of control is a measure of ability.
more fully examine the role of these and other psychological factors in teenagers’ human capital investment decisions.
References
Andrisani, Paul. 1997. ‘‘Internal-External Attitudes, Personal Initiative, and the Labor Mar-ket Experience of White and Black Men.’’Journal of Human Resources12(3):308–28. ———. 1981. ‘‘Internal-External Attitudes, Sense of Efficacy, and Labor Market Experi-ence: A Reply to Duncan and Morgan.’’Journal of Human Resources16(4):658–66. Bandura, Albert. 1990. ‘‘Reflections on Non-Ability Determinants of Competence.’’ In
Competence Considered, ed. Robert Sternberg and John Kolligan, Jr., 315–62. New Ha-ven, Conn.: Yale University Press.
Becker, Gary. 1993.Human Capital: A Theoretical and Empirical Analysis with Special Reference to Education. Chicago: The University of Chicago Press.
Cameron, Stephen, and James Heckman. 1993. ‘‘The Nonequivalence of High School Equivalents.’’Journal of Labor Economics11(1) Part 1:1–47.
Carton, John, and Stephen Nowicki, 1994. ‘‘Antecedents of Individual Differences in Lo-cus of Control of Reinforcement-A Critical Review.’’Genetic Social and General Psy-chology Monographs120:31–81.
Coleman, James. 1966.Equality of Educational Opportunity/ United States Office of Educa-tion. Washington D.C.: GPO.
———. 1971. ‘‘Equal Schools or Equal Students?’’ InProblems in Political Economy: An Urban Perspective, ed. David Gordon, 190–93. Lexington, Mass.: D.C. Health and Co. Duncan, Greg, and James Morgan. 1981. ‘‘Sense of Efficacy and Changes in Economic
Status—A Comment on Andrisani.’’Journal of Human Resources16(4):649–57. Duncan, Greg, and Rachel Dunifon. 1998. ‘‘Soft Skills and Long Run Labor Market
Suc-cess’’ InResearch in Labor Economics, Vol. 17, ed. Solomon Polochek, 123–49. Stam-ford, Conn.: JAI Press.
Goldsmith, Arthur, Jonathan Veum, and William Darity. 1997. ‘‘The Impact of Psychologi-cal and Human Capital on Wages.’’Economic Inquiry35(4):815–29.
Hanushek, Eric. 1993. ‘‘Comment on Adolescent Econometricians: How Do Youth Infer the Returns to Schooling?’’ InStudies of Supply and Demand in Higher Education, ed. Charles Clotfelter and Michael Rothschild, 57–60. Chicago: University of Chicago Press.
Heckman, James, Jing Jing Hsee, and Yona Rubinstein. 2000. ‘‘The GED Is a Mixed Sig-nal.’’ University of Chicago. Unpublished.
Hill Martha, Sue Augustyniak, Greg Duncan, Gerald Gurin, Patricia Gurin, Jeffrey Liker, James Morgan, and Michael Ponza. 1985.Motivation and Economic Mobility. Ann Arbor: Institute for Social Research.
Maddux, James. 1991. ‘‘Self-Efficacy.’’ InHandbook of Social and Clinical Psychology: The Health Perspective, ed. Charles Snyder and Donelson Forsyth. New York: Pergamon Press. Manski, Charles. 1993. ‘‘Adolescent Econometricians: How Do Youth Infer the Returns to
Schooling?’’ InStudies of Supply and Demand in Higher Educationed. Charles Clot-felter and Michael Rothschild, 43–57. Chicago: University of Chicago Press.
Rotter, Julian. 1966. ‘‘Generalized Expectancies for Internal Versus External Control of Rein-forcement’’ InApplications of a Social Learning Theory of Personality, ed. Julian Rotter, June Chance, and E. Jerry Phares, 260–95. New York: Holt, Rinehart and Winston, Inc. Sherman, Lawrence. 1984. ‘‘Development of Children’s Perception of Internal Locus of