Keynote & Invited Papers Page 1 CURRENT ISSUES IN SCIENCE EDUCATION RESEARCH
David Treagust1*
1Science and Mathematics Education Centre, School of Education, Curtin University, Perth, Australia *[email protected]
Abstract
This presentation will examine some of the unprecedented developments in science education research in the past four decades (1974-2014) when there has been a huge increase in international professional research activities resulting in an increased output of publications in science education research from an increasingly wide range of nations and in a large number of new journals, especially in the English language. In many countries, there has also been an increased amount of professional development initiatives that involve professional societies, employers and universities.
At the classroom level, throughout the past 40 years, there has been a constant call for more relevant science education as illustrated by a growing interest in post-compulsory schooling and how to provide appropriate curricula and assessment in science education. There also have been more calls for greater inclusivity in science education as illustrated by the need for science curricula that do not simply reflect knowledge gains and the social and cultural stereotypes of science.
During this period, there has developed a great diversity of the types of research being conducted in science education. At one end of this spectrum are large-scale assessment programs as illustrated by the Trends in Mathematics and Science Studies (TIMSS) and the Program for International Student Assessment (PISA) studies which provide both national data and international comparisons. At the other end of this spectrum are small-scale studies of the work of science teachers in individual classrooms as illustrated by action research studies and the detailed documentation of expert practices. To be able to conduct studies of this range, over the past four decades, there has been an increasing acceptance of alternative genres of educational research and an acknowledgment of their own strengths and weaknesses.
Keynote & Invited Papers Page 2 DEVELOPING STEM AND ENVIRONMENTAL LITERACY VIA 21ST CENTURY
INSTRUCTION
Rebecca Johnson1*
1Center for Environment, Economy, and Society, Columbia University, New York, USA *[email protected]
Abstract
Since 2013 CEES has colllaborated on the USAID-funded SAInS program with the IPB Faculty of
Mathematics and the Natural Sciences. SAInS stands for “School Action for Innovation in Science”,
and we work to build capacity in STEM pedagogy among IPB faculty as well as high school teachers,
using innovative methods and tools including “fablabs” for design. CEES brings to the collaboration
Keynote & Invited Papers Page 3 GENERATING PEDAGOGICAL CONTENT KNOWLEDGE IN SCIENCE
TEACHER EDUCATION STUDENTS
Ed van den Berg1*
1 Vrije Universiteit and Hogeschool van Amsterdam, Amsterdam, Netherlands *[email protected]
Abstract
One of the key questions in science teacher education is how to get teacher education students to acquire and construct pedagogical content knowledge (PCK), that is knowledge about teaching and learning specific science concepts such as forces, or ecosystems or chemical bonding. For example, how to sequence the concepts involved, which learning difficulties to expect from pupils (misconceptions), which exercises and activities to use, etc. This PCK is partly general, but also partly
local … how to teach about forces to your particular type of pupils in your school with your local
facilities? Teacher education students should not just learn PCK from literature, they should learn how to learn and construct PCK in their own local classroom.
Some pre-service teaching activities can contribute much to the learning of PCK and subsequent teaching as these activities are generating PCK within the pre-service teacher’s own internship classroom. Three examples will be described: preparing exhibitions of science experiments, assessing preconceptions, and teaching using embedded formative assessment in which assessment leads teaching and almost inevitably results in development of PCK. The first one, preparing exhibitions, is very much about learning how to inspire and motivate pupils, a key issue in teaching. The second and
third are about learning to become aware of pupils’ conceptual problems and what to do about them and this in turn can lead to action research in the pre-service student’s own classroom. Throughout the
conference lecture practical examples will be given from the author’s experiences in teacher education
Keynote & Invited Papers Page 4 PATTANI WATERSHED MANAGEMENT FOR SUSTAINABLE IN THE FUTURE
Vichit Rangpan1*
1Yala Rajabhat University, Thailand *[email protected]
Abstract
A review about Southeast Asian watershed management, especially South of Thailand showed that there is a lack of intensive watershed management study. Lot of watershed area have been designed, but many lack information about its biological resources and environment. Howere, I recently studied on natural resources and environmental management in Pattani watershed showed many title of research consist of Quality of Suspended Sediment in Pattani River (QSSP), Utilization Management of Biological Diversity (UMBD), Co-relationship of Conservation and Biodiversity Utilization and People life style (CCBUP), Conservation of Environment and Natural Resources by Participation of People (CENRP), Development of Water Utilization and Approach of Water Quality Sustainable Management (DUWSM), Role of Multiculture Diversity in Preserving and Utilizing of Biological Diversity (RMPUB), Solid Waste Management in Pattani Watershed South Thailand by Community Participation (SMPSC), Effect of Water Quality on Periphyton in the Pattani River (EWPR), A Development of Environmental Management Model of Pattani Watershed in the Future (DEMPF), Local Scientific Lessons on Pattani River Conservation (LSLPC) and The Local Scientific Lessons for Conservation and Utilizing Biological Diversity in Pattani Watershed (LSCUB) as well. Every research title has been encouraged sustainable of Pattani watershed management that follow the theme
of the Conference which is “Enhancement and Acceleration on Research and Learning in Mathernatics and Natural Sciences for the Utilization of Natural Resources” in the diagram.
Keynote & Invited Papers Page 5 CAROTENOIDS: FROM PHOTOSYNTHETIC PIGMENTS TO BIOSOLAR CELLS
Ferdy S. Rondonuwu1*
1Department of Physics, Faculty of Science and Mathematics, Satya Wacana Christian University, Salatiga,
Indonesia
Abstract
Carotenoids are a class of photosynthetic pigments which provide nature with a variety of colors. They are present in photosynthetic organisms, including plants, algae, and bacteria; hence, they are one of the most abundant pigments in nature. In photosynthesis, carotenoids play two important roles: for light harvesting and photoprotection. In light harvesting, carotenoids capture the photons and convert them into a carotenoid singlet excited state of energy, and it is subsequently transferred to a singlet excited state of neighboring (bacterio)chlorophylls within antenna complexes. In a photoprotection function, carotenoids protect excessive light by quenching singlet and triplet states of (bacterio)chlorophyll. Besides their functions in photosynthesis, carotenoids quench harmful singlet oxygen and free radicals by interrupting a sequence of oxidative reaction. The ability of carotenoids to function as antioxidants makes them important molecules to prevent various diseases such as cancer or macular degeneration.
This paper discusses the molecular properties and excited state dynamics of carotenoids free in a solution and bound to pigment-protein complexes. Knowledge of the excited state dynamics is necessary to understand their mechanisms to prevent a harmful oxidative reaction chain and artificial antenna such as a carotenoid solar cell (biosolar cell).
Keynote & Invited Papers Page 6 USING PMRI AND PISA FOR IMPROVING RESEARCH AND LEARNING ON
MATHEMATICS LITERACY OF INDONESIAN STUDENTS
Zulkardi1*
1Mathematics Education Department, Faculty of Mathematics and Natural Sciences, Sriwijaya University,
Palembang, Country
Abstract
In PISA 2012, the rank of Indonesian students on mathematics and science literacy is the same that is 64 over 65 participated countries. Contrary, our students were in the first ranked as the happiest students in the world during they are in the school. The question is why this happened? what and how they learn in the school? This paper aims at sharing two interventions that our group called PMRI team did both in the national level and local level. First, I will share the implementation of Realistic Mathematics Education as an innovation in mathematics education in Indonesia either in the schools or teacher educations. A number of products of long-term effort and research of PMRI such as a portal, a master program, a national contest, an international conference and a center of excellence will be presented. Then, I will also share how to use a design research as a new approach in improving the quality of research and learning of student teachers in teacher education. Finally, results of a design research aims at producing PISA-like tasks will be presented and discussed.
Keynote & Invited Papers Page 7 STATISTICAL AND METHODOLOGICAL INCORRECTNESS IN EDUCATIONAL
RESEARCH
Julius H. Lolombulan1*, Johanis C. F. Repi1
1Department of Mathematics, Faculty of Mathematics and Natural Sciences, State University of Manado,
Minahasa, Indonesia
Abstract
The aim of this paper is to reveal some of the statistical and methodological incorrectness in the area of educational research. Some statistics and methodologies assessed: Titel, Hypothesis, Population and Sample, Normality Test and Variance Homogeneity, Presentation of Tables and Pictures, Bar Chart and Histogram Presentation, Correlational Analysis, Data Analysis, Paired t-test and Unpaired t-test, Using F-tabel and Result of Significant Value, and Control in the Design. In some articles published in a journal, author found quite many incorrectness in statistical methodology. This incorrectness can be classified in three categories. First category is with unsubstantial incorrectness which means the level of incorrectness in the submitted article still can be fixed (some revisions will be needed). Second category is the lack of comprehension that lead into inappropriate interpretation and the third is substantial incorrectness which carried serious mistakes that lead into wrong conclusion.
Keywords: Educational Research, Methodological, and Statistical.
1. Introduction
There are two approaches in research, which are qualitative and quantitative. In quantitative research, planning, execution, data processing, analysis and interpretation are highly depend on the statistical method. Researchers in the educational field are demanded to have a comprehension in statistics and methodology. Insufficient knowledge in statistical method can lead into incorrect conclusion.
Keynote & Invited Papers Page 8 This evidence indicates that positive findings are reported more often in poorly conducted studies than in well conducted one (Dawson and Trapp, 2001).
Avram, et. al. (1985) observed the following; Simple criteria were used to evaluate the statistical analysis in 243 articles from two American Anesthesia journals published in the latter 6 months of 1981 and 1983. Nine percent of the 722 descriptive statistics had major errors, most of which were a description of ordinal data as though they were interval. The incidence of erroneous application of 394 inferential statistical tests was 78%. Nearly three-quarter of the 308 primary inferential statistical errors involved either use of a test for independent samples on related data (and vice versa) or multiple applications of an incorrect test to the same data. Only 4% of the 113 statistics of association were considered erroneous, most because the method was not identified. 15% of the 243 articles in both journals at both times were without major errors in statistical analysis.
Gardner and Bond (1990) reported that of the 45 papers, only 5 (11%) were considered statistically acceptable at submission, but increased to 38 (84%) after publication. Revisions had not been made adequately in 4 of the 7 unsatisfactory published and 3 others were thought to be of dubious validity. A major omission from at least 28 papers was information on sample size calculations.
Gore, et. al. (1992) summarized the criticisms noted by the statistical reviewers for the submitted papers on Lancet journal and for 191 of papers received between November 1990 and June 1991 only 54% were deemed acceptable or acceptable after revision, the others were either recommended for rejection (14%) or for more substantial revision and re-review (32%). Descriptions of methods and of results were found inadequate in about half of the papers and about 25% of them had inadequate abstracts and conclusions. Major error of inference was made in 48 papers and went hand in hand with major criticisms of analysis or design in those papers. In 1997, they reported from 62 reports that appeared as papers and originals (excluding short reports) in 13 consecutive issues of the British Medical Journal included statistical analysis 32 had statistical error and 18 were discovered had fairly serious faults. Glantz (1980) had also stated that approximately half of the articles published in medical journals that used statistical methods contained incorrect use of the method.
Sastroasmoro (2011) proposed 11 kinds of statistical and methodological incorrectness in the design, subjects choosing, measurement, data analysis and result interpretation. These incorrectness were frequently occurred in clinical researches published in credible medical journals.
Based on experience as a scientific research reviewer in Unima, the author found there are many of researchers pay less attention on statistical methodology that lead into incorrect analysis and results.
Keynote & Invited Papers Page 9 Jurnal Teknologi Pendidikan (PS Teknologi Pendidikan PPS UNJ). For the ethical reason the author concealed number, volume, edition and year of publication of reviewed articles.
2. Statistical and Methodological Incorrectness
The following are some of the statistical and methodological incorrectness founded on those publications mentioned earlier.
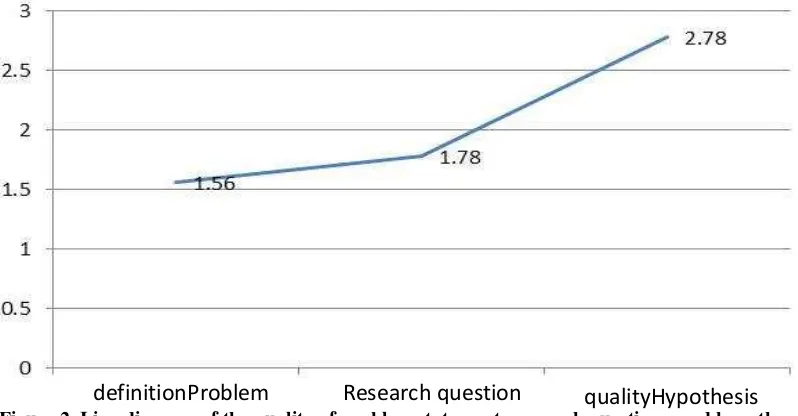
2.1. Title
According to Suhadi Ibnu (2012) the title of the research article is aim to describe the essential work of the study in a very clear manner . All of the research variables, the connection among them and other important information should be revealed clearly in the title. Effendy (2012) proposed that the title of the research paper should give the big picture and essential information about the work of the study that reported in the paper.
The following 3 examples of the research article title were assessed, 1: “Problem Based Learning, Learning Motivation, Initial Competence and The Learning Achievement of SMK student”, 2: “The Knowledge of Learning Strategy, Attitude and Teacher Motivation”, 3: “Minimizing the Misconception in the Electric Circuit Subject Matter with the Predict
-Observe-Explain Learning”. In example 1, the work of the study, research variables and the
interconnection among them are clearly stated. But there are no variables interconnection exposed in the example 2. In the educational research with quantitative approach, the title of the article should provide the big picture of the methodology and the data analysis used. There are 3 kinds of data analysis from the side of the problem formulation that relate to the title of the article, which are descriptive, comparative and correlative. Example 1 pictured the methodology in form of comparative or correlative, in example 2 in the form of descriptive but in does not carry the methodology and the statistical analysis since the researcher connected all of the 3 variables to the learning achievement. In this case the variable of learning achievement does not pictured in the title. In example 3, the treatment and the problematics are clearly pictured, so it is likely a class treatment research, but the researcher used pre-test and post-test control group design. The latter example does not picture the essential content.
2.2. Hypothesis
It found that in some journals including JIP have article that does not stated the hypothesis. Some of them do not stated the statistical hypothesis (Ho and H1) but later stated in the result Ho rejected and H1 accepted. Hypothesis contained in the article should be clearly stated
whether it 1-tailed test or 2-tailed test, if in a particular case a researcher mention “tested in 2
Keynote & Invited Papers Page 10 2.3. Population and Sample
Regarding to the procedure of data collecting, there are two kinds of research, which are experimental research and non-experimental/observational research. Population and sample are acknowledged in non-experimental study whereas there is no such thing as real population in experimental research. The data will be generated through an experiment, different with the non-experimental design, the data already provided in observational unit. For this reason the population in experimental study is not mentioned. It is a mistake to mention the population in experimental study, instead the term used should be observational unit or research subject. In many researches they do not put the reason to get the sample and not so rarely the relatively small population is still taken as a sample. Ideally a research should be done on population not on sample. If a research using a population then there is no need statistical tests (t-test statistics, analysis of variance, regression/correlation analysis) that match with the hypothesis formulation. In sampling, many of studies in determining the sample size using the formulation that not fit with the problem formulation or the goal of the research. If the problem formulation or the goal of the research is comparing two group then the formula use for determining the sample size is (Dawson and Trapp, 2001; Mulyatiningsih, 2012):
2And if the goal of the research is to analyze the relationship between two variables, then the formula for the sample size is (Dawson and Trapp, 2001):
The latter formula is use if the goal of the research is to test the proportion of one population.
2.4. Normality Test and Variance Homogeneity
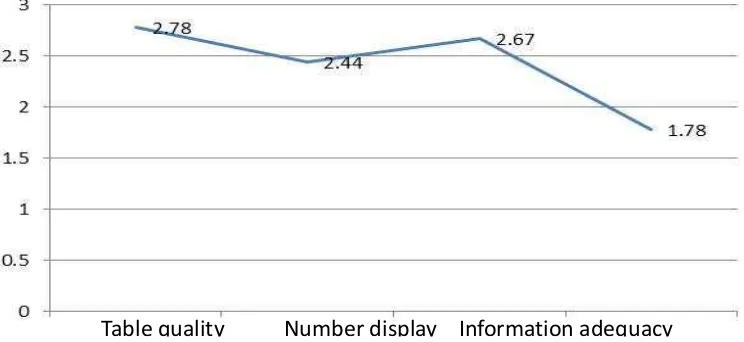
Keynote & Invited Papers Page 11 2.5. Presentation of Tables and Pictures
The purpose of presentations of tables and pictures in a scientific article is for simplification and informative. But, in many articles the presentation of tables or pictures do not simplified the information, in the contrary they adding confusions. That because the title of is too long or contain irrelevant information. In some cases, some of the articles shared the same tables and pictures in the different sections for the same repeated information. In the worst case the information that already represented by tables or pictures all re-presented in the form of narrations. In one of the re reviewed article is found that the result of data analysis presented in tables just use the copy and paste of the same contents which showed that the unnecessary columns and rows in the table.
2.6. Bar Chart and Histogram Presentation
In one of the re reviewed article contain the information of the distribution of ages of participants in categorization form which graphically presented in histogram and not in bar chart. Bar chart should be used if data measured in nominal or ordinal scale, the histogram should be used for categorized continue data (in interval or ratio).
2.7. Correlational Analysis
Many researchers in educational field put in their article the linearity condition in Pearson’s
coefficient of correlation analysis. As the implication, the condition of linearity should always be tested. Linearity test is made if the researchers want to use simple Pearson’s coefficient of correlation formula:
This analysis should follow the model of its equation. If the relationship of X and Y is linear then the formula can be applied. If the relation of those two variables is reciprocal then should use the following formula:
The coefficient of correlation analysis is used to analyze the degree of relationship between two variables X and Y, which is highly depend on its regression model. In the other article the hypothesis test was done twice for regression analysis and correlational analysis. This procedure is unnecessary the t-test result of both tests is same. There is another article in which the researcher used the Pearson’s coefficient of correlation with using the symbol r^2 and r as the coefficient of determination and this not a typing error, in the discussion section r^2 and r were referred as the coefficient of correlation and the coefficient of determination.
2.8. Data Analysis or Statistics
Keynote & Invited Papers Page 12 is an article mentioned using the Mann-Whitney U test for examining the different of the test result of two groups, but the data presented in the factorial design 2x2x2. The incorrectness also happened when in the Method of Analysis section the statistics used is one way multivariate analysis of variance but in the results indicated the use of F-test to compare the different of the mean of two groups in test of three independent variables. In another case, there is a study stated in the method of analysis section the multiple linear regression to analyze the data in the level of α = 5% but in the result using the simple coefficient of correlation analysis for three independent variables with one dependent variable (X1 with Y, X2 with Y and X3 with Y). There is also a study that stated in the discussion and result section the regression analysis but the result is coefficient of correlation without the regression equation.
2.9. Paired t-test and Unpaired t-test
There are still many articles that misused the paired and unpaired t-test. The paired t-test is used if the design using pretest and posttest or in two groups of different observational unit but somewhat can be matched. The unpaired t-test is used when the design in the form of comparing two different groups or treatments. In one article that used pretest-posttest with control group, the researcher tested on one group for one variable by using unpaired t-test. This can be seen in the article that contain “the degree of freedom = n1 + n2 - 2". This can lead to wrong conclusion since for t (0,05; 14) = 2,145, but for t (0,05.28) = 2,043. What if tcalculated = 2,100?
2.10. Factorial Design
The following are examples of the submitted articles with statistical methodology flaws:
In one article, the researcher used factorial design 2x2 and without to mention the
significant of the effect of interaction he/she directly test the inter-cell different. A mistake in test of the simple effect is comparing cells of different column and different row, i.e. a1b2 vs a2b1 and a1b1 vs a2b2. The correct way is to test only the simple effect of the factor A in the level b1 (a1b1 vs a2b1) and in the level of b2 (a1b2 vs a2b2) and the factor B in the level of a1 (a1b1 vs a1b2) and in the level of a2 (a2b1 vs a2b2).
In other study with factorial design 2x2x2 stated the main effect of all significant
factors and the existence of the effect of interaction between the two significant factors and among the three significant factors in its analysis of variance table. The proper way is in the interaction whether it for two factors or for three factors, not necessary to do further test (the test only for the simple effect).
In an experimental research with factorial design it is a mandatory to discuss the interaction effect in simple effect analysis. So it is unnecessary to discuss the main effect. The discussion of the main effect will be useful if the interaction is not significant.
2.11. Using F-table and Result of Significant Value
Keynote & Invited Papers Page 13 comparing the result of F-calculated to the F-table. To put the significant value together with F-table is unnecessary. It is enough to the studies with the data analyzed and processed by
software to put the significant value or p-value. For example, in the result report state: “this
represent the result of the mean value of learning achievement with A treatment is higher than B treatment (Sig. = 0.035)”.
2.12. Control in the Experimental Design
The number of research using design experiment submitted in the journal of education now days is increase. The using of this method including the single factorial design (non-equivalent control group design) and factorial design (more than two factors). It is so common in these designs to come up with the term of “the group of experiment” and the term of “control group”. The experiment group for example is the learning model of problem base learning and the control group for example is conventional learning model. In this design it is a mistake if the group with the conventional learning model to be said as the control group, since that group equal to group with the problem based learning model. Both are treated with certain treatment so those are the experiment group. If in the design of experiment there are two groups, for example the group with problem based learning model and the group with problem based learning model with module, then the first is said to be the control group and the latter is the experiment group. So a treatment group is to be said the control if the controlled treatment applied to the experiment group (The problem based learning is in the control and in the experiment).
3. Conclusion
In some articles published in a journal or education magazine, author found quite many incorrectness in statistical methodology, particularly in education studies with quantitative approach. This incorrectness can be classified in three categories. First category is with unsubstantial incorrectness which means the level of incorrectness in the submitted article still can be fixed (some revisions will be needed). To overcome the problem and to maintain and increasing the quality of study and journals, it is important to consult a study to statistics experts that have good comprehension and familiarity on the research in educational field. It is also crucial for the reviewers to make a comprehensive and accurate assessment to the articles. Since the statistical methodology comprises many aspects, it is to be understood that some statisticians have expertise in certain aspects of methodology. The selectivity of educational journals needed to be maintained, especially for those prominent journals, along with the attention to content credible articles. Second category is the lack of comprehension that lead into inappropriate/weak interpretation or conclusion and the third is substantial incorrectness which carried serious mistakes that lead into wrong conclusion.
The facts that has been described in statistical methodology incorrectness shows there are many incorrectness occurred in educational studies, especially the ones with quantitative approach. This phenomenon may come from the fact there are many researchers have hesitation to consult their research to the statistics experts. The consultation is necessary to develop comprehension and competence in statistics and methodology.
References
Keynote & Invited Papers Page 14 Dawson, Beth and Trapp, Robert G. 2001. Basic and Clinical Biostatistics. Third Edition.
Lange Medical Books/McGraw-Hill Companies Inc. Boston.
Effendy. 2012. Kiat-kiat Menembus Jurnal International. Di dalam Saukah, A dan Waseso, M. G. (Ed.), Menulis Artikel untuk Jurnal llmiah (him. 125 - 147), UM Press, Malang.
Gardner, M.J. and Bond, J. 1990. An Exploratory Study of Statistical Assessment of Papers Published in the British Medical Journal, JAMA, 263 (10): 1355 - 1357.
Glantz, S.A. 1980. Biostatistics: How to Detect, Correct and Prevent Errors in the Medical Literature. Circulation, 16 (1)
Gore, S.M., Jones, I.G., and Rytter, E.G. 1977. Misuse of Statistical Methods: Critical Assessment of Articles In BMJ From January to March 1976. The British Medical Journal, 1: pp. 85-87
Gore, S.M., Jones, I.G., and Thompson, S.G. 1992. The Lancet's Statistical Review Process: Areas for Improvement by Authors. The Lancet Journal, 2: 65 -128.
Lolombulan, J.H. 1999. Penggunaan Metodologi Statistika dalam Penelitian Dosen. Jurnal llmu Pendidikan. 6 (4): 303 -311.
Mulyatiningsih, E. 2012. Metode Penelitian Terapan Bidang Pendidikan. Alfabeta, CV, Bandung.
Sastroasmoro, S. 2011. Kesalahan Metodologis dalam Penelitian Kedokteran. Dalam Sastroasmoro, S. dan Ismael, S. (Eds.). Dasar-dasar Metodologi Penelitian Klinis. Jakarta: Binarupa Askara.
Schor, S. and Karen, I. 1966. Statistical Evaluation of Medical Journal Manuscripts. JAMA, 195(13).
Sugiyono. 2007. Statistik untuk Penelitian, Alfabeta CV, Bandung.
Suhadi Ibdu. 2012. Anatomi Artikel Hasil Pemikiran dan Artikel Hasil Penelitian. Di dalam Saukah, A dan Waseso, M. G. (Ed.). Menulis Artikel untuk Jurnal llmiah (him. 10-21), UM Press, Malang.
Sukardi. 2010. Metodologi Penelitian Pendidikan Kompetensi dan Praktiknya. Bumi Aksara, Jakarta.
Reviewed journals:
Jurnal llmu Pendidikan (LPTK dan ISPI Malang)
Jurnal Pendidikan dan Kebudayaan (Depdikbud)
Polyglot (Fakultas llmu Pendidikan UPH)
Jurnal Pendidikan Matematika (FKIP Universitas Haluoleo dan ISPMS)
Pedagogi: Jurnal llmu Pendidikan (FIP Universitas Negeri Padang)
Forum Kependidikan (FKIP Universitas Sriwijaya)
Invotec: Jurnal Pendidikan Teknologi Kejuruan (FPTK UPI)
Mathedu: Jurnal Pendidikan Matematika (PS Pendidikan Matematika PPS Unesa)
Keynote & Invited Papers Page 15 Jurnal Pendidikan Biologi (Jurusan Biologi FMIPA UM)
Keynote & Invited Papers Page 16 DEVELOPMENT OF SENSOR WITH IMMOBIILIZATION OF ACTIVE
MATERIAL IN ELECTRODEPOSITED POLYMER
Manihar Situmorang1*
1Department of Chemistry, Faculty of Mathematics and Natural Sciences, State University of Medan, Medan,
Indonesia
Abstract
Sensor development with immobilization of active material in an electrodeposited polymer is explained in this paper. Various type of deposited polymers can be used as sensor matrixes due to their ability to immobilize active molecular in the sensing surface. The applications of electrodeposited polymer for the construction of reproducible biosensor and chemical sensor in both electrochemical and spectrophotometric detection systems are described. The construction of uric acid biosensor in electrodeposited polytyramine has been demomonstrated in electrochemical detection system. The uric acid biosensor showed a sensitive response to uric acid with a linear calibration curve lies in the concentration range of 0.1 – 2.5 mM, slope 0.066 µA/mM, and the limit detection was 0.05 mM uric acid (S/N=3). The design of chemical sensor in UV-Vis spectrophotometric detection has also been explained to obtain accurate, selective, sensitive, fast response and simple analytic instrument for the determination of formaldehyde. The detection linearity of formaldehyde sensor lies in the range concentration of 0.1 – 4,0 ppm formaldehyde, where the detection limit is 0.05 ppm formaldehyde.
Keywords: sensor, biosensor, chemical sensor, electrodeposited polymer, polytyramine.
1. Introduction
The development of sensor (biosensor and chemical sensor) by using active materials to identify and determine the concentration of substrates is one of the exciting trends in analytical chemistry to emerge in the last two decades. Integrating of biological or chemical active materials with a transducer to produce a measured signal is the basis of a sensor. A sensor is accounted as a useful tool for analysis because of its compact size, real time analysis, nearly reagentless operation, simple pretreatment protocols, and simplicity of use. Sensor designs employ different transduction methods including electrochemical, optical, mass sensitive and calorimetric, where electrochemical measuring principles dominate the sensor development. The use of electrodeposited polymer is also one approach to the construction of sensors for broad application and the potential to be highly reproducible. This paper reviews sensor principles by using electrodeposited polymer as matrixes to immobilize various types of active materials and their transducers. The specific approaches are explaining the construction of biosensor and chemical sensor in both electrochemical and spectrophotometric detection systems. The uses of electrodeposited polytyramine as a matrix polymer are discussed in particular. A broad range of immobilisation methods including membrane entrapment, physical and chemical adsorption, cross-linking agents, polymeric entrainment, electropolymerised films and covalent attachment are highlighted. The applications of the sensors for analysis of real samples are also discussed.
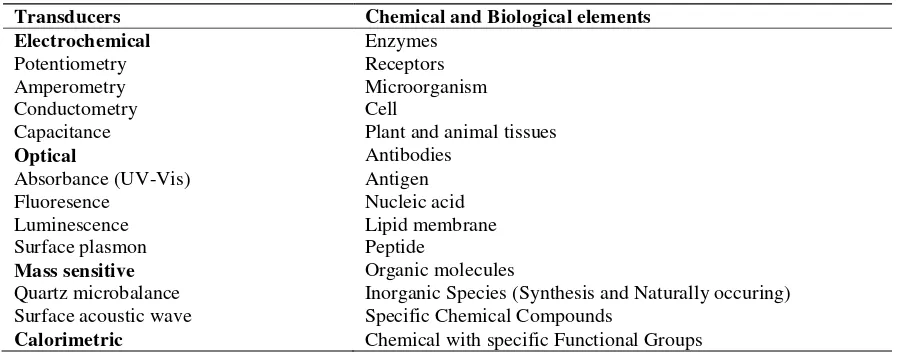
2. Sensor Elements
Keynote & Invited Papers Page 17 concentration of a specific chemical or set of chemicals [1,2]. Sensor could be in the form of biosensor or chemical sensor. The biosensors is incorporating biological sensing elements as sensing agent, while the chemical sensor is exploiting active materials on to a transducer that give response to target analytes. Figure 1 illustrates the features of a sensor, and the components that may be combined to construct a sensor are listed in Table 1. Active materials in the form of chemical and biological components are the most commonly used for recognition in a sensor. The transducers could be classified into those based upon electrochemical, optical, mass sensitive and calorimetric measurements. The sensor designs are frequently directed by the incorporation of active material on the sensing devices that can either be immobilised on the transducer surface or entrapped in a matrix polymer. The recognition elements may act as catalytic and non-catalytic materials, where the catalytic elements could be reused while noncatalytic materials is tend to be used for a single assay.
Figure 1. General scheme of a sensor, it is consisted of the recognition material, transducer and electronic device: where S is a substrate and P is a product, (a) sensor recognition material, (b) Transducer, (c)
Signal readout, (d) Signal amplification and processor, and (e) computer display.
Table 1. Transducers and active materials in biosensor devices
Keynote & Invited Papers Page 18 changes in the electrode potential. The potential is measured at zero current with respect to a reference electrode. Several applications have been reported where an ion selective electrode (ISE) has the broadest area of used potentiometric sensors [6,7]. Amperometric detection is based on measurements of the current in an electrochemical cell where equilibrium is not established. Amperometric devices operate when the substances can undergo oxidation or reduction reactions. The information about the target analyte is generated from the measurement of the current as a function of the applied potential under conditions that enhance polarisation of the working electrode [8]. Various amperometric methods can be used for sensor devices such as square wave, pulse and different pulse, staircase, cyclic, anodic stripping and amperometric titrations. It is appears that amperometric techniques are the most useful for sensors, due to the possibility of obtaining a signal linearly related to the analyte concentration.
Based on fast developing optoelectronic techniques, optical transduction is one of the possible alternatives for sensor construction. Measurements in optical devices are based on the changes on optical parameters due to catalytic reaction at the transducer interface. Real time data could be generated in the sensor since optical assays do not have a time delay. Optical transduction offers a large number of possible sensor categories due to the fact that optical measurements can be used for many different types of spectroscopy such as absorbance UV-Vis, fluoresence, luminescence, evanescent wave, and surface plasmon, where the signal could be recorded with different spectrochemical properties such as in the form of amplitude, energy, polarisation, decay time and phase. However, detection selectivity made by optical transduction is limited. The presence of complex color materials or the materials with similar optical properties may interfere with the measurements. Despite these limitations, numerous optical sensors have been developed for various applications. For example, optical sensors have been developed in our laboratory for the determination of uric acid [9], glucose [10], cholesterol [11], nitrite [12], formaldehyde [13], benzoic acid [14]. Many other compounds that can be determine by using optical sensor as listed in the reference [15].
3. Polymer Films for Sensors Construction
The development of electrochemical devices for sensor construction has made considerable progress. Most of the devices, especially commercial sensors, employ polymers as the immobilisation matrix. In electrochemical devices, the polymer films are used as matrices to immobilise biorecognition and redox mediators, to protect the electrode from fouling and to reduce interferences. The polymer membrane film maintains the enzyme very close to the electrode surface resulting in enhanced sensitivity and linearity of detection. The compatibility of the polymer films and the thickness of the membrane films are key roles in producing stable and reproducible sensors. Various methods have been introduced to incorporate the polymer and active material onto the transduction surface including solvent casting, spin coating [16], and electropolymerisation [17]. Formation of the polymer by solvent casting is simple, that is by placing enzymes and the polymer solution together on the electrode surface and allowing the mixture to evaporate on the transducer surface. However, reproducibility is poor as the thickness is not controlled and uniform coverage is difficult to obtain when it is intended to cast a very thin film.
Keynote & Invited Papers Page 19 the sensing aparatus such as a working electrode. Electrodeposited polymers serve in sensors as convenient matrix for the immobilisation of sensing materials such as enzymes and chemically acive materials. Good detectability and fast response are provided by redox reaction of substrate catalysed by an enzyme in the bulk of the polymer layer. Electropolymerised films can be categorised as conducting or non-conducting polymers. Conducting films are widely used to enhance electron transfer, while non-conducting polymers are important for their permselective characteristics [18].
4. Sensor Based on Electrodeposited Polymer
Electrodeposited polymers are attractive to be used for the development of sensors because the deposited film can be produced rapidly with controlled thickness and porosity and allows the fabrication of reproducible layers. Immobilisation of the biorecognition element in an electrodeposited polymer is of considerable interest in the construction of the sensors. The approach involves the electrooxidation of monomer containing enzyme to form a polymer with entrapped of sensing materials and also electropolymerisation of the monomer followed by attachment of the sensing materials onto the matrix polymer. Electropolymerisation of monomer from a solution containing active material is the simplest method of immobilization of recognition material. The mediator may also be incorporated in the monomer before electropolymerisation, or the mediator may be mixed with monomer and immobilised simultaneously. However, electrochemical immobilisation seems only to be successful for nondenatured active materials. Various types of deposited polymers have been used to immobilise different enzymes onto electrode surfaces [19]. Factors affecting the functioning of amperometric sensors are the electron transfer between the catalytic molecules, usually an oxidase or dehydrogenase, and the electrode surface, most often involving the mediator.
Most electrochemical deposited polymer films used to immobilise active materials are conducting polymers such as polypyrrole, polyacetylene, polythyophene, polyaniline, and polyindole. With a conducting polymer, the thickness of the polymer can be varied from thin to thick due to its conductivity. Conducting polymer-based membranes lack permselectivity toward electroactive interferences such as ascorbic acid, uric acid and paracetamol that can be directly oxidised at the electrode surfaces. Modification of the electrode by building a perselective membrane using nonconducting polymer is effective in improving the selectivity of enzyme electrodes to interferences. Furthermore, reproducible membrane films can be made by using nonconducting polymers because the film is thin as the growth is self-limiting, and thus allows the construction of reproducible sensors [20]. Various nonconducting polymers have been used for enzyme electrodes including overoxidised polypyrrole, polyphenols, polyphenylenediamine, polydichlorophenolindo-phenol and polytyramine where the majority of the approaches have been mainly focused on the electropolymerisation of hetero-atom substituted aromatic compounds.
Keynote & Invited Papers Page 20 considerable control over the response of the sensor. Some of them are explained in more detail in the application of the sensor (biosensor and chemical sensor).
5. Sensor Applications
Rapid growth in active materials associated with sensing techniques has led to remarkable innovation in the design and construction of the sensors. The demands on obtaining fast, sensitive, simple and reliable tools for the analysis of compounds attract increasing attention for the use of the sensors. The sensors have been used for numerous applications for the analysis of compounds in foods, pharmaceutical, industries, biotechnology, clinical, and environmental monitoring. In the past two decades, the medical fields have seen great advances in the development of sensors capable of characterising and quantifying biomolecules. Commercial sensors have also available such as test strips measurements [28]. Application of sensor in forensic science has also been reported [29]. Biosensors and chemical sensor have been widely used for environmental monitoring and control. They are occasionally used to monitor pollutants in aquatic environments such as rivers or drinking water. It would often be preferable to conduct measurements in the field rather than in the laboratory, therefore, electrochemical sensors are promising due to their compact size for a portable device.
6. Example of Sensor By Using Electrodeposited Polymer:
To demonstrate the potential uses of electrodeposited polymer for the construction of sensors, the study have been conducted in our laboratory to show the utility of electrodeposited polytyramine as immobilisation matrixes to immobilise active material in the development of sensors, they are uric acid biosensor and formaldehyde sensor.
6.1. Uric Acid Biosensor
Uric acid biosensor is one of the biosensor constructed by using electrodeposited polymer. The technique explains a simple method for constructing the enzyme electrode through electrodeposition of the polytyramine film in the presence of uric oxidase (UOx) into the surface of platinised glassy carbon electrode followed by coupling reaction between the polymer and the enzyme to produce enzyme based biosensor (GC/Pt/PTy/UOx). The performance of the uric acid biosensor is assessed based on its rapid response, sensitivity, reproducibility, stability, selectivity and its applications to determine uric acid in various types of food samples. The system is based upon a successful for electrochemical biosensors described in previous studies [21-24]. Determination of uric acid by this system is based on enzymatic catalytic reaction:
Uric acid + O2 + 2H2O UOx Allantoin + CO2 + 2H2O2 (1)
H2O2 2H+ + O2 + 2e
(2)
Uric acid is enzymatically oxidise to produce allatoin and hydrogen peroxide in the presence of immobilised UOx in the polytyramine film. The hydrogen peroxide released is then
monitored amperometrically via its oxidation at a constant potential of 0.65V vs Ag/AgCl on
the modified enzyme electrode GC/Pt/PTy/UOx. The measuring current obtained from the biosensor (as shown from equation 1-2) is stoichiometrically equivalent to the concentration of the uric acid in the sample. The details of the study is explained in references.
Keynote & Invited Papers Page 21 7. Electrodeposition and Characterization of Polytyramine Film
Electropolymerization of polytyramine conducted from aqueous tyramine solution containing enzyme produced thin and transparent membrane film that was strongly attached into the electrode surface. The voltammogram of the cyclic voltammetry (CV) for the electrodeposition of polytyramine from tyramine solution contains UOx is presented in figure 2. As the number of cycles was increased the poor conductivity of the polytyramine films resulted in passivation of the electrode and hence a decrease in electrodeposition current. After several cycles, the electrode was sufficiently blocked such that only very low oxidation currents were observed. As with the electropolymerization of other phenols, linking occurs
through the ortho position of the phenol group leaving the amine available for covalent
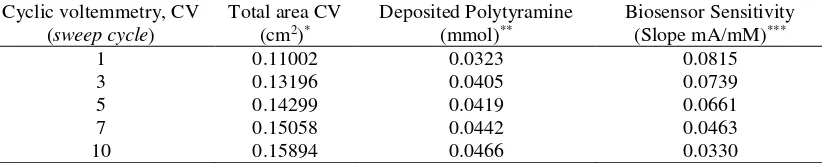
attachment of the enzyme. The amount of polytyramine deposited at each voltammetric cycle was calculated from the charge passed during electropolymerization (Table 2).
Figure 2. Cyclic voltammograms for
electrodeposition of polytyramine onto platinised glassy carbon electrode at a scan rate of 0.5 V s-1 vs
Ag/AgCl in 0.1 M tyramine dissolved in 0.05 M phosphate buffer, pH 6.0 containing uric oxidase. The numbers on the curves indicate the cycle number.
Table 2. Properties of enzyme electrodes and the activity of enzyme UOx that is immobilised in electrodeposited polytyramine with increasing voltammetry cycles.
*Area was calculated by using hydrodinamic method with rotating disc electrode (RDE) ** Calculated based on the current needeed during electropolymerization
***Sensitivity was calculated from calibration curve ofuric acid standard solution
8. Biosensor Response Curves
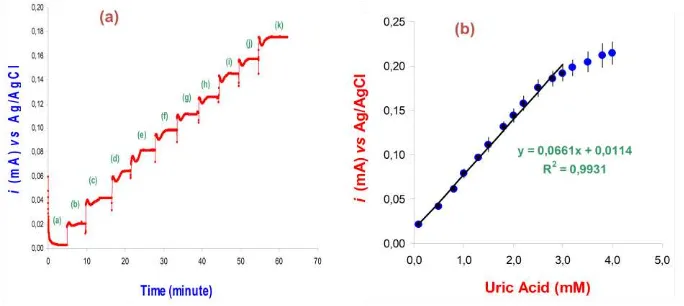
The response of a uric acid biosensor in which uricase is immobilized throughout the membrane is shown in Fig. 3a. Steady state currents for the oxidation of hydrogen peroxide (produced from enzymatic reaction with uric acid) were obtained within two minutes of the addition of uric acid. The current response for the injection of uric acid increased linearly in proportional to the concentration of uric acid (figure 3a). The current signal to the change in uric acid concentration is based on the formation of hydrogen peroxide results from enzymatic catalytic oxidation of uric acid. The signal increased sharply 30 second after the injection of uric acid sample, followed by a decrease in current peak until a steady state current for the oxidation of hydrogen peroxide were obtained within less than two minutes of the addition of uric acid. Calibration curves for uric acid standard solutions were constructed under optimum conditions, shows a linear range concentration from 0.05-0.3 mM uric acid, with a calibration slope of 0.0661 µA mM-1. The response curve in the figure is the average of 5 electrodes made in the same way but on different days with different batches of reagents. The detection
Keynote & Invited Papers Page 22 limit is 0.001 mM uric acid (S/N=3). A very low detection limit accompanied by wide linear
range is necessary for a biosensor to be used to analyse food sample samples without
pretreatment.
Figure 3 (a) Typical current-time curve of steady state current measurement as a function of uric acid concentration: a-k represents the successive injection of 0.1 - 2.5 mM uric acid into phosphate buffer solution (0.05 M, pH 6.0) containing 4% Li2CO3. (b) Uric acid calibration curves for uric acid biosensor.
The membrane was prepared as explained in Figure 2.
The accuracy of the method was demonstrated by comparing the measured concentration with assigned values of uric acid in reference control solutions dan uric acid standard solutions. The concentrations of uric acid in the reference control solutions and uric acid standard solutions analyzed by this present method were mostly within the range of the assigned values (Table 3). The results obtained with the electrochemical biosensor method for food samples also agree well with those obtained by the standard spectrophotometric method [31].
Table 3. The analysis of uric acid in reference standard samples by two methods, the uric acid biosensor and the standard spectrophotometric method. The values are the averages from three measurements
Reference standar Sampel (Sigma Co.)
Uric acid (mM) Recovery
Lable* Spectrophotomtry
UV-Vis** Biosensor***
Standard methodr
Biosen-sor Accutrol Normal 0.0327 0.0315±0.0008 0.0333±0.0001 96 102 Accutrol Elevated 0.0518 0.0490±0.0007 0.0520±0.0004 95 100 Uric acid standard 1 0.0291 0.0291±0.0008 0.0296±0.0003 100 102 Uric acid standard 2 0.0333 0.0316±0.0031 0.0339±0.0001 95 102 Uric acid standard 3 0.0345 0.0339±0.0017 0.0349±0.0003 98 101 Uric acid standard 4 0.0327 0.0320±0.0023 0.0335±0.0001 98 102
* The content of uric acid obtaint from supplier (Sigma Co.)
**Spectrophotometry method was conducted by using o-dianisidine at λ520 nm ***Biosensor was conducted at a constant potential E=0.60 mV vs Ag/AgCl
Keynote & Invited Papers Page 23
Figure 5. Correlation plot for uric acid values in food samples as determined by the present uric acid biosensor and by the standard spectrophotometric method. The best fit line is drown.
9. Formaldehyde Sensor
The design of chemical sensor for the determination of formaldehyde in UV-Vis spectrophotometric detection is another example. The research is aimed to obtain accurate, selective, sensitive, fast response and simple analytic instrument for the determination of formaldehyde. Sensor development is carried out by immobilization of active material of chromatophic acid in a polytyramine polymer matrix that can react selectively with formaldehyde to produce color compounds which is then detected in UV-Vis Spectrophotometer. The details of the study is explained in references [32].
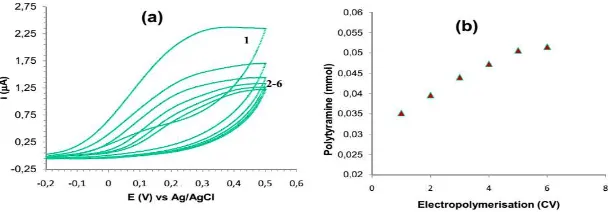
10. Immobilization of Chromatopic Acid onto Conducting Plastic
Polytyramine matrixes is provided from monomer tyramine by electrodeposition techniques similar to that explained in the references [21-24]. The electropolymerization is carried out at 10 sweep cycles by using cyclic voltammetry (CV) and at the same time the chromatophic acid is immobilised in polytyramine film. Typical electropolymerization of polytyramine is shown in Figure 5a, and the amount of deposited polymer in the conducting plastic surface is presented in Figure 5b. The amount of polytyramine deposited in conducting plastic surface is increased as the number of electropolymerization CV increased. An active material of chromatophic acid is also entrapped in the suface of conducting plastic by the aid of polytyramine polymer. The deposited polytyramin is transparent that can be used for spectrophotometry detection system. The chromatophic acid is entrapped in conducting plastic surface followed by laminating to block specific area for optic measurement, and is then situated vertically in quartz cuvette and compatible in UV-Vis spectrophotometry detection system.
Figure 5. (a) Electropolymerization of tyramine and immobilization of chropatopic acid onto a surface of conducing plastic in a solution of 0.1 M tyramin dan 0,01M HCl at 0.0 V and +1.6 V vs Ag/AgCl, (b) The
amount (mmol) of deposited polytyramin during electropolymerization sweep cycle.
Keynote & Invited Papers Page 24 11. Response of Formaldehyde Sensor
The developed formaldehyde sensor is then been used for quantitative determination of formaldehyde. The detection pronciple is based on the reaction of target analyte formaldehyde with active material of chromatophic acid to produce violet color. The reaction is based on the condentation reaction of formaldehyde with chromatophic acid to form violet colour of 3,4,5,6-dibenzoxanthylium that can be detected in UV-Vis spectrophotometer. Typical response of the sensor for the determination of formaldehyde is shown in Figur 6. The presence of formaldehyde in the sample resulted in increase the absorbance provided by the sensor, those are equal to the the concentration of formaldehyde. Spectrometryc detection
sygnal for formaldehyde gave optimum response at 560 nm (Figure 6A signal b). There is no
sygnal is observed at an optimem wavelength in the absence of formaldehyde in the sample solution (Figure 6A signal a). This results demonstrated that immobilization of active material of chromatophic acid is sensitive and selective to formaldehyde. The higher the concentration of formaldehyde in the sample will increase the absorbance provided by the sensor. The detection linearity of formaldehyde sensor is lie on the range concentration of 0.1 - 4 ppm formaldehyde, and the detection limit is obtained at 0.05 ppm formaldehyde.
Figur 6. Typical response of formaldehyde sensor in UV-Vis spectrophotometric detection system in phosphate buffer buffer solution (10 mM, pH 3.0): (a) 3.0 ppm formaldehyde, (b) Blank solution, and (c)
Calibation curve of 0.1-10 ppm formaldehyde standard solution at 560 nm in phosphate buffer buffer solution.
12. Optimization of Formaldehyde Sensor
Figur 7. Calibration curve for 0,1-10 ppm formaldehyde standard solution at 560 nm in phosphate buffer buffer solution (10 mM, pH 1.0 – 8.0). Other experimental parameters are the same as in Figure 6.
Keynote & Invited Papers Page 25 To obtain an optimum condition on formaldehyde sensor, the pH of buffer solution is varied
at pH 1.0 – 8.0. The calibration curve for formaldehyde standard solution at different pH is
presented in Figure 7. It is seen that the buffer condition influenced the sensor sensitivity, where the optimum condition is obtained at pH 3.0. The sensor give a relative high sensitivity at low pH (pH 1.0-5.0) and consistently decrease the sensitivity at high pH condition (pH 6.0
– 8.0). However, the detection linearity is not influenced by the pH condition. Therefore, all
measurement is carried out at pH 3.0.
13. Selectivity of Formaldehyde Sensor
The selectivity of formaldehyde sensor has been examine for formaldehyde in the absence and in the presence of suspected interfering agents. Interferents (2.0 ppm), which are commonly found in food samples are added in to 2.0 ppm formaldehyde standard solution. The single and mixture analytes are determined by using formaldehyde sensor, and the response sensitivity is summarised in Figure 8. The results showed that every single interfering agents give small response in UV-vis spectrophotometer. At high concentration of interfereing agents are also reduce (4-5%) the responses formaldehyde standard solution. However, the sensor is free from interferent when the concentration of interfering agents are low (2 ppm). Ascorbic acid is the most potential interfering agent.
Figur 8. Response selectivity of a sensor into formaldehyde and interference. Single interfering agents (5.0 ppm) and their mixture with 2.0 ppm formaldehyde standard solution is analysed in UV-vis
spectrophotometer at λ 560 nm. Experimental parameter is the same as in Figure 6.
14. Conclusion
The electrodeposited polymer has been demonstrated to be compatible in the production of reprooducible sensor. The application of electrodeposited polymer film as a very good matrix polymer for immobilization of active materials which are suited for the construction of biosensor and chemical sensors. An uric acid biosensor in electrochemical detection system is the example of reproducible biosensor which is developed by using deposited polytyramine. The uric acid biosensor showed a sensitive response to uric acid with a linear calibration curve lies in the concentration range of 0.1 – 2.5 mM, slope 0.066 µA/mM, and the limit detection was 0.05 mM uric acid (S/N=3). Another example of sensor is formaldehyde sensor that is developed by immobilization of chromatophic acid onto a conducting transparent plastic and interfaced in UV-Vis spectrophotometer detection system. The linearity of formaldehyde sensor lies in the range concentration of 0.1-4.0 ppm formaldehyde, where the detection limit is 0.05 ppm formaldehyde.
0
Keynote & Invited Papers Page 26 Acknowledgement
The research grand from Project KOMPETENSI DP2M Kemenristek Dikti Indonesia for funding aspects of this work is gratefully acknowledged.
References
[1]. Turner, A.P.F., (1987), In: Biosensors (ed. Turner, A.P.F.; Karube, I. and Wilson,
G.S.),Oxford University Press. Oxford.
[2]. Hall, E.A.H., (1991), Biosensor, Prentice Hall. Englewood Cliffs, New Jersey.
[3]. Trougakos, I.P., (2013), The Molecular Chaperone Apolipoprotein J/Clusterin as a
Sensor of Oxidative Stress: Implications in Therapeutic Approaches – A Mini-Review,
Gerontology 59:514-523.
[4]. Llandro, J., Palfreyman, J. J., Ionescu, A., and Barnes, C. H. W., (2010), Magnetic
biosensor technologies for medical applications: a review., Med Biol Eng Comput 48:
977-998.
[5]. Situmorang, M., Gooding, J.J., Hibbert, D.B., and Barnett, D., (2001), Development of
Potentiometric Biosensors Using Electrodeposited Polytyramine as the Enzyme
Immobilisation Matrix, Electroanalysis13(18), (2001): 1469-1474
[6]. Situmorang, M., (2005), Pembuatan Sensor Potensiometri Dalam Sistem Flow Injeksi
Analisis Untuk Penentuan Timbal Menggunakan Ionofor Diazacrown, Jurnal Sain
Indonesia 29(2): 55-61
[7]. Situmorang, M., Alexander, P.W., and Hibbert, D.B., (1998), Flow Injection
Potentiometry for Enzymatic Assay of Cholesterol With a Tungsten Electrode Sensor, Talanta49(3): 639-649
[8]. Skoog, D. A., and Leary, J. J., (1992), Principles of Instrumental Analysis, 4th ed., Saunders College Publishers, New York.
[9]. Situmorang, M., Siregar, T.H., Simatupang, R., and Krisnawati, H., (2008),
Spektrofotometri Penentuan Asam Urat Dalam Daging Dan Makanan Kaleng
Menggunakan Pengabsorbsi O-Dianisidin, Jurnal Sain Indonesia 32(2): 109-115
[10]. Situmorang, M., Simanjuntak, E.P., and Silaen, D, (2010), Pengembangan Metode Analisis Spektrofotometry Melalui Reaksi Enzimasi Untuk Penentuan Glukosa Di
Dalam Buah-Buahan, Jurnal Sain Indonesia34(3): 8-14
[11]. Situmorang, M., Silitonga, P.M., Nurwahyuni, I., Siregar, L.S., dan Purba, R., (2012),
Pengembangan Metode Analisis Spektrofotometry Untuk Penentuan Kolesterol Di
Dalam Makanan Tradisional, Jurnal Penelitian Saintika 12(2): 90-97
[12]. Sinaga, M., Sihombing, K., Saputra, A., Hakim, L., and Situmorang, M., (2013), Rancang Bangun Sensor Kimia Sebagai Instrumen Analisis Dalam Deteksi
Spektrofotometri Untuk Penentuan Pengawet Nitrit, Jurnal Penelitian Saintika 13(2):
126-135.
[13]. Sinaga, M., Simanjuntak, H.J., and Situmorang, M., (2013), Rancang Bangun Sensor
Kimia Untuk Penentuan Formaldehida, Prosiding Seminar Hasil Penelitian Lembaga
Keynote & Invited Papers Page 27 [14]. Sinaga, M., Simanungkalit, B., and Situmorang, M., (2013), Pengembangan Sensor
Kimia Untuk Monitoring Pengawet Benzoat di dalam Berbagai Jenis Minuman, Jurnal
Penelitian Saintika 13(1): 1-9.
[15]. Medendorp, J.P., Paudel, K.S., Lodder, R.A., and Stinchcomb, A.L., (2007), Near Infrared Spectrometry for the Quantification of Human Dermal Absorption of
Econazole Nitrate and Estradiol, Pharmaceutical Research,24(1): 186-193.
[16]. Sihombing, E., Situmorang, M., Sembiring, T., and Nasruddin, (2015), The Development Of Mercury Ion Selective Electrode With Ionophore
7,16-Di-(2-methylquinolyl)-1,4,10,13-tetraoxa-7,16-diazacyclooctadecane (DQDC), Modern
Applied Science9(9): In press..
[17]. Situmorang, M., Gooding, J.J., Hibbert, D.B., and Barnett, D., (1999), Potentiometric Biosensor by Using Electrodeposited Polytyramine as Matrix Polymer for Enzyme
Immobilisation, Proceeding of The 7th Research & Development Topics, 6-8
December 1999, Sydney, NSW, Australia, pp: 56-60.
[18]. Situmorang, M., (2012), The Development of Biosensor by Using Electrodeposited
Polymer and its Application, Disajikan dan terbit dalam Proceeding of International
Seminar of Analytical Sciences 2012 (SKAM 25), 12 - 14 November, 2012 di Tiara Convention Centre Medan, Indonesia, pp. 234-244.
[19]. Situmorang, M., (1999), The Utility Of Polytyramine as an Immobilisation Matrix for the Enzymatic Measurement of Analytes in Wine, Proceeding of The Combined 23rd Australian
Society for Biophysics and 3rd Asia Pacific Biosensor Symposium, Tgl 30 September – 3
October 1999, di Goldcoast, Qld, Australia.
[20]. Situmorang, M., Hibbert, D.B., and Gooding, J.J., (2000), An Experimental Design Study of Interferences of Clinical Relevance of a Polytyramine Immobilized-Enzyme Biosensor,
Electroanalysis 12(2): 111-119.
[21]. Situmorang, M., Gooding, J.J., Hibbert, D.B., and Barnett, D., (1998), Electrodeposited Polytyramine as an Immobilisation Matrix for Enzyme Biosensors, Biosensors & Bioelectronics13(9): 953-962.
[22]. Situmorang, M., Gooding, J.J., and Hibbert, D.B., (1999), Immobilisation of Enzyme Throughout a Polytyramine Matrix: A Versatile Procedure for Fabricating Biosensors, Analytica Chimica Acta394(2-3): 211-223.
[23]. Situmorang, M., Gooding, J.J., Hibbert, D.B., and Barnett, D., (2002), The Development of a Pyruvate Biosensor Using Electrodeposited Polytyramine, Electroanalysis14(1), (2002): 17-21..
[24]. Situmorang, M., Hibbert, D.B., Gooding, J.J., and Barnett, D., (1999), A Sulfite Biosensor Fabricated Using Electrodeposited Polytyramine: Application to Wine
Analysis, Analyst124(12): 1775-1779.
[25]. Purba, J., Sibuea, G.V., Tarigan, M.L., Fonica, A., and Situmorang, M., (2013), Sintesis Ionofor Sebagai Bahan Aktif Ion Selektif Elektroda (ISE) Untuk Analisis Penentuan Ion Logam Berat di Dalam Sampel Lingkungan, Jurnal Penelitian Saintika 13(2): 94-104.
[26]. Sinaga, M., Naibaho, R.T., and Situmorang, M., (2013), Rancang Bangun Sensor Kimia Dalam Deteksi Spektrofotometri Untuk Penentuan Pengawet Nitrit, Prosiding Seminar dan Rapat Tahunan BKS PTN-B Bidang MIPA di Bandar Lampung, 10-12 May 2013, pp. 251-255
Keynote & Invited Papers Page 28
[28]. Situmorang, M., Sinaga, B.J., Situmorang, I.F., and Marpaung, F.M.T., (2009),
Rancang Bangun Strip Biosensor Untuk Penentuan Asam Urat Dalam Daging Dan
Ikan Kaleng, Jurnal Sain Indonesia 33(1): 1-7
[29]. Frederickx, C., Verheggen, F.J., and Haubruge, E., (2011), Biosensors in forensic
sciences, Biotechnol. Agron. Soc. Environ.15(4),449-458
[30]. Situmorang, M., Silitonga, P.M., and Nurwahyuni, I., (2011), Pengembangan
Biosensor Sebagai Instrumen Analisis Untuk Menguji Kualitas Makanan dan Minuman, Research Report, UNIMED, Medan.
[31]. Situmorang, M., Simanjuntak, E.P., and Silaen, D., (2010), Pengembangan Metode Analisis Spektrofotometry Melalui Reaksi Enzimasi Untuk Penentuan Glukosa Di
Dalam Buah-Buahan, Jurnal Sain Indonesia34(3): 8-14.
[32]. Sinaga, M., Sihombing, K., and Situmorang, M., (2014), Rancang Bangun Sensor
Keynote & Invited Papers Page 29
ENHANCING STUDENTS’ HIGHER ORDER THINKING SKILLS THROUGH
SCIENCE EDUCATION
Liliasari1*
1Department of Science Education, Faculty of Mathematics and Science Education,
Indonesia University of Education, Bandung, Indonesia
Abstract
To face against the 21st century challenges Indonesian people have to develop their higher order thinking skills. The development of the skills could be done through science education. The science knowledge as vehicle of thought was needed to solve Indonesian people’ problems in their life.It will make them survive and contribute to overcome the world crisis. There are many models of teaching science based on the educational level, from integrated models in primary education, to combined in junior high schools and separated models in high schools up to universities. In the science teacher training institutions the variation of teaching science was also appropriate in-line with teachers’ requirement at schools. Thinking science conducted through students’ generic science skills development and comprehension of multimodal representation of science subjects. Besides the difficulty of subject matter mastery there are also gaps in information spreading in the remote society that should be attack through information communication technology (ICT).
Keywords: science education, higher order thinking skills, generic science skills
1. Introduction
Many challenges have to be faced by Indonesian citizen in the 21st century. Many social
issues had to be overcome by Indonesia people. Asean Community that will be proclaim at
2020 proceed to 2015 based on 3 main pillars i.e. political and peace community, economical community, and socio-cultural community, that tight and strengthen together to guarantee security, stability, and prosperity share in the area (APSC blueprint, 2009). In the development of human resources, there are several agenda to give Asean community better life, especially through education investment and lifelong learning; with training and capacity development using English language, ICT, science and technology implementation, increasing social-economy activity. To get the improvement by educational integration in Asean to build knowledge based community, that have universal access in preliminary education, increasing development and taking care of early childhood, increasing Asean young generation consciousness through education and activity against global competition by open political. Every Indonesian citizenship need to fight to win the competition.
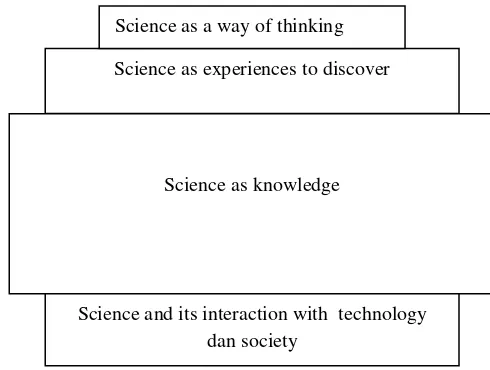
There were 4 dimensions in learning science based on the depth of science matter i.e.: (1) science as a way of thinking; (2) science as experiences to discover; (3) science as knowledge; (4) science and its interaction with technology and society. The differences among this point of views show how students usually learned science. In nature the differences among the views on science learning in Indonesia nowadays can be seen in figure 1.