L
Journal of Experimental Marine Biology and Ecology 251 (2000) 185–203
www.elsevier.nl / locate / jembe
Relations between variable rates of growth, metabolic costs
and growth efficiencies in individual Sydney rock oysters
q
(Saccostrea commercialis)
* Brian L. Bayne
Centre for Research on Ecological Impacts of Coastal Cities, Marine Ecology Laboratories A11, University of Sydney, Sydney, NSW 2006, Australia
Received 15 January 2000; received in revised form 29 February 2000; accepted 4 April 2000
Abstract
Rock oysters from a mass selection trial were compared with wild-caught (control) oysters of the same age to determine the physiological basis for faster growth rates amongst the selected individuals, and to describe the associated flexibility in phenotypic traits of feeding, metabolism and growth. In confirmation of earlier studies, fast growth was associated with faster rates of feeding, reduced metabolic rates and lower metabolic costs of growth. Selected individuals deposited more protein, at a lower metabolic cost, than the controls. Control oysters, however, deposited more lipid than the selected oysters, though the unit costs of lipid deposition did not differ between categories. The results indicated a wide plasticity of physiological rates and efficiencies and demonstrated how, by selection, interactions between physiological traits can serve to enhance growth. If differences in lipid deposition observed here were indicative of different rates of gametogenesis, then the results also suggest that selection alters the balance between growth and reproduction. Whether these differences can be termed compensatory with respect to the life history of the species remains to be determined, but the results indicate some of the ways in which physiological flexibility may be expressed to effect different patterns of energy allocation. 2000 Elsevier Science B.V. All rights reserved.
Keywords: Growth; Costs of growth; Metabolic efficiencies; Oysters; Energetics; Protein and lipid deposition
1. Introduction
Rates of growth by bivalve molluscs are often extremely variable between individuals
q
This species has recently been referred to as Saccostrea glomerata (Gould, 1850), though the basis for this change in status has not been made explicit.
*Tel.: 161-2-9351-4932; fax:161-2-9351-6713. E-mail address: [email protected] (B.L. Bayne).
of the same age (Mallet and Haley, 1983; Dickie et al., 1984; Brown, 1988; Mason et al., 1998). This variability has been exploited in stock selection programmes in order to maximize growth rates in culture (Newkirk, 1980; Sheridan, 1997). There is also evidence that high levels of variance in the underlying physiological (bioenergetic) processes contribute to this plasticity of growth rate (Grant, 1996; Bayne et al., 1999a). And it has been argued (Bayne, 1998) that flexibility of physiological traits, particularly in feeding behaviour, may often be compensatory, helping to maintain high rates of net energy balance in response to changes in the quantity or quality of the available ration. Two questions seem relevant. Firstly, how do interactions between individual physiological traits, such as feeding rates, their associated metabolic costs, and the costs of growth, contribute to variance in growth rate? Secondly, to what extent are these interactions ‘compensatory’ in terms of their contribution to net energy balance? The first question has attracted considerable research effort; the second, less so. For example, we have recently demonstrated that selection for faster growth in two species of oyster, the Sydney rock oyster Saccostrea commercialis (Iredale and Roughley), and the Pacific oyster Crassostrea gigas (Thunberg), is accompanied by selection for faster rates of feeding, lower metabolic rates, higher growth efficiencies, and a reduction in the metabolic costs of growth (Bayne, 1999; Bayne et al., 1999b). These findings supported a variety of earlier studies, not only on bivalve molluscs (Garton et al., 1984; Hawkins et al., 1986; Koehn, 1991; Hawkins and Day, 1996; Bayne et al., 1999a) but also on other taxonomic groups (Present and Conover, 1992; Rist et al., 1997; De Moed et al., 1998; Peterson et al., 1999).
Compensatory responses to changes in food quantity and quality (Bayne, 1998) are based upon flexibility in the rates and efficiencies of linked traits of feeding behaviour. For example, the relationship between the rates of ingestion and of efficiencies of absorption of energy from ingested food varies with the nutritional quality of the ration, resulting in changes to net energy gain that are disproportionate to the change in dietary quality alone (Navarro et al., 1994; Hawkins et al., 1996; Arifin and Bendell-Young, 1997). Wieser (1989) drew attention to a different aspect of physiological compensation, in which high rates of growth are achieved by a change in patterns of energy allocation between competing physiological demands. Compensatory allocations of energy to support growth result in changes in the apparent metabolic costs of component processes (Rombough, 1994; Wieser, 1994). A similar principle may therefore underlie these different aspects of compensatory behaviour, namely the capacity to shift the balance between rates of physiological processes, so as to effect changes in associated efficiencies (feeding, metabolic), which then result in changes to net rates of energy retention.
and Medgysey, 1990), or to compensate for changes in environmental temperature (Clarke, 1993).
Artificial selection for increased rates of growth amongst individuals within a species provides a useful experimental means for investigating these processes. For example, we may postulate that individuals expressing an increased rate of growth will also show increased rates of feeding (the ‘energy acquisition’ model); or altered patterns of energy allocation between maintenance and growth (the ‘energy allocation’ model); or reduced energy costs of growth (the ‘metabolic efficiency’ model); or any combination of these. Experiments with oysters which specifically challenged these models have confirmed some of these effects (Bayne, 1999; Bayne et al., 1999b).
The present experiment was designed, firstly, to confirm or otherwise these earlier findings and, secondly, to do so in the context of growth measured, not just as increased tissue mass, but also as changes in protein, lipid and carbohydrate content. The rationale for this latter objective was as follows. Protein turnover is known to impose a large proportion of the energy costs of both maintenance and growth (Hawkins et al., 1989; Carter et al., 1998). During gametogenesis in bivalve molluscs, there is a high net deposition of lipids, often at the expense of stored carbohydrate (Gabbott, 1975; Zandee et al., 1980). Would selection for high rates of protein growth have, as a consequence, reduced deposition of lipid, as part of a metabolic compensation which maximised growth at the expense of gametogenesis?
2. Materials and methods
2.1. The oysters
Sydney Rock oysters (Saccostrea commercialis) were supplied by the Port Stephens Research Centre at Taylors Beach on the Port Stephens estuary, New South Wales, Australia. They were from two sources. ‘Selected’ oysters were from a programme of mass-selection for growth rate (Nell et al., 1996, 1999). The individuals were fourth-generation selected oysters which originated from an induced spawning of the ‘Loose 2’ line in March 1998 (Nell et al., 1999). The larvae had been reared in the hatchery, allowed to set in late-March 1998, and grown-on at an oyster lease in Cromarty’s Bay, Port Stephens. They were therefore 17 months old when used in the present experiment, which was run during August 1999. ‘Control’ oysters were taken from a cohort of wild spat of similar age, which had set during February and March 1998, and also grown-on in Cromarty’s Bay.
The oysters were graded to be of similar whole weight (shell plus live flesh) and then transferred to a water table in an experimental aquarium at the University of Sydney. Although of similar age and whole weight, the selected oysters had higher dry tissue weight than the controls at the start of the experiment (Table 1).
established and the appropriate concentrations of food cells dosed to each of two trays for each ration level. The trays were arranged randomly in the water table. Water temperature was controlled at 1760.58C and salinity at 3461.5‰. The experiment lasted 24 days, from 9th August to 1st September, 1999.
The remaining oysters (n516 in each category) were weighed for whole weight, then shucked for measurement of dry flesh weight after drying the flesh for 24 h at 808C. The dried flesh was then ground to a powder in a pestle and mortar and used for elemental analysis in a Perkin-Elmer model 2400 series II CHN Analyser, for subsequent estimation of protein, lipid and carbohydrate content (see Section 2.4). These samples are referred to as the ‘initial’ oysters.
Regression analyses were done for dry flesh weight and the mass of the biochemical components as a function of whole weight (shell plus live flesh) in the initial sample, separately for selected and control oysters (Table 1). The fitted parameters of these regressions were then used to estimate dry flesh weight and protein, lipid and carbohydrate content for the experimental oysters at the start of the experiment, from independent measures of their whole weights.
2.2. The rations
The oysters were fed a mixed algal diet comprising three species; Isochrysis galbana (T-ISO strain), Chaetoceros gracilis and Tetraselmis sp. These were provided as algal pastes by Inland Seafarm, Reed Mariculture Inc., San Jose, CA. Diets were made up daily as equal volumes of each species resuspended in seawater and dosed through a variable-delivery pump to the oyster trays, from 08:30 to 16:30 each day, 6 days per week. During the 16 h when algal cells were not dosed to the trays, cell concentrations declined to a common background. With dosing, concentrations rose quickly to the appropriate level and remained constant for the 8-h dosing period. This feeding routine was not only logistically convenient, but has been found to yield good growth rates in the oysters, whilst also facilitating estimation of oyster feeding rates (see below). Cell concentrations in the trays were monitored frequently using a particle counter (Coulter Counter Model Z1).
Three ration levels were established (Table 2). Preliminary measurements of filtration rates, and visual observation of the oysters in the trays, confirmed that they fed rapidly during the dosing period and sporadically, or not at all, during the periods between dosing. The cell concentrations measured during dosing were therefore used to characterise the ration level, ignoring the reduced concentrations typical of the non-dosing period. Feeding rates computed for the full 8 h of non-dosing were then adopted as daily rates. On six occasions over the 24 days of the experiment, samples of the algal cells in suspension, of known concentration, were filtered onto ashed, pre-weighed GF / C filters in order to determine the dry weight of total particulate matter (TPM; mg
21
l ), after drying at 808C overnight. Some of these filters were then also used for elemental analysis (C and N).
2.3. The physiological measurements
21 21
rates of clearance (CR; l h ), oxygen consumption (V ; ml hO2 ) and ammonia
21
excretion (VNH N4 ; mg h ), and faecal and food samples were taken for analysis of absorption efficiency (AE). The procedures were as described by Bayne et al. (1999b). Clearance rates and rates of oxygen consumption were measured at cell concentrations similar to the concentrations in the relevant experimental trays during feeding. Rates of excretion were measured in filtered seawater. The order of measurement across trays and oyster categories (selected and control) was random.
At the end of this measurement period all oysters were weighed for whole weight, shucked and the tissues dried for 24 h at 808C. Dry tissues were then ground to a powder in a pestle and mortar and analysed for C, H and N content (see below).
The physiological rates were standardised to a dry tissue weight of 250 mg using the procedure described in Bayne et al. (1999b). Rates of growth were calculated as the difference between the initial and final measurements of whole animal, dry tissue, protein, lipid and carbohydrate weights, and are presented as daily rates over the 24 days of the experiment.
2.4. The biochemical measurements
The stoichiometric algorithm described by Gnaiger and Bitterlich (1984) was used to convert carbon, hydrogen and nitrogen contents of tissue to their equivalent dry weights of protein, lipid and carbohydrate. Care was taken to keep the powdered tissue samples dry, by oven-drying the pelleted samples immediately prior to their analysis on a Perkin-Elmer Model 2400 Series II CHN Analyser, and ensuring a dry atmosphere in the sample cassette of the analyser. Samples of powdered tissue were also ashed at 4508C for 8 h and the C, H and N contents of this ash determined as a tissue ‘blank’. The Analyser was operated with acetanilide as the standard.
In calculating from the elemental data to equivalent biochemical contents, a value for the mass fraction of residual water in the ash-free dry weight (AFDW) of the tissue samples (vH O2 50.06), and a nitrogen-to-protein conversion factor of 5.8, were adopted, following Gnaiger and Bitterlich (1984). When discussing their technique, Gnaiger and Bitterlich (1984) conclude that ‘ . . . the magnitude of absolute errors in stoichiometric CHN analysis is comparable to the inaccuracies of direct biochemical methods’ (p. 295). This procedure was not used to estimate the biochemical composition of the algal diet, due to complications arising from the high non-protein nitrogen content of these cells. Rather, values were taken from Whyte (1987) and Brown et al. (1989, 1997). These compared well with the ‘nutritional analysis’ of the algal pastes as reported by Inland Seafarms (http: / / www.seafarm.com), although the carbohydrate content of the paste of Chaetoceros reported there (4.7% of dry weight) appears to be unusually low. The values used in this study for the experimental diet (percent of dry weight) were as follows: protein530.167.7, lipid513.867.4 and carbohydrate59.461.9.
2.5. Statistical procedures
of selection category, ration level and replicate trays, on the primary measured variables of feeding rate, absorption efficiency, oxygen consumption, nitrogen excretion and growth, as well as the derived variables such as metabolic and growth efficiencies. In all cases differences between replicate feeding trays were non-significant. Regression analysis was used to relate measured and derived variables to levels of ration, as discussed in the Results.
3. Results
3.1. Oyster weights and biochemical composition at the start of the experiment
The whole weights of selected and control oysters at the start of the experiment (the ‘initial’ series) did not differ significantly (Table 1). The dry flesh of the selected oysters was, however, heavier than that of the controls. For selected oysters:
2
Dry flesh wt. (mg)530.267.33Whole wt. (g)279.2645.5; r 50.57. For control oysters:
2
Dry flesh wt. (mg)515.165.33Whole wt. (g)12.0654.1; r 50.46.
Both protein and lipid contents were significantly higher (P,0.001) in the selected than in the control oysters; carbohydrate contents were similar (P.0.5) in the two categories. Selected and control oysters were distributed at random in replicate trays for each of three rations. An ANOVA confirmed similarity amongst whole weights, for both species, in all six trays, at the start of the experiment.
3.2. Ration conditions
21
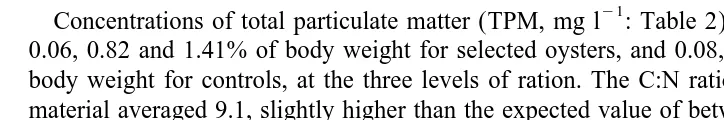
Concentrations of total particulate matter (TPM, mg l : Table 2) were equivalent to 0.06, 0.82 and 1.41% of body weight for selected oysters, and 0.08, 1.20 and 2.06% of body weight for controls, at the three levels of ration. The C:N ratio of this particulate material averaged 9.1, slightly higher than the expected value of between 5 and 8 for an
Table 1
Whole weights, dry flesh weights and biochemical component weights for selected and control oysters at the
a
start of the experiment (the ‘initial’ series)
Oyster Whole Dry flesh Weight of Weight of Weight of
category weight (g) weight (mg) protein (mg) lipid (mg) carbohydrate (mg)
Selected 11.2260.41 240612 11666 3163 4665
Control 10.0160.50 153612 7466 761 4363
P ns ,0.001 ,0.001 ,0.001 ns
a
Table 2
a
Cell concentrations and average biochemical compositions at the three ration levels
Ration Cell conc. TPM C:N Protein Lipid Carbohydrate
6 21 21 21 21 21
The cell concentrations and TPM (total particulate matter) are from direct measurements by Coulter Counter and filtration, respectively, shown as means6S.E. for n56 determinations. Values for the C:N ratio are from elemental analysis by CHN Analyser (n53 at each ration level). Biochemical contents are estimated from the TPM values using percentage compositions reported by Whyte (1987) and Brown et al. (1989, 1997).
algal diet. This may be a consequence of the procedures involved in preparing and preserving these algal pastes, which may result in a slight loss of nitrogen (McCausland et al., 1999). The calculated average protein, lipid and carbohydrate contents of the experimental diet are shown in Table 2.
3.3. Rates of feeding, respiration and excretion
In analysing the physiological data, differences between replicate trays were, in all cases, statistically insignificant. The replicate data have therefore been pooled in the description of the results that follows.
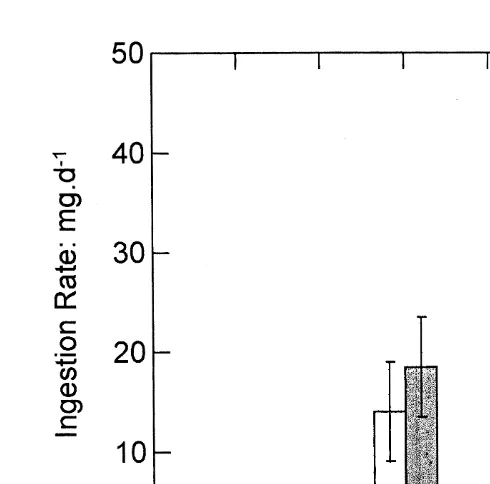
Rates of feeding by the selected and control oysters were similar at low and medium rations, but at high ration the selected oysters showed faster rates. These differences are illustrated for rates of ingestion, as mg per hour for a standard oyster size of 250 mg, in Fig. 1. Clearance rates (litres of water cleared of particles per hour by an oyster of 250 mg) did not differ significantly, for either category of oyster, with change in ration (P.0.10), but the selected oysters had faster rates overall (P,0.01), with a mean of
21 21
2.5660.26 l h compared with 1.6360.20 l h for the controls.
The efficiency with which ingested food was absorbed was very similar across rations and between oyster categories, with an overall mean value of 0.4760.11. Consequently, rates of absorption differed with ration and between categories in a manner similar to that illustrated for ingestion rate.
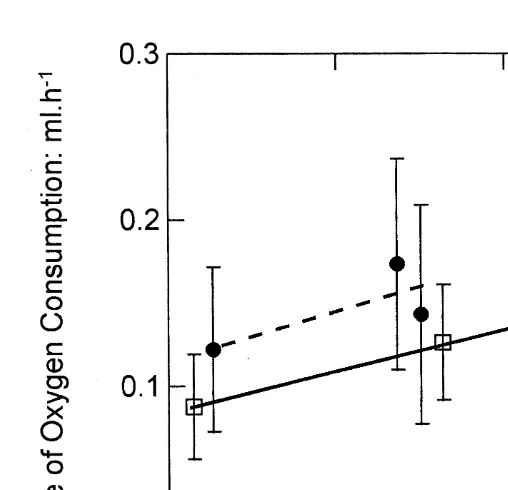
Rates of oxygen consumption, when standardised to a common body size of 250 mg, were higher for control than for selected oysters (P,0.05) and increased with ration
21
(P,0.01), from 0.088 to 0.149 ml O h2 in selected oysters and 0.122 to 0.173 ml O2 21
h in controls. Due to these differences, and to differences in the rates of absorption between oyster categories, selected oysters had markedly lower respiration rates per unit of absorbed ration than did the controls (Fig. 2). For the data illustrated in Fig. 2, the regression slopes are similar but the intercepts (oxygen consumption at zero absorption
21
rate) are significantly different (P,0.01): 0.08360.013 ml O h2 in selected oysters
21
and 0.11760.025 ml O h2 in the controls.
Fig. 1. Rates of ingestion (mg dry matter per day, standardised to a body weight of 250 mg dry flesh) in selected (shaded histograms) and control (unshaded) oysters at three levels of ration (see Table 2 for food concentrations). Values are means623S.E. At high ration, selected oysters had significantly higher ingestion rates than the controls.
21
Mean excretion rates were 5.2060.63 and 4.9060.51 mg NH N h4 for selected and control oysters, respectively, over all ration levels, when standardised to a body size of 250 mg. The molar ratio of oxygen consumed to ammonia-nitrogen excreted increased with ration level (mean values of 21, 36 and 48 for low, medium and high ration, respectively), with no significant differences between selected and control oysters.
3.4. Rates of growth, changes in biochemical composition, and growth efficiencies
Oysters in both experimental categories lost weight at the low ration. Growth was positive at both medium and high ration, however, and the selected oysters grew more quickly than the controls (Table 3). A regression of growth rate (mg dry tissue per day) as a function of the rate of absorption (mg dry matter per day) estimates net growth efficiency (the slope of the fitted regression equation) and the oysters’ maintenance requirement for metabolisable energy (absorbed ration when growth is zero). Growth efficiency was higher in the selected category (Table 4). The maintenance requirement for dry matter for the selected oysters was slightly less than for the controls (0.05.P.
0.04).
Fig. 2. Rates of oxygen consumption (ml oxygen per hour) as a function of rates of absorption (mg dry matter per day) in selected (open squares, full line) and control (filled circles, dashed line) oysters. Values are means623S.E., standardised to a body size of 250 mg dry flesh weight. Per unit absorption rate, oxygen consumption was faster in the control than in the selected oysters.
Table 3
Rates of growth for selected and control oysters at three levels of ration, shown for dry flesh and protein, lipid
a
and carbohydrate contents
21
Oyster Ration Growth rate as mg day : category
Dry flesh Protein Lipid Carbohydrate
Selected Low 20.07860.234 20.18960.136 0.53360.044 20.41760.046 Selected Medium 0.87660.455 0.91260.274 0.63160.073 20.72260.104 Selected High 3.41360.868 2.62060.516 1.09660.122 20.47960.192 Control Low 20.31760.285 0.00160.178 20.07160.006 20.41160.090 Control Medium 0.28660.518 0.29460.329 1.03560.100 21.04060.174 Control High 0.76660.448 0.59560.286 1.18360.098 21.06160.118 P: Categories ,0.01 ,0.005 ns ,0.001 P: Rations ,0.001 ,0.001 ,0.001 ns
a
Table 4
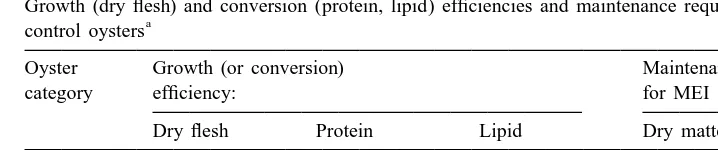
Growth (dry flesh) and conversion (protein, lipid) efficiencies and maintenance requirements in selected and
a
control oysters
Oyster Growth (or conversion) Maintenance requirement
21
category efficiency: for MEI (mg day ):
Dry flesh Protein Lipid Dry matter Nitrogen
Selected 0.2960.07 0.8860.15 0.3460.08 2.5860.45 0.1260.06 Control 0.1460.09 0.2660.21 1.4160.13 3.4060.38 0.0860.04
P ,0.05 ,0.001 ,0.001 ,0.05 ns
a
Efficiencies were estimated as the slopes of regressions of dry flesh, protein and lipid growth as functions of absorption rates for dry matter, protein and lipid, respectively. Maintenance requirements (for metabolisable energy intake, or MEI) were also estimated from these regressions, as absorption of dry matter or nitrogen when growth is zero. Values are means6S.E. for n524 oysters of each category. Values of P are listed from ANOVAs comparing categories; ns, not significant.
protein growth (selected oysters.controls) and the rate of loss of carbohydrate at all rations (control oysters.selected). Over all rations, however, there was no significant difference between the oyster categories for rates of growth in lipid.
Regressions of protein growth as a function of absorbed protein, and of lipid growth as a function of absorbed lipid, were used to estimate the biochemical conversion efficiencies and associated maintenance requirements (Table 4). For growth in protein, efficiencies were higher in selected oysters than in the controls (0.8860.15 and 0.2660.21, respectively, a highly significant difference, P,0.001). For growth in lipid, however, selected oysters expressed a lower efficiency than controls, 0.3460.08 compared with 1.4160.13; this, too, was a highly significant difference. The estimated maintenance requirements for nitrogen were similar for selected and control oysters
21
(Table 4), equivalent to 0.6460.34 mg protein day , or |0.56% of the oysters’ body
protein weight per day.
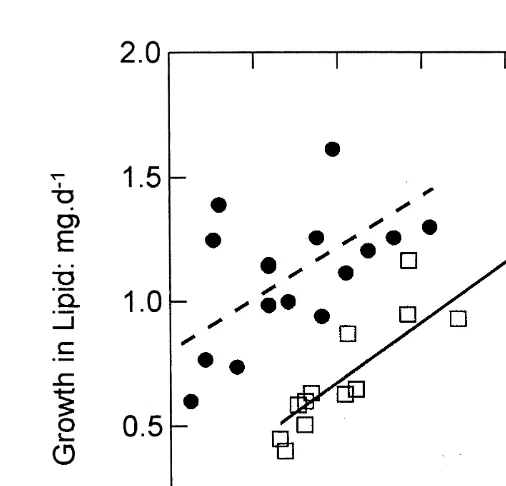
At similar rates of growth in protein, control oysters had faster net deposition rates of lipid than the selected oysters (Fig. 3). The rate of change in body lipids with increasing protein content was similar in the two oyster categories, but control oysters, starting from a lower level for lipid content (Table 1), achieved a significantly higher deposition of lipid per unit deposition of protein, at medium and high ration, than did the selected individuals. This is presumably the result of a higher efficiency with respect to the rate of lipid absorption from the diet (Table 4), and perhaps also a higher rate of conversion of carbohydrate to lipid (Table 3).
At all ration levels, oysters in both categories lost tissue carbohydrates (Table 3). The rate of loss was greater in the controls (P,0.001) but was independent of the amount of total carbohydrate absorbed from the diet.
3.5. Metabolic efficiencies
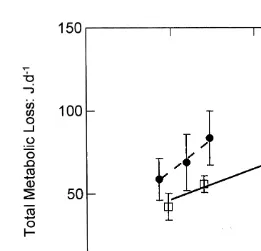
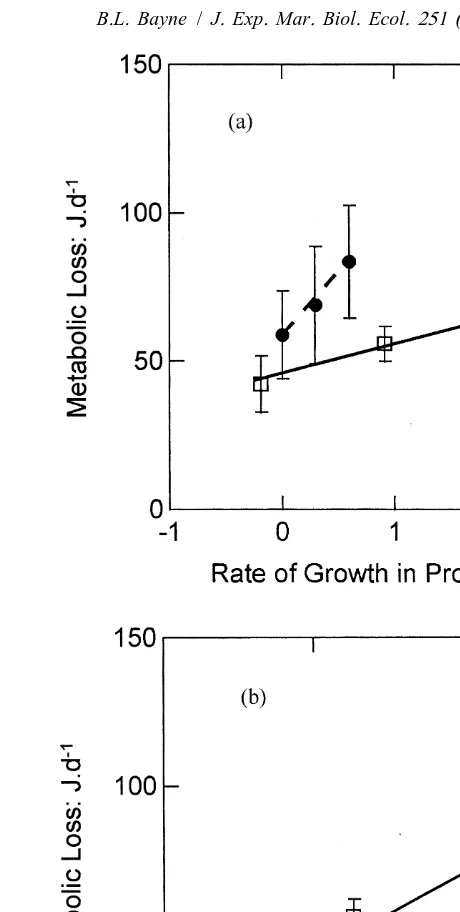
Metabolic rates increased with the rates of growth for oysters in both experimental categories (Fig. 4). The rate of this increase estimates the energy costs of growth (C ), ing
Fig. 3. Rates of growth in tissue lipid as a function of growth in protein (both as mg per day) for selected (open squares, full line) and control (filled circles, dashed line) oysters. The values are for individual oysters at medium and high ration, and have been standardised to a body size of 250 mg dry flesh weight. Per unit growth in protein, control oysters deposited more lipid than did selected oysters.
21
(Table 5). C was significantly higher (Pg ,0.05) for control oysters (0.8160.43 J J )
21 21
than selected oysters (0.3460.10 J J ), equivalent to 17.8 and 7.5 J mg dry tissue , respectively. These values compare with those reported by Peterson et al. (1999) of ca. 6 to .14 joules per mg of dry tissue growth in a variety of animal taxa, and with the
21
‘consensus’ value of Wieser (1994) of 7.2 J mg .
The fitted intercept of this regression estimates the metabolic rate at zero growth (Rmaint; Table 5), and this, too, differed between categories, and was higher (P,0.001)
21 21
for controls (63.666.5 J day ) than for selected oysters (47.664.8 J day ).
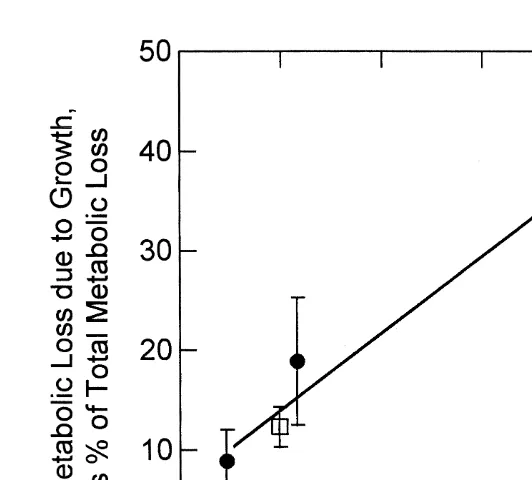
These estimates of the costs of growth were used to compute the proportion of total metabolic losses allocated to growth. This proportion increased with increased rate of growth (Fig. 5) but did not differ between selected and control oysters. At low rates of growth the growth-related metabolic losses amounted to |10% of total metabolic rate,
rising to as high as 35% at the highest growth rates observed (selected oysters at the high ration).
Fig. 4. Metabolic loss (joules per day) as a function of the rate of tissue growth (joules per day) in selected (open squares, full line) and control (filled circles, dashed line) oysters. Values are means623S.E. and have been standardised to a body size of 250 mg dry flesh weight. The fitted regressions (see text) were used to estimate metabolic costs of growth (the slope of the regression) and the maintenance metabolic demand (the intercept, or R when growth is zero). Both of these estimates were significantly higher in control than in selected oysters.
Table 5
21
Fitted values for a and b in the regression model: R5a1b3G; where R is metabolic loss (J day ) and G is
a
growth, either as dry tissue (energy equivalent), or as protein or lipid (mg), per day
2
Oyster Growth a b r
category variable
21
Selected Dry tissue: J day 47.664.8 0.3460.10 0.52 21
Selected Protein: mg day 45.164.1 10.462.5 0.43
21
Selected Lipid: mg day 17.7611.8 52.3612.7 0.31
21
Control Dry tissue: J day 63.666.5 0.8160.43 0.36 21
Control Protein: mg day 58.1618.5 41.7614.1 0.23
21
Control Lipid: mg day 17.7611.8 52.3612.7 0.31
Pdry tissue ,0.005 ,0.001
Pprotein ,0.01 ,0.005
a
Values for a represent the maintenance metabolic requirement (Rmaint), and b represents the metabolic costs
2
Fig. 5. Metabolic losses due to growth (Rgrow), as a percent of total metabolic loss, shown as a function of the rate of growth (joules per day) for selected (open squares) and control (filled circles) oysters. The values are means623S.E. These data are best fit as a common regression: proportional loss57.161.510.35160.0363
21 2
growth rate (J day ) (r 50.76).
growth in lipid were similar in the two groups (Fig. 6B). As discussed above for growth in total tissue mass, the regression of R as a function of protein and lipid growth was used to estimate costs and their associated maintenance metabolic rates (Table 5). The costs of protein growth differed significantly (P,0.01) between categories; 10.4 and
21 21
41.7 J mg , equivalent to 0.44 and 1.77 J J in selected and control oysters,
21
respectively (based on protein comprising 23.5 J mg ). For growth in lipid, however,
21
metabolic costs were similar in the two categories, estimated as 52.3 J mg , or 1.33 J
21 21
J (based on lipid comprising 39.3 J mg ). These values are similar to values reported for animal taxa generally, viz. a range of 0.32–1.25 joules of metabolisable energy per joule of protein deposited (see Hawkins et al. (1989)), and 1.36 joules per joule of lipid (Pullar and Webster, 1977).
4. Discussion
Fig. 6. (A) Metabolic losses (joules per day) as a function of protein growth (mg per day) in selected (open squares, full line) and control (filled circles, dashed line) oysters. Values are means623S.E., standardised to a body size of 250 mg dry tissue weight. Control oysters showed significantly higher growth costs per unit protein growth than did selected oysters. The regression lines are as follows: selected: R545.164.11
2 2
10.462.53protein growth (r 50.43); controls: R558.168.5141.7614.13protein growth (r 50.23). (B) Metabolic loss as a function of lipid growth, for selected (open squares) and control (filled circles) oysters. Data for control oysters at low ration have been excluded because of the highly negative values. There was no significant difference between experimental categories for growth costs per unit lipid growth. The plotted line
2
physiological processes controlling the rate of growth. Four hypotheses were set up, based on the earlier results:
1. that selected oysters would feed more quickly than the controls;
2. that control oysters would have higher rates of metabolism per unit of food absorption when growth was positive;
3. that selected oysters would show lower metabolic costs of growth, and higher net growth efficiencies, than the controls; and
4. that such differences in metabolic allocation and efficiency would apply equally whether growth was determined in units of dry tissue mass, protein, lipid or carbohydrate.
The results confirmed that selection for faster growth is concomitant with faster rates of feeding, so agreeing with earlier studies (Holley and Foltz, 1987; Toro and Vergara, 1998; Bayne et al., 1999a,b). At an available ration equivalent to 1.5–2.0% of body weight per day rock oysters selected for growth grew approximately four times the rate of the control oysters (1.02% compared to 0.27% body weight per day) and expressed a rate of food absorption, or metabolisable energy intake, twice that of the controls (13.1 compared with 6.8 mg dry matter per day).
The results of the study also confirmed that, at similar rates of food absorption, the faster growing oysters had lower rates of metabolism than the controls. For example, at a rate of absorption of 7 mg dry matter per day, oxygen consumption by the control oysters was |0.15 ml oxygen per hour compared with 0.12 ml oxygen per hour by the
selected group (Fig. 2), a difference of 20%. In contrast to the earlier study, however, in the present experiment selected oysters also recorded a slower maintenance metabolic rate (metabolic rate at zero growth) relative to the controls, equivalent to a 25% reduction. Experiments with different genetic strains of Pacific oysters (Crassostrea gigas) have also demonstrated a selection-dependent difference in maintenance metabol-ic rate (Bayne, 1999).
These findings therefore support both the energy acquisition and the energy allocation models, as described in the Introduction. By a combination of faster feeding and slower metabolism per unit of metabolisable food intake, selected oysters considerably increased their rates of growth. The present results also support the so-called metabolic efficiency model, and it is here that the differences between the two experimental categories are of most current interest.
The metabolic efficiency model predicts that faster-growing individuals will have a lower metabolic cost of growth and a higher net growth efficiency (the ratio of growth to metabolisable energy intake) than the controls. The results supported both these
21
predictions and confirmed the earlier findings. Costs of growth were 0.34 and 0.81 J J , and net growth efficiencies were 0.29 and 0.14, in selected and control oysters, respectively. These cost of growth (C ) estimates are very similar to values calculated ing
the earlier study at similar ration levels, where C was independent of size; viz. 0.41 andg 21
overall conclusion from both studies, nevertheless, is that net growth efficiency by these oysters, feeding on algal pastes, is rather low (|0.24), with selected oysters showing a
higher efficiency, by between 15 and 50%, than the controls.
The results of the biochemical analyses of the tissues, derived indirectly from elemental (C, H, N) analysis, suggest that the oysters in both experimental categories were utilising stored carbohydrates to supplement the deposition of tissue lipids. The high lipid conversion efficiency in the control group (.100% with respect to lipids derived from the diet) points particularly to the inter-conversion of tissue carbohydrates to tissue lipids. This is consistent with seasonal patterns in other bivalves (Gabbott, 1975; Gabbott and Peek, 1991) and implies that the oysters were in the early stages of gametogenesis (Cox et al., 1996).
Of particular interest was the finding that the control oysters were depositing lipid at faster rates than the selected oysters (relative to rates of protein deposition), and with a significantly higher conversion efficiency. These higher rates of lipid deposition will have contributed to the higher costs of growth in the control compared to the selected oysters. However, whereas control oysters also expressed higher metabolic costs per unit deposition of protein than did the selected individuals (Table 5), there was no equivalent difference in unit costs for lipid deposition.
The high metabolic costs of protein deposition, as a significant contribution to the costs of growth in bivalves, have been emphasised by Hawkins et al. (1986, 1989) and Bayne and Hawkins (1997) and, for fish, by Carter et al. (1998) and McCarthy et al. (1994). The results of the present experiment are consistent with this. For example, at a metabolic loss of 0.4 joules per joule of dry tissue deposited in growth by the selected
21
oysters, and 0.8 J J by controls (Table 5), oysters in both categories were expending
|55% of their growth costs on protein deposition.
Rock oysters which have been selected for fast growth therefore incurred a lower metabolic cost of growth than control oysters, and were able to achieve faster growth rates for protein by virtue of reduced unit costs (higher metabolic efficiency). In both categories the metabolic losses due to growth represented a similar proportion of total metabolic loss, and this proportion increased with the rate of growth. The net result was a higher rate of protein growth, at greater efficiency, and fuelled by a higher metabolisable energy intake, in selected than in control individuals. The control oysters, however, deposited more lipid than did the selected oysters, partly at the expense of a higher utilisation of stored carbohydrates, and this difference also contributed in part to higher growth costs in these individuals.
In the present experiment, for both experimental categories there was a large component of total growth costs which was not directly associated with protein synthesis (ca. 45%). It is not clear what processes contributed to this metabolic component, but the present results suggest that they may be, in part at least, costs associated with gametogenesis, as a result of differences in the rates of lipid synthesis. This possibility would benefit from further work, because it implies that selection for faster growth may delay or reduce gametogenesis, altering the poise between growth and reproduction. Differences in metabolic rates at maintenance suggest another component of flexibility, namely between maintenance and growth.
The results presented here therefore support the concept of a flexible capability for differential energy allocation amongst individuals; e.g. to maintenance (selected oysters,controls), to growth, particularly protein growth (selected.controls), and possibly also to gametogenesis (controls.selected). Metabolic plasticity of this kind has been proposed by Wieser (1989, 1994) as a feature of metabolic allocation by compensation, and is here seen to apply between individuals growing at different rates, some having been artificially selected to do so more quickly than others of similar age. The extent to which this plasticity can be considered ‘compensatory’, however, for example with respect to limiting factors operating at different times within the life of the individual, can only be resolved by measuring the appropriate processes within individuals, under different experimental circumstances and over time. Selection for growth clearly highlights physiological flexibility within the species, but we do not yet know the extent to which this flexibility may operate also within individuals.
Acknowledgements
I am grateful to Shannon Long and Graham Housefield for their help in doing these experiments and to John Nell for providing the oysters from his mass selection trial in Port Stephens. The research was funded by the Australian Research Council through their support of the Special Research Centre on Ecological Impacts of Coastal Cities, and would not have been possible without the encouragement of the Director, Tony Underwood. I use this opportunity also to acknowledge Tony Hawkins, for his fundamental contributions to studies of protein turnover, and Andrew Clarke for his original thinking on energy budgets in general. [SS]
References
Arifin, Z., Bendell-Young, L.I., 1997. Feeding response and carbon assimilation by the blue mussel Mytilus trossulus exposed to environmentally relevant seston matrices. Mar. Ecol. Prog. Ser. 160, 241–253. Bayne, B.L. (Ed.), 1976. Marine Mussels: their Ecology and Physiology. Cambridge University Press,
Cambridge.
Bayne, B.L., 1998. The physiology of suspension feeding by bivalve molluscs: an introduction to the Plymouth ‘TROPHEE’ workshop. J. Exp. Mar. Biol. Ecol. 219, 1–19.
Bayne, B.L., Hawkins, A.J.S., 1997. Protein metabolism, the costs of growth, and genomic heterozygosity: experiments with the mussel Mytilus galloprovincialis Lmk. Phys. Zool. 70, 391–402.
Bayne, B.L., Hedgecock, D., McGoldrick, D., Rees, R., 1999a. Feeding behaviour and metabolic efficiency contribute to growth heterosis in Pacific oysters [Crassostrea gigas (Thunberg)]. J. Exp. Mar. Biol. Ecol. 233, 115–130.
Bayne, B.L., Svensson, S., Nell, J.A., 1999b. The physiological basis for faster growth in the Sydney rock oyster, Saccostrea commercialis. Biol. Bull. 197, 377–387.
Brown, J.R., 1988. Multivariate analyses of the role of environmental factors in seasonal and site-related growth variation in the Pacific oyster, Crassostrea gigas. Mar. Ecol. Prog. Ser. 45, 225–236.
Brown, M.R., Jeffrey, S.W., Garland, C.D., 1989. Nutritional aspects of microalgae used in mariculture: a literature review. In: CSIRO Marine Laboratories Report 205, p. 44.
Brown, M.R., Jeffrey, S.W., Volkman, J.K., Dunstan, G.A., 1997. Nutritional properties of microalgae for mariculture. Aquaculture 151, 315–331.
Carter, C.G., Houlihan, D.F., Owen, S.F., 1998. Protein synthesis, nitrogen excretion and long-term growth of juvenile Pleuronectes flesus. J. Fish. Biol. 53, 272–284.
Clarke, A., 1993. Seasonal acclimatization and latitudinal compensation: do they exist? Funct. Ecol. 7, 139–149.
Cox, E.S., Smith, M.S.R., Nell, J.A., Maguire, G.B., 1996. Studies on triploid oysters in Australia VI. Gonad development in diploid and triploid Sydney rock oysters Saccostrea commercialis (Iredale and Roughley). J. Exp. Mar. Biol. Ecol. 197, 101–120.
De Moed, G.H., De Jong, G., Scharloo, W., 1998. The energetics of growth in Drosophila melanogaster: effect of temperature and food conditions. Neth. J. Zool. 48, 169–188.
Dickie, L.M., Boudreau, P.R., Freeman, K.R., 1984. Influence of stock and site on growth and mortality in the blue mussel (Mytilus edulis). Can. J. Fish. Aquat. Sci. 41, 134–140.
Gabbott, P.A., 1975. Storage cycles in marine bivalve molluscs: a hypothesis concerning the relationship between glycogen metabolism and gametogenesis. In: Barnes, H. (Ed.), Proceedings 9th European Marine Biology Symposium. Aberdeen University Press, Aberdeen, pp. 191–211.
Gabbott, P.A., Peek, K., 1991. Cellular biochemistry of the mantle tissue of the mussel Mytilus edulis L. Aquaculture 94, 165–176.
Garton, D.W., Koehn, R.K., Scott, T.M., 1984. Multiple-locus heterozygosity and the physiological energetics of growth in the coot clam, Mulinia lateralis, from a natural population. Genetics 108, 445–455. Gnaiger, E., Bitterlich, G., 1984. Proximate biochemical composition and caloric content calculated from
elemental CHN analysis: a stoichiometric concept. Oecologia (Berlin) 62, 289–298.
Grant, J., 1996. The relationship of bioenergetics and the environment to the field growth of cultured bivalves. J. Exp. Mar. Biol. Ecol. 200, 239–256.
Griffiths, C.L., Griffiths, R.J., 1987. Bivalvia. In: Pandian, T.J., Vernberg, F.J. (Eds.), Bivalvia through Reptilia. Animal Energetics, Vol. 2. Academic Press, New York, pp. 1–88.
Hawkins, A.J.S., 1991. Protein turnover: a functional appraisal. Funct. Ecol. 5, 222–233.
Hawkins, A.J.S., Day, A.J., 1996. The metabolic basis of genetic differences in growth efficiency among marine animals. J. Exp. Mar. Biol. Ecol. 203, 93–115.
Hawkins, A.J.S., Bayne, B.L., Day, A.J., 1986. Protein turnover, physiological energetics and heterozygosity in the blue mussel, Mytilus edulis: the basis of variable age-specific growth. Proc. R. Soc. Lond. B 229, 161–176.
Hawkins, A.J.S., Widdows, J., Bayne, B.L., 1989. The relevance of whole-body protein metabolism to measured costs of maintenance and growth in Mytilus edulis. Physiol. Zool. 62, 745–763.
´
Hawkins, A.J.S., Smith, R.F.M., Bayne, B.L., Heral, M., 1996. Novel observations underlying the fast growth of suspension-feeding shellfish in turbid environments: Mytilus edulis. Mar. Ecol. Prog. Ser. 131, 179–190. Holley, M.E., Foltz, D.W., 1987. Effects of multiple-locus heterozygosity and salinity on clearance rate in a
brackish water clam, Rangia cuneata (Sowerby). J. Exp. Mar. Biol. Ecol. 111, 121–131.
Koehn, R.K., 1991. The cost of enzyme synthesis in the genetics of energy balance and physiological performance. Biol. J. Linn. Soc. 44, 231–247.
Mason, C.J., Reid, D.D., Nell, J.A., 1998. Growth characteristics of Sydney rock oysters Saccostrea commercialis in relation to size and temperature. J. Exp. Mar. Biol. Ecol. 227, 155–168.
McCarthy, I.D., Houlihan, D.F., Carter, C.G., 1994. Individual variation in protein turnover and growth efficiency in rainbow trout, Oncorhynchus mykiss (Walbaum). Proc. R. Soc. Lond. B 257, 141–147. McCausland, M.A., Brown, M.R., Barrett, S.M., Diemar, J.A., Heasman, M.P., 1999. Evaluation of live
microalgae and microalgal pastes as supplementary food for juvenile Pacific oysters (Crassostrea gigas). Aquaculture 174, 323–342.
Navarro, E., Iglesias, J.I.P., Ortega, M.M., Larratxea, X., 1994. The basis for a functional response to variable food quantity and quality in cockles Cerastoderma edule (Bivalvia Cardiidae). Physiol. Zool. 67, 468–496. Nell, J.A., Sheridan, A.K., Smith, I.R., 1996. Progress in the Sydney rock oyster Saccostrea commercialis
(Iredale and Roughley) breeding programme. Aquaculture 144, 295–302.
Nell, J.A., Smith, I.R., Sheridan, A.K., 1999. Third generation evaluation of Sydney rock oyster Saccostrea commercialis (Iredale and Roughley) breeding lines. Aquaculture 170, 195–203.
Newkirk, G.F., 1980. Review of the genetics and the potential for selective breeding of commercially important bivalves. Aquaculture 19, 209–228.
Pannevis, M.C., Houlihan, D.F., 1992. The energetic cost of protein synthesis in isolated hepatocytes of rainbow trout (Oncorhynchus mykiss). J. Comp. Physiol. B 162, 393–400.
Parry, G.D., 1983. The influence of the cost of growth on ectotherm metabolism. J. Theor. Biol. 101, 453–477. Pedersen, B.H., 1997. The cost of growth in young fish larvae, a review of new hypotheses. Aquaculture 155,
259–269.
Peterson, C.C., Walton, B.M., Bennett, A.F., 1999. Metabolic costs of growth in free-living garter snakes and the energy budgets of ectotherms. Funct. Ecol. 13, 500–507.
Present, T.M.C., Conover, D.O., 1992. Physiological basis of latitudinal growth differences in Menidia menidia: variation in consumption or efficiency? Funct. Ecol. 6, 23–31.
Pullar, J.D., Webster, A.J.F., 1977. The energy cost of fat and protein deposition in the rat. Br. J. Nutr. 37, 355–363.
Rombough, P.J., 1994. Energy partitioning during fish development: additive or compensatory allocation of energy to support growth? Funct. Ecol. 8, 178–186.
Rist, L., Semlitsch, R.D., Hotz, H., Reyer, H.-U., 1997. Feeding behaviour, food consumption, and growth efficiency of hemiclonal and parental tadpoles of the Rana esculenta complex. Funct. Ecol. 11, 735–742. Sheridan, A.K., 1997. Genetic improvement of oyster production — a critique. Aquaculture 153, 165–179. Toro, J.E., Vergara, A.M., 1998. Growth and heterozygosity in a 12-month-old cohort of Ostrea chilensis
obtained by mass spawning in the laboratory. P.S.Z.N. Mar. Ecol. 19, 311–323.
Whyte, J.N.C., 1987. Biochemical composition and energy content of six species of phytoplankton used in mariculture of bivalves. Aquaculture 60, 231–241.
Wieser, W., 1989. Energy allocation by addition and by compensation: an old principle revisited. In: Wieser, W., Gnaiger, E. (Eds.), Energy Transformations in Cells and Organisms. Georg Thieme Verlag, Stuttgart, pp. 98–105.
Wieser, W., 1991. Limitations of energy acquisition and energy use in small poikilotherms: evolutionary implications. Funct. Ecol. 5, 234–240.
Wieser, W., 1994. Cost of growth in cells and organisms: general rules and comparative aspects. Biol. Rev. 68, 1–33.
Wieser, W., Medgysey, N., 1990. Aerobic maximum for growth in the larvae and juveniles of a cyprinid fish, Rutilus rutilus (L.): implications for energy budgeting in small poikilotherms. Funct. Ecol. 4, 233–242. Zandee, D.I., Kluytmans, J.H., Zurburg, W., Pieters, H., 1980. Seasonal variations in biochemical composition