ANALYSIS
Value of land as a pollutant sink for international waters
Ing-Marie Gren
a,b,*
aDepartment of Economics,Swedish Uni6ersity of Agricultural Sciences,Box7013,750 07Uppsala,Sweden bBeijer International Institute of Ecological Economics,Royal Swedish Academy of Sciences,Box50005,
104 05Stockholm,Sweden
Received 8 July 1998; received in revised form 30 December 1998; accepted 4 January 1999
Abstract
The purpose of this paper is to analyse and compare the values of a marginal change in the area of land as a pollutant sink under different decision-making contexts and objectives: international coordination versus national policies for pollutant reduction, and maximization of net benefits versus minimization of costs for pollutant reductions. The analytical results show that a coordinated policy between countries generates a higher value of a marginal change in the supply of land as a pollutant sink than an uncoordinated policy. It is also shown that the value is lower (higher) under the decision objective of maximizing net benefits when the efficient pollutant load is higher (lower) than the load target under the cost effectiveness approach. An application to the Baltic Sea drainage basin land as a nitrogen sink for the management of eutrophication reveals that the differences between values under different policy contexts and objectives can be quite large in magnitude. © 1999 Elsevier Science B.V. All rights reserved.
Keywords:Transboundary pollutants; Pollutant sinks; Coordination; Net benefit maximization; Cost effectiveness
www.elsevier.com/locate/ecolecon
1. Introduction
Over the past 20 years, the benefits of various land uses have been recognized, not only with respect to their traditional harvest yields, but also with regard to their ability to act as a pollutant sink for water management. One example is pro-vided by wetlands’ capacity to purify water by
reducing leaching of pesticides and nutrients to downstream watersheds (e.g. Mitsch and Gos-selink, 1986; Kusler and Kentula, 1990). Gren et al. (1997) showed that land cover types such as wetlands, grassland and energy forest provide low cost options for the achievement of nutrient re-ductions to the Baltic Sea. The value of land acting as a pollutant sink should then be ac-counted for when considering its conversion into other uses. However, a comparison of net benefits from alternative land uses requires an appropriate
* Correspondence to Uppsala address.
E-mail address:[email protected] (I.-M. Gren)
measurement of the net value in all uses. The purpose of this paper is to analyse and estimate the value of land as a pollutant sink under differ-ent decision contexts and objectives.
When we regard an ecosystem’s capacity to reduce leaching of pollutants as an input for the production of water quality its value can be calcu-lated as associated impacts on net welfare by means of the production function approach (Ma¨ler, 1991a; Barbier, 1994, 1997; Gren, 1995; Bystro¨m, 1999). The value of the pollutant sink functioning is then determined by the valuation of water quality, the effectiveness in producing water quality, and the cost as compared to other pollu-tant reduction measures. The optimal choices of inputs and water quality are, in turn, determined by type of decision framework. In this paper, two classes of decision contexts and objectives are identified for the management of international waters. The alternative decision contexts are coor-dinated and uncoorcoor-dinated choices of water qual-ity improvement options, and the objectives to be achieved are formulated either as maximization of net benefits or as minimization of costs for achiev-ing a certain water quality target.
As demonstrated in Barbier (1997) and Free-man (1991), the design of property rights for a common property resource and associated deci-sion context affects the value of an ecosystem as an input into the production of a common prop-erty resource. The difference with this paper as compared to the approach of Barbier and Free-man is the large-scale international aspect. There is a relatively large literature on net benefits from emission reductions under different international cooperative frameworks (Barett, 1990; Kaitala et al., 1991; Ma¨ler, 1991b; Hoel, 1992). There are also numerous studies on the valuation of ecosys-tem life support values, especially wetland valua-tion (see Gren and So¨derqvist, 1994, for a survey). However, the combination of ecosystem valuation and transboundary environmental impacts, which is the approach applied in this study, is rare.
The paper is organized as follows. The first two sections contain an analytical decomposition of factors affecting the value of land as a pollution abatement option. Next, the approach is applied to the valuation of Baltic Sea coastal wetlands as
nitrogen sinks. The paper ends with a brief sum-mary and some concluding comments.
2. Basic model and decision framework
This paper contains two basic components for the analysis and calculation of the value of land as a pollutant sink. One is a description of pollu-tant transports among the countries sharing the common water body. The other is modelling of alternative decision contexts and objectives. In the following, the construction of simple models of pollutant transports and decision frameworks are presented. By means of these models, the value of land as a pollutant sink in a country is calculated as the impact on net benefits or abatement costs from a marginal increase in the current area of pollutant sink. Land as a pollutant sink is here interpreted as the area of land with relatively low pollutant leaching. A switch in the area of land from high to low leaching then implies a net decrease in pollutant leaching, the effectiveness of which, as measured in tons of pollutant reduc-tions to the water body, depends on the difference in leaching between the high and low leaching land covers.
2.1. Pollutant transport modelling
If there were no pollutant transports between countries, there would be no difference in out-comes between coordinated and uncoordinated pollution abatement policies. However, in the case of international waters we have to deal with two types of transboundary pollutants: air and water streams. Simplified models for these transports are presented in this section.
For each country i, where i=1,…,N different
countries, there are two types of pollutant
path-ways to the water body under study: direct, Ei
,
and indirect deposition, Pi
. Direct deposition is
defined as the pollutant emissions in region, Ei,
which are transported directly into the water body. It is assumed that this direct deposition can be calculated as a share of total emissions from
the region, aiEi. Total pollutant load from a
country i to the common water body,Li, is then
Li
=Pi
+ai
Ei (1)
Indirect deposition, Pi, refers to the pollutants
deposited on land and further transported by water streams to the international water body. The total deposition on land within a country is determined by the emissions from all countries, which are deposited on land within the country. It is assumed that these transboundary air pollutants can be described by a matrix where each element
aji measures that share of country j’s emissions
that is transported to country i. When aii=(1−
ai)
there are no transboundary pollutant
transports.
Total pollutant deposited on land within the
territory of each country, Sja
ji
Ej, is subjected to
transformation during the transport from the de-position localization to the water body under
study. The level ofPiis then dependent, not only
on the pollutant deposition within the regions, but on other factors, such as the composition of land, climate, geology and hydrology. For example, there is a great difference in nutrient leaching between forest areas and bare arable land. An-other simplification of the model is the discrimi-nation between only two types of land, relatively
high leaching land, AHi
, and low leaching land,
ALi
, or land covered by pollutant sink. The
indi-rect deposition of pollutants from countryito the
water body,Pi, is then written as
The simplification of pollutant transports made in Eq. (2) occurs for at least two reasons. One is that the spatial distribution of different land cover types within a drainage basin affects the pollutant load to the water body. For example, high leach-ing land located close to the water body implies
largerPithan if the same land is located upstream
in the drainage basin. The reason is the transfor-mation of pollutants during the water and soil transports from the pollutant source to the water body. The second reason is the complex dynamic relation between surface and subsurface transport of pollutants. However, the consideration of these
factors would not alter the principal analytical results in this section, although they will probably have a strong empirical importance. Therefore, in order to focus on the role of institutional and informational settings, these dynamic and spatial factors are excluded from the analysis.
The transboundary dispersion of water quality impacts is determined by the water streams. It is assumed that these transports between surround-ing regions can be described by a matrix where
each element,eji, denotes the fraction of pollutant
load from regionj,Lj
, which affects regioni. The
water quality for a region, Wi
, can then be
writ-Water quality is assumed to be measured so that
a higher Wiimplies improved water quality. It is
then expected that Wiis decreasing in Lj.
2.2. Decision contexts and objecti6es
Based on the above description of pollutant transports, we can identify two types of options for improving the water quality: emission-oriented
abatement measures, Ri
, and land use-oriented options increasing the area of low leaching land,
ALi, or pollutant sinks. Pollutant emission from a
country iis then initial emission,Eio, which could
be measured at a certain base year, minus Ri, or
Ei
=Eio
−Ri. Common to all decision contexts
and objectives is the choice of these two pollutant load reduction measures. Another common fea-ture for all types of decisions is that the value of land as a pollutant sink is calculated as a mar-ginal increase in the current area of pollutant sink
in each country i,ALi*.
of Riand ALifor obtaining a common objective.
The other is the uncoordinated case where each country makes its own choice taking other coun-tries’ decisions as given.
Ideally, when sufficient information is available,
we would solve for the efficient choices ofRiand
ALi by maximizing net benefits under the two
institutional settings. However, estimating
changes in the supply of public goods in monetary terms is far from a trivial matter. In the case of water quality improvements this implies the trans-lation of water quality changes, such as pollutant concentration ratios, into welfare terms. For ex-ample, changes in pollutant loads affect reproduc-tion of commercial fish and bathing water quality. We thus have to deal with multi-attribute valua-tion, which is a relatively recent research area (e.g. Dale et al., 1996). It is therefore likely that benefit estimates of water quality impacts are not avail-able. Further, we might not even obtain informa-tion on water quality impacts from pollutant transports in biological terms. The reason is the lack of data on marine pollutant transports for large international water bodies (Gren et al., 1997). Therefore, two types of decision objectives are identified depending on the availability of marine pollutant transports and benefits esti-mates. In the case of information availability, net benefits are maximized. When sufficient informa-tion does not exist, the cost effectiveness decision rule is applied. The decision is then formulated as achieving a certain reduction in the pollutant load to the water body at minimum cost.
We thus have four different combinations of institutional and informational settings:
coordi-nated and uncoordicoordi-nated choices of Ri and ALi
where either net benefits are maximised or costs are minimized for a certain target in the load of pollutants to the water body. Under all four situations it is assumed that there exists cost
functions for each type of measure,CiR
and CiA
,
which are increasing and convex in Ri and ALi
respectively. When maximizing net benefits, valu-ation functions are assumed to exist for each
country,Vi(Wi)which are increasing and concave
inWi. The four different decision models and the
associated first-order conditions with respect to
the optimal choice ofALiare written as presented
in the following.
Coordinated maximization of total net benefits
(IB), implies that total net benefits for all
coun-tries are maximized, which gives
Max Si[V
The associated first-order conditions for an opti-mum read
where subindexes denote partial derivatives, j=
i=1,…,N different countries, and aiIB is the
La-grangian multiplier of the constraints on the area of pollutant sinks, which is positive when the constraint is binding. This multiplier is interpreted
as the value of a marginal increase in Ai*, which
constitutes our measurement of the pollutant sink
value of land in country i. From Eq. (6) we can
see that its magnitude is determined by the differ-ence in marginal benefits minus marginal costs.
When ALi
* does not bind at the actual area of
pollutant sinks, there is no marginal pollutant sink value.
The first-order condition (Eq. (5)) also reveals two types of international spillover impacts from a marginal change in pollutant emissions in
coun-try i. The first term within brackets in Eq. (5)
disregards the transboundary air transports but includes the dispersion of water quality impacts to other countries by the marine transport
coeffi-cients eij
. The second term shows somewhat more complicated spillover effects by considering trans-boundary air and water pollution. First, the
emis-sion reduction in country i gives rise to a
deposition and leaching reduction in other
coun-tries through ((Pj
/(Rj)aij. Then, the pollutant
load reduction in each country jgenerates
disper-sion of water quality impacts to all other
In Gren (1997) it is shown that the consideration of these two spillover effects, instead of only one as in most papers on transboundary pollutants, is likely to reduce the difference between outcomes from coordinated and uncoordinated policies. However, in this paper we are mainly concerned with the comparison of the value of marginal changes in the area of pollutant sinks. In subse-quent analysis we will therefore abolish the first-order conditions for optimal choices of emission reduction measures.
Coordinated minimization of total costs (IC) for achieving a certain maximum pollutant load
target, L*, is written as
Min Si
and the first-order conditions with respect to the
optimal choice of ALi is
where l]0 is the Lagrange multiplier on the
pollutant load restriction, which measures the change in total costs from a marginal change in
the pollutant load restriction. Whether or notaiIC
is positive depends on the cost and effectiveness of land as a pollutant sink as compared to abate-ment options in all countries.
The corresponding decision problems under na-tional policies is written in the same way as Eqs. (6) and (7), except for the absence of summation over all countries in the objective function. Under national minimization of costs, a restriction is imposed only on the country’s pollutant load to the water body. The associated first-order
condi-tions under National maximization of net benefits
(NB), is then written as
ViWiWLiieiiPiALi−CAi Li=ai
NB
(9)
The corresponding condition underNational min
-imization of costs (NC) is
where the Lagrange multiplier, li, measures the
change in costs from a marginal change in the
pollution requirement Li* which considers only
the reduction options in the country. The
multi-plier on the overall reduction target, l, measures
changes in total costs from a marginal change in
L* where reduction options in all countries are
taken into account.
3. Comparison of pollutant sink values
Assuming positive values of a marginal change
inALi*, we can see from the first-order conditions
Eqs. (6) and (8) – (10) that
aiIB=aiIC=aiNB
=aiNCwhen
Sj(#Vj/#Wj)(#Wj/#Lj)eij=l
=(#Vi/#Wi)(#Wi/#Li)eii=li
That is, the marginal sink values are the same when there are no transboundary impacts by the water streams, when the efficient level of pollutant load reduction corresponds to the cost effective level at the international and national decision
levels, and whenl=lifor alli=1…,Ncountries.
The last condition implies, in principle, that there are no differences in pollutant reduction costs between the countries. It is very unlikely that these three conditions are fulfilled, at least for relatively large international waters with several surrounding countries. We then have the situation that the value of a marginal change in the area of pollutant sink in a country depends on the deci-sion context and objectives, which is analysed in the following section.
In order to compare the values under coordi-nated and uncoordicoordi-nated actions, we take the difference between the international and national values of a marginal change in land to be the
pollutant sink in country iunder maximization of
net benefits and minimization of costs, respec-tively. The difference under the maximization of net benefits is then written as
value of a marginal change in the area of
pollu-tant sinks in countryiis higher under coordinated
policies as long as there are any dispersion im-pacts of water quality and when positive valua-tions of water quality improvements exists in at least one other country.
Under the cost effectiveness approach we have
aiIC−aiNC=(l−li)P
ALi
i (12a)
Eq. (12a) is positive or negative depending on the
relation betweenlandli. These Lagrange
multi-pliers are equal to the derivatives of the total and national cost functions for changes in pollutant
loads at L* and Li
*, respectively, which implies
that Eq. (12a) can be rewritten as
aIC
and Aio and Rio denote the optimal choices of
land use- and emission-oriented measures,
respec-tively. The relation between aIC and aNC is thus
determined by the relation between the interna-tional and nainterna-tional marginal costs for pollutant
load reductions at the restrictions L* and Li*,
respectively. Assuming negative and concave cost
functions in L* and Li
*, respectively, the
differ-ence betweenaIC
andaNC
is positive for marginal
decreases inL*andLi
*when the marginal cost of
pollutant load reductions in countryiis relatively
low as compared to other countries. Then, an
increase in ALi* implies cost savings in all
coun-tries where pollutant reduction options are more
expensive than the cost of the increase inALi*. On
the other hand, the national value of a marginal
change in ALi* is higher when the national
mar-ginal cost for pollutant reductions is relatively high.
When we instead focus on the role of informa-tion provision, we take the differences between the values of marginal change in the area of pollutant sinks between the efficient and cost ef-fective policies. This difference under coordinated policies is written as
aiIB
and under national policies we have
aiNB−aiNC=(V
Under both international and national policies for maximizing net benefits we have that marginal benefits from pollutant reductions are equal to the
marginal cost. Since the Lagrange multipliers l
and li measure the marginal costs of pollutant
load reductions at the cost effective load targets, Eqs. (13) and (14) are both zero when the efficient level of pollutant load coincides with the cost effective target. When the efficient loads are higher (lower) than cost effectiveness targets, the differences in Eqs. (13) and (14) are negative (positive). The values of sinks are then lower (higher) under maximization of net benefits than when costs are minimized.
4. Application to the Baltic Sea
The Baltic Sea has suffered from eutrophication since the beginning of 1970s. Eutrophication may cause an increase in the production of algae, some of which are toxic. When decomposed, all algae demand oxygen which results in oxygen deficits at the sea bottom. This deficiency in turn generates sea bottom areas without biological life, which currently occur in 25% of the deep sea bottom areas of the Baltic Sea (Turner et al., 1999). Further, the composition of fish species changes. In the case of Baltic Sea the stock of commercial cod decreases while trash fish stock increases. Nitrogen loads constitute the major source of eutrophication to the major parts of the Baltic Sea (Wulff and Niemi, 1992; Elmgren, 1997).
However, as emphasised in Gren et al. (1997), there were several difficulties in finding appropri-ate data on costs and nitrogen transports for these large-scale calculations. In this study, further difficulties appear when finding data on marine water transports of nitrogen, which is required for calculating benefits from nitrogen reduction. Esti-mates of benefits from nitrogen reductions to the Baltic Sea are found in So¨derqvist (1996) and
Markowska and Z:ylicz (1996). These studies are
designed in order to make appropriate compari-sons between Sweden and Poland of willingness to pay for an improvement of the ecological condi-tions of the Baltic Sea which corresponds to the situation prior to the 1950s. The results from the Swedish study are then transferred to Denmark, Germany and Finland, and the Polish to Estonia, Lithuania, Latvia and Russia. The results show an annual willingness to pay of 31 000 million Swedish crowns (SEK).
As is common with many methods for estimat-ing monetary values of changes in the supply of an environmental good, only one change in the supply is considered. This method makes it very difficult to trace marginal benefits between the initial supply and that in the valuation scenario, which is required for the purpose of this paper. A linear relation between nitrogen reductions and benefits has therefore been assumed, which im-plies a constant environmental marginal benefit, and, further, that this is the same for all regions. The marginal benefit is obtained simply by divid-ing total benefits by 500 000 tons of N, which corresponds to a 50% decrease in total nitrogen load to the Baltic Sea. This level of nitrogen reduction is suggested by Wulff and Niemi (1992) in order to obtain the ecological conditions corre-sponding to the 1950s. The estimated marginal
benefit is then SEK 62/kg N reduction.
Information on nitrogen marine transports is obtained from Wulff et al. (1990) where trans-ports between three major Baltic Sea basins —
Baltic Proper, Bothnia Sea, and Bothnia
Bay — are calculated. According to the results, 20% of the nitrogen load to the Baltic proper is transported to the northern basins, i.e. Bothnia Sea and Bothnia Bay. These northern basins are shared by Finland and northern Sweden. Due to
the marine streams there is no transport from these basins to the Baltic Proper. Therefore, it is assumed that Finland and Northern Sweden re-ceive 20% of total nitrogen load from all other regions. Further, the loads from Northern Sweden and Finland imply marine environmental impacts only on these regions.
Unfortunately, the basin nutrient transport cal-culations contain no estimates of the transport between regions within each basin, which means that there are no estimates of marine nitrogen transports between the eight countries sharing the Baltic Proper basin. Therefore, arbitrary assump-tions have been made which are based on some information on the coasts of the countries. When the coast lines contain islands and vegetation, more of nitrogen impact occurs on the coast of the emitted country and vice versa. It is regarded that the coasts of Poland are very ‘open’ in the sense that they contain little vegetation which can contain nutrients. It is, therefore, simply assumed that all the Polish nitrogen load entering the Baltic Sea is equally divided between all Baltic Proper countries. For the remaining countries it is assumed that 0.3 of the impact occurs on the own coast while the remaining part is equally divided by the other countries.
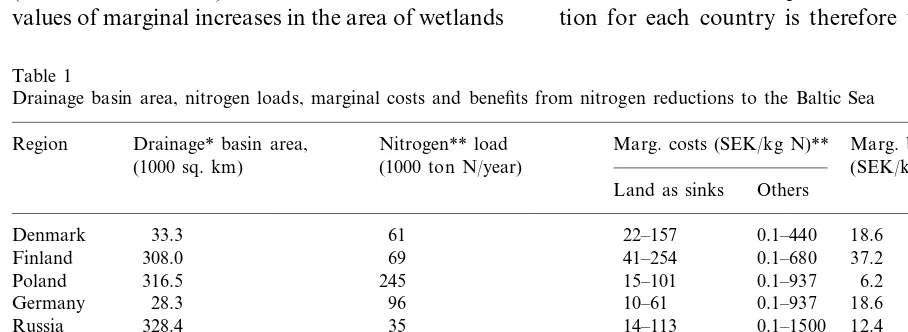
In Table 1, the calculated nitrogen loads, mar-ginal costs and benefits for each region in the
drainage basin are presented (1 USD=SEK 7.99,
December 17, 1998). In addition, the area of each drainage basin is given.
Baltic Sea coasts. However, there is much uncer-tainty in our estimates, which implies that, al-though well within the range of other estimates, they must be interpreted with much caution.
The last two columns present marginal costs and benefits, respectively, from reductions in the nitro-gen load to the coastal waters of the Baltic Sea. The estimates of marginal costs show that the costs of pollutant sink measures are neither the lowest nor the most expensive options. The low cost emission reduction options are decreases in nitrogen fertiliz-ers and improvements of the cleaning capacity at the sewage treatment plants. The most expensive measures are reduction in air emissions, which is explained by their low impacts on the Baltic Sea. The marginal benefit measures the impact as mea-sured in monetary terms in that country. For example, a reduction by 1 kg N of Danish nitrogen loads generates a benefit of SEK 18.6 for the Danish people. Water quality exports to other
countries sum to SEK 62−18.6=43.4. The lowest
own marginal benefit is obtained in Poland, which is due to our assumption of an ‘open’ coast.
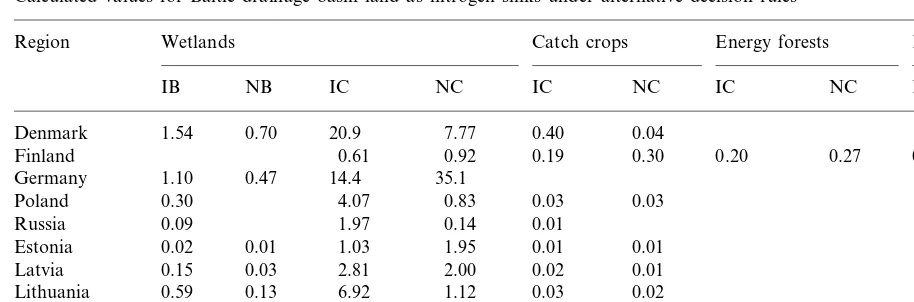
Values of a marginal increase in the nitrogen sink area are calculated for different types of pollutant sinks by means of non-linear programming (Brooke et al., 1992). The results show that the values of marginal increases in the area of wetlands
are positive in most countries under all four deci-sion frameworks, while they are zero in most cases for the other three types of nitrogen sink areas (Table 2).
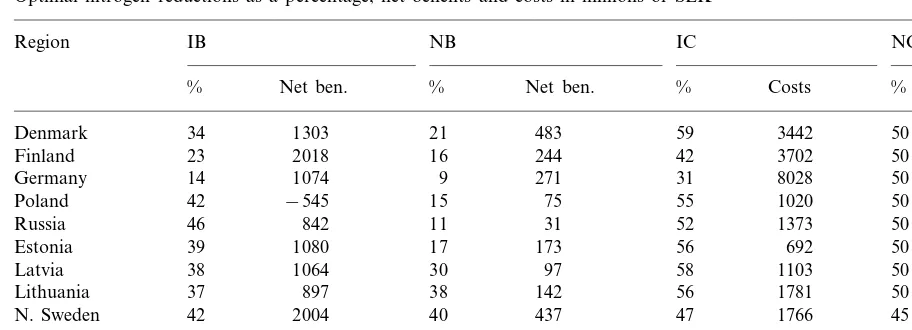
All countries share the feature that the values of marginal increases in wetlands are higher under cost effective decision rules than when net benefits are maximized. As demonstrated in the foregoing section, this is a reflection of the higher nitrogen reduction target under the cost effective approaches (see Table 3 for optimal nitrogen reductions, costs and net benefits under alternative decision rules). Another result, which is expected from the analysis in the foregoing section and the numbers presented in Table 1, is that the values are higher under coordinated polices for maximization of net benefits than when each country maximizes its own net benefits. Values are higher under coordination of minimization of costs for low-cost countries with relatively large reductions, i.e. Denmark, Poland, Russia, Estonia, Latvia and Lithuania.
The results in Table 2 also reveal that the differences in values for a country can be consid-erable depending on the choice of problem formu-lation. Germany is exceptional due to the large load of nitrogen air transports which are expen-sive to reduce. The requirement of a 50% reduc-tion for each country is therefore very expensive
Table 1
Drainage basin area, nitrogen loads, marginal costs and benefits from nitrogen reductions to the Baltic Sea
Nitrogen** load Marg. costs (SEK/kg N)** Marg. benefits Drainage* basin area,
Region
(SEK/kg N) (1000 sq. km) (1000 ton N/year)
Land as sinks Others
33.3 61
Denmark 22–157 0.1–440 18.6
37.2
28.3 96 10–61 0.1–937 18.6
Germany
Russia 328.4 35 14–113 0.1–1500 12.4
46.1 18 41–303 0.1–357 18.6
Estonia
65.6 31 43–306 0.1–536 18.6
Latvia
12.4 0.1–500 36–283
Lithuania 66.0 45
278.0 48 101–419 0.1–290 37.2
N. Sweden
Table 2
Calculated values for Baltic drainage basin land as nitrogen sinks under alternative decision rulesa
Region Wetlands Catch crops Energy forests Ley
IB NB IC NC IC NC IC NC IC NC
0.70 20.9 7.77 0.40
Denmark 1.54 0.04
0.61 0.92 0.19
Finland 0.30 0.20 0.27 0.07 0.15
0.47 14.4 35.1 1.10
Germany
0.30
Poland 4.07 0.83 0.03 0.03
0.09
Russia 1.97 0.14 0.01
0.01 1.03 1.95 0.01 0.01
0.02 Estonia
Latvia 0.15 0.03 2.81 2.00 0.02 0.01
0.13 6.92 1.12 0.03 0.02
0.59 Lithuania
N. Sweden 0.24 0.09 0.09 0.07
S. Sweden 0.10 5.12 0.12 0.13 0.03 0.12
aValues are in 1000 SEK/ha; a blank box indicates zero value; IB, maximization of international net benefits; NB, maximization of national net benefits; IC, minimization of international costs for a 50% total N-reduction; NC, minimization of costs for a 50% reduction in national N-loads.
for Germany, which, in turn, gives its very high value of increased wetland area. But, the variation in values is also high for other countries. For example, the highest value is more than 25 times higher than the lowest values in Denmark, Latvia and Lithuania. On the other hand, wetland restoration is a relatively uninteresting nitrogen reduction option in Finland and North Sweden. One important reason is that the nitrogen reten-tion capacity of wetlands, which is dependent on climatic factors, is relatively low in these regions. Another important factor is the relatively large current areas of wetlands in these regions, which implies a rather low value of further increases.
The estimated values of wetlands as nitrogen sinks are significant when compared with profits from traditional use of arable land. In Finland, Germany, Denmark, and Sweden profits from high yield arable land vary between SEK 2000 and 6000 per ha, and in the other countries be-tween SEK 500 and 2000 per ha (Elofsson, 1997). The value of a marginal increase in the area of wetlands is thus considerable under cost mini-mization decisions. It can then achieve a level which is about three times higher than the highest profit level from conventional crops. Under inter-national coordination of the maximization of net benefits, the values are lower and correspond to, at the most, about one-quarter of the highest profit level (Denmark and Estonia).
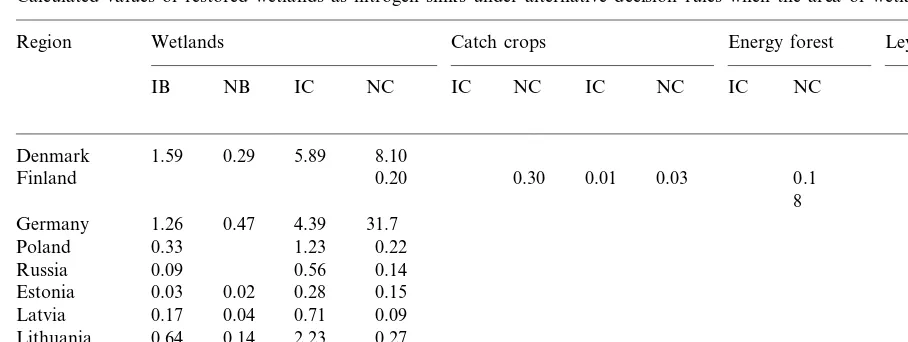
However, the empirical calculations contain several assumptions due to lack of data. Changes in any of these parameters will, by all likelihood, affect the results. One example is provided by the difficulty to obtain information on current area of wetlands. The source used in this paper (Jansson et al., 1995), relies on geographical information systems (GIS) data, which is known to be rela-tively weak in identifying wetlands. When the wetland area is doubled in all countries, the values under the cost effective decisions become zero for Finland and North Sweden and are reduced by at least two-thirds for all other regions (Table 4). Further, the values of other nitrogen sink options become zero in all countries except Finland.
5. Concluding comments
Table 3
Optimal nitrogen reductions as a percentage, net benefits and costs in millions of SEKa NB
Region IB IC NCs
Net ben. % Net ben. %
% Costs % Costs
Denmark 34 1303 21 483 59 3442 50 1734
2018 16 244 42 3702 50
Finland 23 4445
1074 9 271 31
14 8028
Germany 50 3074
42
Poland −545 15 75 55 1020 50 4562
842 11 31 52
Russia 46 1373 50 493
1080 17 173 56
39 692
Estonia 50 96
38
Latvia 1064 30 97 58 1103 50 882
37
Lithuania 897 38 142 56 1781 50 761
2004 40 437 47
42 1766
N. Sweden 45 1006
37
S. Sweden 917 19 213 58 3116 54 2849
10 654 16
Total 35 2166 50 35257 50 47572
aIB, maximization of international net benefits; NB, maximization of national net benefits; IC, minimization of international costs for a 50% total N-reduction; NC, minimization of costs for a 50% reduction in national N-loads.
higher or equal to the value under separate policies when net benefits are maximized. The correspond-ing value when costs are minimized instead depends on whether the country under study has relatively high or low cost options. The values under coordi-nated policies are higher for low cost countries and lower for countries with expensive pollutant reduc-tion opreduc-tions. When instead we focus on the role of access to data on environmental benefits, we con-clude that there are no differences in pollutant sink values between maximizing net benefits and mini-mizing costs when the efficient pollutant loads coincide with the cost effectiveness targets. The values are higher (lower) under cost effective objec-tives than when net benefits are maximised when the cost effective targets are lower (higher) than the efficient pollutant loads.
The analysis is applied to the management of the eutrophicated Baltic Sea, where the load of nitro-gen plays an important role. Four different alterna-tives of land as pollutant sinks — wetlands, catch crops, energy forests, and pasture — are included as nitrogen reduction options together with reduc-tions in emission of nitrogen from nitrogen fertiliz-ers, manure, households, industry and traffic. The application reveals two major results. First, in-creases in the area of wetlands turn out to be the most interesting nitrogen sink option in a majority of the Baltic Sea countries: Poland, Germany,
Denmark, Russia, Estonia, Latvia, and Lithuania. Relatively low costs of wetlands as pollution miti-gation options are also found in other studies (e.g. Gren, 1993; Bystro¨m, 1999). Important reasons are the small areas of wetlands due to their conversion into arable land (Wittgren et al., 1991), and the relatively low marginal costs of nitrogen reductions by restoring wetlands in these countries. Second, the value of a marginal increase in the wetland area varies considerably depending on decision frame-work. For example, the value of a marginal increase
in Denmark amounts to about SEK 8000/ha under
national minimization of costs and to about SEK
700/ha when national net benefits are minimized.
Table 4
Calculated values of restored wetlands as nitrogen sinks under alternative decision rules when the area of wetlands is doubleda
Region Wetlands Catch crops Energy forest Ley grass
IB NB IC NC IC NC IC NC IC NC
0.29 5.89 8.10 Denmark 1.59
0.20
Finland 0.30 0.01 0.03 0.1
8 0.47 4.39 31.7
Germany 1.26
Poland 0.33 1.23 0.22
Russia 0.09 0.56 0.14
0.02 0.28 0.15 0.03
Estonia
Latvia 0.17 0.04 0.71 0.09 0.14 2.23 0.27 0.64
Lithuania N. Sweden
S. Sweden 0.18 1.44 0.14
aValues are in 1000 SEK/ha; a blank box indicates zero value; IB, maximization of international net benefits; NB, maximization of national net benefits; IC, minimization of international costs for a 50% total N-reduction; NC, minimization of costs for a 50% reduction in national N-loads.
The costs estimated in this paper refer only to the gross cost and not to the net costs of the measures. This assumption implies an overesti-mate of costs of measures which, not only reduce nitrogen loads, but also have other environmental impacts. For example, in addition to reducing eutrophication, decreases in nitrogen oxides also reduce damaging impacts of acid rain and ground layer ozone. The multi-functional aspects of wet-lands have been demonstrated in Gren (1995) where it is shown that other environmental values associated with the construction of wetlands for nitrogen abatement can be as high as the value of water quality improvement. Another limitation of the cost concept concerns the neglect of eventual dispersion of impacts on several sectors of the economies due the implementation of pollutant reduction measures. As demonstrated in Johanes-son and Randa˚s (1996), the structural impacts of nitrogen reductions can be considerable in Swe-den, the Baltic States, Finland and Denmark. Another simplifying assumption is that of zero costs for implementing pollutant reduction mea-sures. In an international context like the Baltic Sea where countries differ with respect to eco-nomic development and institutional set-ups for environmental management, the implementation
costs of pollutant reduction options are likely to differ greatly between regions. Eckerberg et al. (1996) show that the implementation of measures reducing nitrogen loads from the agricultural sec-tor differs between Sweden, Denmark, Finland, Estonia, Latvia and Lithuania.
important for determining the cleaning effective-ness of coastal wetlands, and, hence, the costs for wetlands as an option for reducing nitrogen loads to the Baltic Sea. The empirical results must, therefore, be interpreted with caution. Due to these difficulties with the data and the other above-mentioned analytical simplifications, this study should be regarded as a first step towards a more appropriate analysis of the role of land as a pollutant sink in an international context.
Acknowledgements
I am very much indebted to R. Freeman, and two anonymous referees for their valuable com-ments. Financial support from Swedish Council of Agricultural and Forestry Research is grate-fully acknowledged.
References
Barbier, E., 1994. Valuing environmental functions: Tropical wetlands. Land Econ. 70 (2), 155 – 173.
Barbier, E., 1997. Valuing the environment as an input: appli-cations to mangrove – fishery linkages. In: So¨derqvist, T. III (Ed.), Wetlands: Landscape and Institutional Perspec-tives. Beijer International Institute of Ecological Econom-ics, Stockholm, Sweden.
Barett, S., 1990. The problem of global environmental protec-tion. Oxford Econ. Policy 6 (1), 68 – 69.
Brooke, A., Kendrick, D., Meeraus, A., 1992. GAMS, A User’s Guide. The Scientific Press, San Fransisco. Bystro¨m, O., 1998. The nitrogen abatement cost in wetlands.
Ecol. Econ. 26, 321 – 331.
Bystro¨m, O., 1999. Value of wetlands as a nitrogen abatement option. Environ. Resour. Econ., in press.
Dale, V., Russel, C., Hadley, M., Kane, M., Gregory, R., 1996. Applying multi-attribute utility techniques to envi-ronmental valuations: A forest ecosystem study. Draft report, Vanderbilt Institute for Public Policy Studies, TN. Eckerberg, K., Gren, I.-M, So¨derqvist, T. (Eds.), 1996. Poli-cies for combatting water pollution of the Baltic Sea: Perspectives from economics and political science. Occa-sional Papers Series, Beijer International Institute of Eco-logical Economics, Stockholm, Sweden.
Elmgren, R. (Ed.), 1997. Himmerfja¨rden — Changes in a nutri-ent enriched coastal ecosystem (in Swedish). Swedish Envi-ronment Protection Agency, Report No. 4565, Stockholm. Elofsson, K., 1997. Costs of agricultural reductions in the nitrogen load to the Baltic Sea. Licentiate thesis, Depart-ment of Economics, Swedish University of Agricultural Sciences, Uppsala, Sweden.
Freeman, A.M. III, 1991. Valuing environmental resources under alternative management regimes. Ecol. Econ. 3, 247 – 256.
Gren, I.-M., 1993. Alternative nitrogen reduction policies in the Ma¨lar region. Ecol. Econ. 7, 159 – 172.
Gren, I.-M., So¨derqvist, T., 1994. Economic valuation of wetlands. A survey. Beijer Discussion Papers Series No. 54, Beijer International Institute of Ecological Economics, Stockholm.
Gren, I.-M., 1995. The value of investing in wetlands as nitrogen sinks. Eur. Rev. Agric. Econ. 22, 157 – 172. Gren, I.-M., 1997. International coordination of Baltic Sea
nitrogen reductions. Beijer Discussion Papers Series, No. 105, Beijer International Institute of Ecological Economics, Stockholm, Sweden.
Gren, I.-M, Jannke, P., Elofsson, K., 1997. Cost effective nutrient reductions to the Baltic Sea. Environ. Resour. Econ. 10, 341 – 362.
HELCOM, 1993. The Baltic Sea joint comprehensive environ-mental action programme. Baltic Sea Environenviron-mental Pro-ceedings, No. 48, Helsinki, Finland.
Hoel, M., 1992. International environment conventions: The case of uniform reductions of emissions. Environ. Resour. Econ. 2, 141 – 159.
Jansson, A,., Folke, C., Langaas, S., 1995. Quantifying the nutrient retention capacity by wetlands in the large-scale drainage basin of the Baltic Sea. Beijer Discussion Paper Series No 69, Beijer International Institute of Ecological Economics, Stockholm.
Johanesson, A,., Randa˚s, P., 1996. Economic impacts of reduc-ing nitrogen emissions into the Baltic Sea. Paper presented at the EAERE VII conference, Lissabon, June, 1996. Kaitala, V., Ma¨ler, K.-M., Tulkens, H., 1991. The acid rain
game as a resource allocation process with an application to the international cooperation among Finland, Russia and Estonia. Scand. J. Econ. 97 (2), 325 – 343.
Kusler, J.A., Kentula, M.E. (Eds.), 1990. Wetland Creation and Restoration. The Status of the Science. Island Press, Washington, DC.
Markowska, A., Z:ylicz, T., 1996. Costing an international public good: The case of the Baltic Sea. Paper presented at the EAERE VII conference in Lissabon, June, 1996. Mitsch, W.J., Gosselink, J.G., 1986. Wetlands. Van Nostrand
Reinhold, New York.
Ma¨ler, K.-G., 1991a. Measuring environmental damage — The production function approach. In: Vincent, J.R., Craw-ford, E.W., Hoehn, J.P. (Eds.), Valuing environmental benefits in developing countries. Special Report 29. Michi-gan State University, East Lansing, MI.
Ma¨ler, K.-G., 1991b. International environmental problems. In: Helm, D. (Ed.), Economic Policy Towards the Environ-ment. Blackwell, Oxford.
Sta˚lnacke, P., 1996. Nutrient loads to the Baltic Sea. Doctoral thesis, Department of Water and Environmental Studies, Linko¨ping University, Sweden.
data base. Beijer Discussion Paper Series No. 63. Beijer International Institute of Ecological Economics, Stockholm.
So¨derqvist, T., 1996. Contingent valuation of a less eutrophi-cated Baltic Sea. Beijer Discussion Papers Series No. 88, Beijer International Institute of Ecological Economics, Stockholm.
Turner, K.R., Georgiou, S., Gren, I.-M., Wulff, F., Barett, S., So¨derqvist, T., Bateman, I.J., Folke, C., Langaas, S., Z:ylicz, T., Ma¨ler, K.-G., Markowska, A., 1999. Managing nutrient
fluxes and pollution in the Baltic: An interdisciplinary simulation study. Ecol. Econ., in press.
Wittgren, H.B., Rydlo¨v, M., Sunblad, K., Hasslo¨f, Robertsson, K., 1991. Wetlands — Vital ecosystems for nature and soci-eties in the Baltic sea region. WWF report to the HELCOM ad hoc High Level Task Force, Helsinki, Finland. Wulff, F., Niemi, A., 1992. Priorities for the restoration of the
Baltic Sea — A scientific perspective. Ambio 2, 193 – 195. Wulff, F., Stigebrandt, A., Rahm, L., 1990. Nutrient dynamics
of the Baltic Sea. Ambio 3, 126 – 133.