MODELLING THE APPEARANCE OF HERITAGE METALLIC SURFACES
Lindsay MacDonald 1, John Hindmarch 1, Stuart Robson 1 and Melissa Terras 2
1
Dept. of Civil, Environmental & Geomatic Engineering, UCL, London.
2Centre for Digital Humanities, Dept. of Information Studies, UCL, London.
Commission V
KEY WORDS: Cultural Heritage, Imaging, 3D model, Photogrammetry, Photometric stereo, Rendering, Specularity.
ABSTRACT:
Polished metallic surfaces exhibit a high degree of specularity, which makes them difficult to reproduce accurately. We have applied two different techniques for modelling a heritage object known as the Islamic handbag. Photogrammetric multi-view stereo enabled a dense point cloud to be extracted from a set of photographs with calibration targets, and a geometrically accurate 3D model produced. A new method based on photometric stereo from a set of images taken in an illumination dome enabled surface normals to be generated for each face of the object and its appearance to be rendered, to a high degree of visual realism, when illuminated by one or more light sources from any angles. The specularity of the reflection from the metal surface was modelled by a modified Lorentzian function.
1. INTRODUCTION
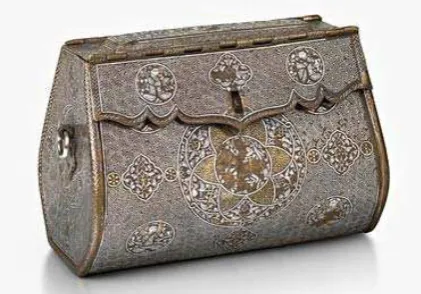
This is a case study of digital representations of a unique object in the collection of The Courtauld Gallery, London, formerly known as the ‘Courtauld wallet’. It was acquired by the Victorian collector Thomas Gambier Parry in 1858, probably in Venice, and was bequeathed to the Courtauld by his grandson in 1966. Made of brass inlaid with silver and gold, it is acknowledged as one of the finest and most intriguing pieces of Islamic metalwork in the world. Its sides are adorned with images of hunters, musicians and drinkers, and its lid with a scene of a couple enthroned together on a low dais. The man holds out a drink to his companion, and the pair are accompanied on either side by their retinues of servants. It was probably made in the period 1300-1320 for a patron in Il-Khanid (Mongol) Iran, and makes references to metalworking traditions in Mosul in Iraq. It portrays scenes of hunting and leisure that were common across the Near East, includes depictions of furniture and fashions unique to China, and presents an impression of authority and power (Ward, 2014). Despite the previous appellation as ‘wallet’, the function of the object was almost certainly as a handbag carried by the attendant of a high-status woman, so it is referenced in this paper as ‘handbag’ or simply ‘bag’. The Courtauld Gallery’s curator of sculpture and decorative arts approached UCL with a request to make a 3D model of the bag for an exhibition in Spring 2014, entitled Court and Craft: A Masterpiece from Northern Iraq’.
Figure 1. The Islamic ‘handbag’ at The Courtauld Gallery.
2. PHOTOGRAMMETRIC MODELLING
3D digitisation is, or is at least in the process of becoming, an established technique in the cultural heritage sector (Pieraccini et al, 2001). It is used for academic and professional purposes, such as documentation (Yastikli, 2007) or as an aid to restoration (Callieri et al, 2004) as well as public engagement through the provision of virtual objects online or in exhibitions. This project, in which a 3D model and a photo-realistic specular reconstruction were used to create a non-interactive animation, aimed to provide the gallery audience with an enhanced experience of the object.
2.1 Laser scanning
For an initial assessment the handbag was brought to UCL and scanned by the Arius 3D colour laser scanner. The bag’s bounding dimensions (WxHxD) are 220x152x135 mm, so multiple swathes would have been needed to cover all of the surface. The Arius has a scan line point spacing of 100 microns and a range measurement resolution of 25 microns, with R,G,B lasers to measure surface reflectance at wavelengths of 638, 532 and 473 nm respectively. Even before the bag had been thoroughly cleaned and restored prior to the exhibition, the predominantly silver surface exhibited a high degree of specularity, and we were unsure how well the scanner would cope. In fact the geometry was captured comprehensively, with very little occlusion. However there was a significant amount of noise and many areas of high reflectance overloaded the sensor, causing holes in the point cloud (Fig. 2) accompanied by clusters of ‘false points’.
Colour was also an issue, because the captured reflectance was very dependent upon the angle of the scan beam relative to the surface. These discrepancies made it impossible to combine the individual scans into one coherent coloured object, though the geometry was captured well enough for us to consider creating a colourless 3D model that could then be textured with photos or combined with the photogrammetric colour model. However, due to the estimated time it would have taken to scan the handbag fully from all angles (a minimum of two full days) and the resulting costs (transport and insurance, as well as the presence of a curator to handle the object) it was decided to abandon the laser scanner and proceed with just the photogrammetry. The International Archives of the Photogrammetry, Remote Sensing and Spatial Information Sciences, Volume XL-5, 2014
Figure 2. ‘Holes’ in the point cloud produced by the Arius 3D scanner in curved regions of high specularity.
2.2 Photogrammetric photography
Camera-based systems offer a cost-effective and flexible alternative to 3D laser scanning, enabling the geometry and texture of objects to be automatically modelled and visualized from digital imagery using freely available open-source software (Kersten and Lindstaedt, 2012). The photography of the handbag was carried out at the Courtauld Institute using a Nikon D3200 camera fitted with a 40mm lens, using settings of ISO 400, f/16 and 1/60s exposure. Illumination was provided by two Balcar studio flash lights fitted with ‘soft-box’ diffusers. When the camera had been focused, the lens was taped to prevent any accidental change and all settings were retained until after the calibration process was complete.
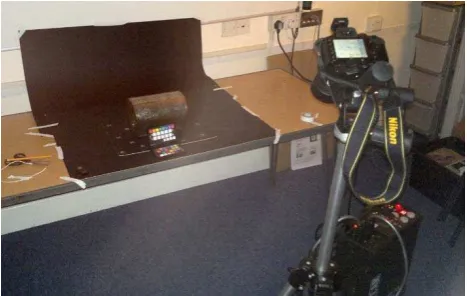
A small cove was created with a sheet of thin black card and the handbag placed on another black card marked with coded targets (Fig. 3). The camera was kept stationary (except for small movements for framing and focussing purposes), and the card used as a turntable to rotate the object without touching it. Each time the bag was placed in a new position (e.g, upright, upside-down and open), an X-Rite ColorChecker colour rendition chart was included in the scene to facilitate colour calibration.
Figure 3. Setup for photography of the handbag, showing cove, colour chart, camera on tripod and flash controller.
The handbag was first imaged upright with the lid closed, in three rings at different elevations of 16-18 images each. The lowest ring was as close to level with the object as possible, the highest at the steepest angle that could be achieved given the tripod and physical setup. The two upper rings were then repeated with the lid open, and finally the handbag was placed upside down and another two rings of images captured for the base. A further set of images, taken perpendicular to the bag’s main surfaces and at a 45° angle to corners were taken for potential texturing purposes.
The camera was calibrated from 16 images, using the same settings, of a calibration object with over 300 retro-reflective targets with known locations. The Vision Measurement System (VMS) software was used to calculate the intrinsic camera parameters. The raw (Nikon NEF format) image files were colour corrected using Adobe Lightroom 5.2 and the ColorChecker images, and a small amount of sharpening applied before the images were exported as TIFF files. Lens Distortion Correction (LDC), along with the VMS output, was then used to undistort the colour-corrected images.
2.3 Creating the 3D model
VisualSFM was used for feature matching and sparse reconstruction, and the output uploaded to a server with 64Gb memory on which Clustering Views for Multi-view Stereo (CMVS) and Patch-based Multi-View Stereo Software (PMVS2) were installed. Various sets of parameters for PMVS2 were tried, adjusting the ‘csize’ (cell size) to control the density of reconstructions, and ‘level’ to specify the level in the image pyramid used for computation, aiming for the densest point cloud achievable given the resources available. The best results were achieved with csize of 1 (the highest possible value) and a level of 1 (the second highest value, indicating that half-resolution images were used).
Figure 4. Screen-shot from VisualSFM, showing the camera poses relative to the object for all the images.
All point cloud processing was carried out with Pointstream 3DImageSuite. The first two models created were of the closed handbag, top and base, with each point cloud containing approximately 8 million dense, albeit noisy, points. The two models had their own arbitrary scales and coordinate system, hence they had to be scaled and registered to create the complete model. Scaling proved to be particularly troublesome because the noisiness of the point cloud made consistent and accurate measurements between features difficult. In total, between six and eight measurements were made of seven pairs of features on each model, and a scaling factor calculated for each feature pair. These scaling factors ranged from 3.595 to 3.560, but even after much manual 'tweaking' of the scaling (an iterative process of registering the two models using the Pointstream ICP algorithm, then manually adjusting the scale factor in small increments), any value used caused noticeable digital artifacts where the two models overlapped. This was exacerbated by the regular high-frequency patterning on the handbag, which accentuated every small discrepancy. It would have been less of an issue if the handbag had been covered with a natural or random texture. The International Archives of the Photogrammetry, Remote Sensing and Spatial Information Sciences, Volume XL-5, 2014
Having established the difficulty in scaling the two models, another approach was tried. Each of the colour-corrected, undistorted images was edited manually using GIMP, and all of the coded targets were painted out. Because of the coving, this resulted in the handbag appearing to float on a completely featureless black background. When all the available images (the five rings consisting of the handbag in both orientations and the images intended for texturing) were used as an input to VSFM, it created a virtual network, as if the camera was able to orbit the model in any direction (Fig. 4). The network was still processed by PMVS2 as two clusters, due to memory constraints, but the resulting models were both scaled in the same coordinate system, so no more work was needed to register them.
The final model created was the top of the handbag with the lid open. Unfortunately, the scaling problem reappeared, as it was impossible to photograph the base of the handbag with the lid open in the same position as when the bag was upright. However, this issue was less significant as there were only two areas of interest: the underside of the lid, which connected with the other model along the hinge-line, and the area under the front flap of the lid. All other data was erased, and a process of iterative registration and scaling was undertaken to combine the two new areas with the previous ‘closed model’ which had the lid erased. The scaling process was simpler as we were effectively dealing with a single two-dimensional surface. Any inconsistencies were mitigated by merging the two models along the edges of the roundels and other macro features on the front, minimising the areas where the high-frequency patterns on the two models met.
2.4 Point cloud processing: Exterior
The 3D models suffered from a variety of issues. The point cloud was noisy, even though this was only really apparent when zoomed in. There were also numerous small holes, and (similar to the laser scan) these appeared in areas with the highest specularity, predominantly the larger, flatter areas in the roundels. These holes, though numerous (in the order of several hundred pixels), were mostly easy to fill with Pointstream tools.
The point density was also variable, with the area around the middle of the handbag (where the two clusters met) showing a markedly less dense point distribution than other areas. There were also issues with colour matching, due to the handbag’s shininess and the differing lighting conditions, both as it was rotated and as it was placed in different orientations. This effect was most noticeable around the middle, where the two clusters met. This was improved by altering the colour balance (contrast and brightness) of the two clusters, but it is still noticeable. Other problematic areas were the two rings on either end of the handbag, which were the only areas where occlusion was an issue. Also the rings themselves were both smooth and highly polished, and thus were not captured well.
The overriding issue was that Pointstream software was designed to work with structured raster data from the Arius scanner. Importing photogrammetric data from another source led to some performance issues. The final model, including the hole-fills and the interior, had approximately 30 million points, and this was at the limit of what the program could handle.
2.5 Point cloud processing: Interior
Of all the outputs required by the Courtauld Institute, the view of the handbag with the lid open was the most important. This would reveal areas (the underside of the lid, the front of the handbag under the lid flap and the interior), none of which was accessible in the gallery (in the exhibition the handbag was displayed
closed). These areas are of considerable interest, as they reveal some of the manufacturing techniques, and damage done to the bag as it was altered and re-purposed over the last 700 years.
A model of the open handbag showing the front and lid had been created, but only very small, sparse areas of the interior had been reconstructed from the images. Even after a second attempt at photography, concentrating on the bag’s interior, it proved impossible to reconstruct using photogrammetric techniques. This was probably due to the difficulty in achieving consistent lighting of the interior, but also the geometry of the object itself – a convex, bulbous shape with only a narrow opening. Instead, the point cloud was imported into Geomagic and a colourless mesh created. The mesh was decimated and simplified several times until we had 10,000 triangles approximating the handbag’s overall shape. Images of the interior were then used to texture this mesh, which was imported back into Pointstream and converted into points. This interior model was shrunk by a small amount and, after an initial rough registration, was transformed manually so that it sat inside the handbag as a ‘second skin’.
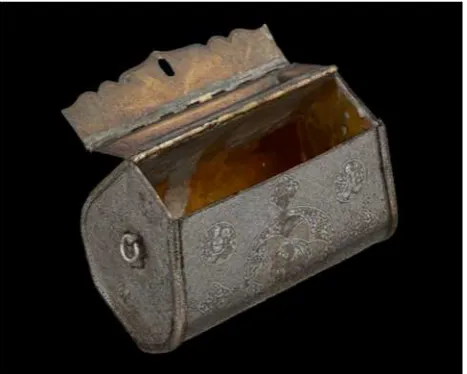
The results of this process were not perfect by any means, and the textured interior does not have the same photo-realistic quality as the exterior. However, it is good enough, given the required output, to provide an impression of the inside. It allowed the gallery to display the open bag model, showing off the underside of the lid and the otherwise-hidden front panel (Fig. 5).
Figure 5. Rendered 3D model of the handbag, showing both exterior and interior views.
2.6 Video output
The principal deliverable required by the Courtauld was a video to be displayed in the gallery during the exhibition. Having the digital model on display in the same room as the real object introduced a certain amount of pressure, though the fact that it was a non-interactive pre-rendered video meant we had complete control over what the viewer would see. So we could aim for a particular aesthetic output without, for instance, having to worry about the object’s appearance at different zoom levels, or about areas that would never be seen. Hence the model used to render the video of the open bag had the entire base deleted, purely to reduce the model size and improve performance. As the user never sees this area, we could get away with it. The video was rendered in Pointstream, generating a series of 900 jpeg images of 1920x1080 pixels for 30 seconds of HD video at 30 fps as the model turns through 150° on a virtual turntable. The individual frames were composited into a movie using Virtualdub software. The International Archives of the Photogrammetry, Remote Sensing and Spatial Information Sciences, Volume XL-5, 2014
3. RENDERING FROM PHOTOMETRIC STEREO
The dome imaging system at UCL enables sets of images of an object to be taken with illumination from different directions. A hemisphere of 1040mm diameter is fitted with 64 flash lights, calibrated so that the geometric centroid of every light source is known to within 3mm. A camera fixed at the ‘north pole’ captures a series of 64 colour images, each illuminated by flash light from a different direction, all in pixel register. This provides a much richer dataset than a single image, and opens the way for characterising the texture, gloss and geometry of the object surface and for visualising its appearance in any lighting.
Sets of 64 images of the Courtauld handbag were taken in the UCL dome by a Nikon D200 camera (Fig. 6). An 18-55mm zoom lens was used for the top view, set to focal length 55mm and aperture f8. For details of the roundels, a 105mm lens was used, set to aperture f11.
Figure 6. Placing the handbag on the baseplate of the UCL dome. For photography the hinged upper part was lowered onto the frame, so that the object was completely enclosed. Photograph by Jananne Al-Ani.
3.1 Photometric stereo
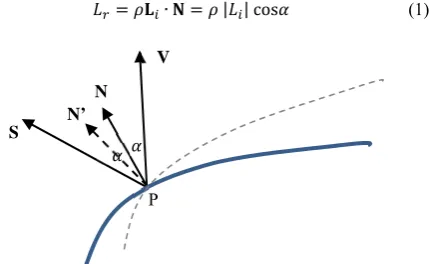
The photometric stereo technique enables the normal vector at each point of the object surface to be determined for a single viewpoint, using the principle that the intensity of the reflected light depends on the angle of incidence of the light onto the surface. With a perfectly Lambertian surface and in the absence of noise, only three intensity values from non-coplanar light sources would be sufficient to solve for both normal direction
and surface albedo ρ:
∙ | | cos (1)
Figure 7. Geometry of specular reflection, showing distortion of the normal vector.
In practice, better results can be obtained for noisy image data by taking the median of results for many triplets of light sources (MacDonald and Robson, 2010), but this does not give the correct solution for a non-Lambertian surface. Consider the geometry of Fig. 7 at point P on a curved shiny surface. The view vector V, passing through the perspective centre of the camera lens, subtends an angle α with the normal N. Any lamp near the specular vector S, at an angle of α from N and 2α from V, will produce an intensity in the image greater than would be produced by a matte surface. In the solution of the photometric stereo equations (1) this is interpreted as if the surface normal were orientated closer to S than it actually is, producing the distorted normal N’. Thus the effect of surface gloss is to exaggerate the apparent surface gradient (dotted line).
Real surfaces are non-Lambertian and non-planar, and so exhibit both gloss and self-shadowing from oblique lighting. Although the mean illuminance of the surface increases with illumination angle, as one would expect, the shadowing is severe at low incident light angles, especially for the lowest tier of lamps in the dome with an elevation less than 10°. Also the shiny surface produces very bright areas at different positions in the images, requiring (ideally) a high dynamic range (HDR) imaging strategy. The problem is therefore how to select the best subset of all the intensity values at each pixel to avoid both shadows and specular highlights.
Various ways of compensating for shadows and highlights in photometric stereo have been proposed. Julia et al (2008) had an alternation technique to decompose the measurement matrix, containing the intensity images, into separate surface and light source matrices. The shadows and saturated regions were considered as missing data, and so did not influence the results. Chandraker et al (2009) used a shadow labelling algorithm based on fast graph cuts as input to a photometric stereo algorithm using multiple light sources. Drew et al (2012) used the inliers found from luminance regression, and were able to identify both specular and shadow pixels, model their contribution, and interpolate data for out-of-sample lighting directions.
Figure 8. Roundel on front of handbag illuminated by lamp 48, at a ‘one o’clock’ position and an elevation of 45°.
A new method for estimating normals has been developed (MacDonald, 2014), which is robust and adapts to the presence
V
N
S N’
P
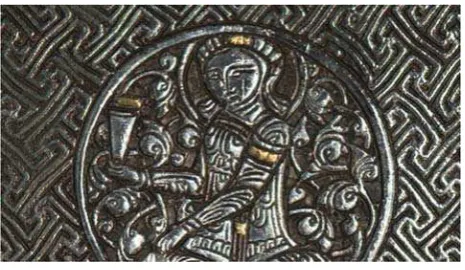
of both shadows and specularity. As an example, a detail is taken from the front of the handbag under the flap (see Fig. 5), above and to the right of the central mandala, showing a seated drinker (Fig. 8). The image is 1500 pixels square, representing a surface area of ~30mm square at a resolution of 50 pixels/mm.
First all 64 intensity values at a pixel are extracted from the image set and treated as a vector. A monochrome calculated as the weighted sum of R,G,B values is used. As an example one pixel is here selected (from the detail of Fig. 8) on the silver of the circular border to right of face. Plotting the 64 values against lamp number (Fig. 9) shows the wide variation in intensity for different lamp angles, with peaks for lamp numbers 31, 48 and 60. Also plotted for comparison (in magenta) is the low intensity that would be expected from a perfect Lambertian surface of the same albedo illuminated by the same lamps. It is clear that there is a strong specular reflection from the surface for the few lamps close to the specular angle relative to the camera viewpoint.
Figure 9. Actual intensity values in a 3x3 neighbourhood of a single pixel for 64 illumination directions, compared with a similarly-illuminated perfect diffuser.
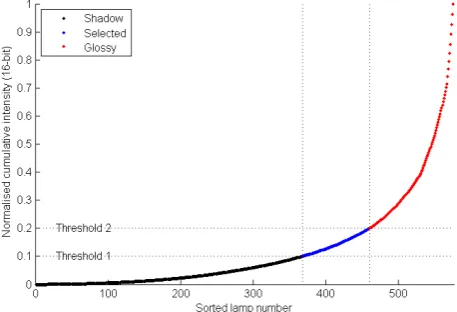
The intensity values are sorted into ascending order and the cumulative sum calculated (Fig. 10). The subset of lamps is selected for which the normalised cumulative values lie between two thresholds, set to 0.1 and 0.2. In the example for this pixel, 94 values out of the total 576 (=3x3x64) are selected. Regression is then applied over the corresponding subset of lamp vectors to solve Eq. (1) to estimate the normal and albedo at every pixel (Fig. 11). The selected subset lies above all cases where the pixel is in shadow, but below cases where there is a specular component added to the underlying diffuse component. The colour albedo arising from this procedure is a good approximation to the intrinsic diffuse component of surface reflectance, which for metals is rather dark.
Figure 10. Cumulative distribution of sorted intensity values
Figure 11. A detail of a roundel design on the Islamic handbag showing: (left) albedo; (right) surface normals.
3.2 Determining Specular Angle
The ratio between the actual intensity for each lamp direction and the intensity that would be produced by a perfect diffuser for the same direction (black and magenta values in Fig. 9) is a measure of the specularity of the surface. We call this the ‘specular quotient’ and it ranges in value between 1.0 for a perfect diffuser to ∞ for a perfect mirror. For the roundel the values calculated for each pixel are distributed over the range 1-300 (Fig. 12).
Figure 12. Image and histogram of specular quotient values.
In conventional practice in computational photography it is almost universally assumed that the specular angle should be exactly double that of the normal, and for a perfect mirror this would of course be true. But real-world surfaces have a meso-structure with fine texture and granularity. The patina of old objects includes toolmarks, scratches, dents and all the ac-cumulated effects of age and wear. One pixel as sampled by the camera may span a number of micro-facets at different angles, which reflect light differently from the incident illumination.
Figure 13. (left) specular normal vectors; (right) specular colour The International Archives of the Photogrammetry, Remote Sensing and Spatial Information Sciences, Volume XL-5, 2014
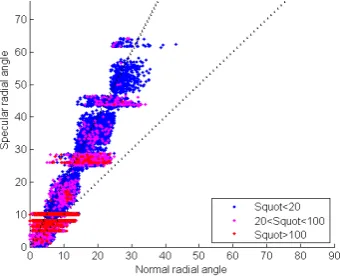
The approach taken in this study for calculation of the specular angle is to use the ideal specular vector (at double the angle of the normal) as a guide to where the specular angle should be. A weighted sum is taken of all lamp vectors within a cone of 20° around this direction, using the specular quotient to determine the weighting of each lamp. This yields a ‘specular normal’ vector for each pixel (Fig. 13 left). Plotting the specular vs normal angles for a random selection of 10,000 pixels (Fig. 14) shows that although the majority of pixels lie close to the line of slope 2 (i.e. specular angle = 2x normal angle), there is a considerable amount of scatter which is a genuine indication of the roughness of the surface. Some clustering onto the five tier angles of the dome is evident in pixels of high quotient values (shown in red).
Figure 14. Specular vs normal angles for 10,000 pixels, classified by specular quotient value.
The specular colour is also calculated for each pixel using the same weighting coefficients as multipliers on the R,G,B values of the pixel in those images corresponding to the selected lamp vectors (Fig. 13 right). The specular colour for glossy surfaces on the majority of materials is the colour of the illumination, but for metals it is the colour of the metal. The effect is particularly striking for gold (see MacDonald et al, 2014).
3.3 Modelling Angular Distribution
The aim is to model the luminance variation at each point on the object surface as a function of illumination angle, in such a way that reconstructed images are indistinguishable from the original photographs. This would enable views of the object to be ‘relit’ for illumination angles between those of the lamps in the dome, and so provide the basis for rendering the changing appearance of the surface under a light source in continuous motion.
A complete model would accommodate the bidirectional reflectance distribution function (BRDF), with four degrees of freedom, giving the surface reflectance at any viewpoint when illuminated from any direction. In the case of dome imaging, however, the viewpoint is fixed with the camera always at the ‘north pole’ of the hemisphere and the object lying in the equatorial plane. So the problem is simplified to finding a two-dimensional function of the reflectance factor toward the camera, given the normal and lamp vectors. A further simplification is to assume that the function of reflectance is isotropic and therefore rotationally symmetric, i.e. dependent only on the radial angle ω from the peak but not on the phase angle around the peak. The required function needs to be positive, continuous and monotonic, with a peak at ω=0 and asymptotic to zero as ω→90° (excluding the Fresnel component at grazing angles). Plotting the specular quotients against radial angle from the specular peak (Fig. 15) in a 3x3 region shows the typical scattered distribution, with large values at small angles falling to a ‘knee’ between 20° and 30° and then a long tail out to 90°, asymptotic to unity.
Figure 15. Specular quotient distribution in a region 3x3 pixels.
In the computer graphics community, motivated by the desire for realistic rendering from models, there have been many proposals for a specular function, based on statistical distributions of the reflectance from micro-facets on the surface. The simplest function is a Gaussian / , formulated by Beckman (1963) for surface scattering based on the Kirchhoff scalar diffraction theory. Trowbridge and Reitz (1975) based a function on
cos . Ward (1992) chose a variant of the Gaussian based on . More recently, Bagher et al (2012) studied BRDF measurements of shiny materials and showed that they do not follow the Beckmann distribution. Instead the micro-facets are more likely to be aligned with the surface normal, resulting in a sharper peak. They also noted the broader flanks in real distributions and proposed a function based on / /√ .
Plotting these functions together, with parameters adjusted to give the same width at half maximum amplitude (Fig. 16), shows that for small angles the Ward function is almost identical to a Gaussian and that it falls quickly to zero with little amplitude in the flanks beyond 5°. The Trowbridge and Reitz function is broader, extending to about 10°, and the Bagher function is broader still, extending to about 15°. The Lorentzian function has the broadest flanks, extending out to beyond 45°.
Figure 16. Five specular functions of angle.
The model adopted in this investigation to fit the specular peak is based on the Lorentzian function, because it naturally fits the observed shape and is mathematically convenient. During analysis of various materials it was found that the flank of the specular quotient distributions varies in slope according to the roughness of the surface, and the final version of the model therefore consists of a sum of two components, a Lorentzian peak and a linear flank, each with two parameters for amplitude and scaling:
/ (2)
where acosd ∙ is the angle in degrees between the lamp vector and specular vector. The fitted peak and flank components and the combined function are shown in Fig. 17.
Figure 17. Lorentzian peak and linear flank functions fitted to distribution of specular quotient values.
The complete model for a single light source takes the form of a sum of diffuse and specular terms:
∙ 1 / (3)
where is the albedo colour, is the specular colour, is the monochrome albedo (weighted sum of the R,G,B channels of ), and is the monochrome specular intensity.
A ‘flyover’ video at HD resolution was constructed, with each frame of 1920x1080 pixels computed from the model, while the light source moved to successive positions in a scripted trajectory. Increments in illumination angle of 0.1° were sufficient to give the illusion of continuous motion. Pan was also included by translating the crop window by one or two pixels in each frame, and zoom by rendering a smaller crop area then enlarging to the HD video frame size. The frames were composited using Windows MovieMaker. The results were indistinguishable from real video footage (Fig. 18) and were integrated with the video sequence of the rotating 3D model.
Figure 18. One frame of the HD video flyover, showing the simulated appearance of the roundel with a virtual light source from a low angle in the east.
In conclusion, we have shown how two completely different techniques for rendering a metallic object were successfully employed to produce a video for public exhibition. By modelling surface normals and the specular highlights from silver and gold a highly realistic impression of the handbag was achieved.
ACKNOWLEDGEMENTS
We acknowledge the great assistance and support from Alexandra Gerstein (The Courtauld Gallery’s curator of sculpture and decorative arts) and Rachel Ward (the exhibition’s guest curator) in providing access to the handbag for photography and integrating the video into the exhibition. See:
www.courtauld.ac.uk/gallery/exhibitions/2014/Court-and-Craft
and www.youtube.com/watch?v=YCn6mQ0pplo.
REFERENCES
Bagher, M., Soler, C. and Holzschuch, N., 2012. ‘Accurate fitting of measured reflectances using a shifted gamma micro‐facet distribution’, Computer Graphics Forum, 31(4), 1509–1518. Beckmann, P. and Spizzichino, A., 1963. Scattering of Electro-magnetic Waves from Rough Surfaces, Pergamon Press, NY. Callieri, M., Cignoni, P., Ganovelli, F., Impoco, G., Montani, C., Pingi, P., Ponchio, F. and Scopigno, R., 2004. Visualization and 3D data processing in the David restoration, IEEE Computer Graphics and Applications, 24(2), pp.16-21.
Chandraker, M., Agarwal, S. and Kriegman, D., 2007 ‘Shadow Cuts: Photometric stereo with shadows’, Proc. IEEE Conf. on Computer Vision and Pattern Recognition (CVPR), 1–8. Drew, M., Hel-Or, Y., Malzbender, T. and Hajari, N., 2012. ‘Robust estimation of surface properties and interpolation of shadow/specularity components’, Image and Vision Computing, 30(4), 317–331.
Kersten, T.P. and Lindstaedt, M, 2012. Image-Based Low-Cost Systems for Automatic 3D Recording and Modelling of Archaeological Finds and Objects, Progress in Cultural Heritage Preservation, Lecture Notes in Computer Science Vol. 7616, Springer, pp. 1-10.
MacDonald, L.W. and Robson, S. 2010. ‘Polynomial texture mapping and 3D representation’, Proc. ISPRS Commission V Symp. ‘Close-Range Image Measurement Techniques’, Newcastle.
MacDonald, L.W., 2014. Colour and Directionality in Surface Reflectance, Proc. Artificial Intelligence and the Simulation of Behaviour (AISB), Goldsmiths College, London, April.
MacDonald, L.W., Guerra, M.F., Pillay, R., Hess, M., Quirke, S., Robson, S. and Ahmadabadian, A.H., 2014. ‘Practice-based comparison of imaging methods for visualization of toolmarks on an Egyptian Scarab’, Proc. Intl. Conf. on Image and Signal Processing (ICISP), Cherbourg.
Julia, C., Sappa, A., Lumbreras, F., Serrat, J. and López, A., 2008. ‘Photometric stereo through an adapted alternation approach’, Proc. 15th IEEE Intl. Conf. on Image Processing (ICIP), 1500–1503.
Pieraccini, M., Guidi, G. and Atzeni, C. 2001. 3D digitizing of cultural heritage, Journal of Cultural Heritage, 2(1), pp.63-70. Trowbridge, T. and Reitz, K., 1975. ‘Average irregularity representation of a roughened surface for ray reflection’. J. Opt. Soc. Am. 65(5) 531–536.
Ward, G., 1992 ‘Measuring and modeling anisotropic reflection’,
ACM SIGGRAPH Computer Graphics, 26(2) 265–272.
Ward, R. (ed.), 2014. Court and Craft: A Masterpiece of Northern Iraq, Exhibition Catalogue, The Courtauld Gallery in assoc. with Paul Holberton Publishing, London, pp. 95-97. Yastikli, N., 2007. Documentation of cultural heritage using digital photogrammetry and laser scanning, Journal of Cultural Heritage, 8(4), pp.423-427.