A PROMPT METHODOLOGY TO GEOREFERENCE COMPLEX HYPOGEA
ENVIRONMENTS
S. Troisi a, V. Baiocchi b, S. Del Pizzo a, F. Giannonec a
Parthenope University of Naples, Centro Direzionale Isola C4, Naples, Italy - (salvatore.troisi, silvio.delpizzo)@uniparthenope.it b
Sapienza University of Rome, DICEA, Via Eudossiana 18, 00184 Rome (Italy) - [email protected] c
Niccolò Cusano University Via Don Carlo Gnocchi 3, 00166 Rome (Italy) - [email protected]
Commission II
KEY WORDS: Photogrammetry, Videogrammetry, Structure from Motion, Cultural Heritage, 3D modeling, Georeferencing, Visual Navigation
ABSTRACT:
Actually complex underground structures and facilities occupy a wide space in our cities, most of them are often unsurveyed; cable duct, drainage system are not exception. Furthermore, several inspection operations are performed in critical air condition, that do not allow or make more difficult a conventional survey. In this scenario a prompt methodology to survey and georeferencing such facilities is often indispensable.
A visual based approach was proposed in this paper; such methodology provides a 3D model of the environment and the path followed by the camera using the conventional photogrammetric/Structure from motion software tools. The key-role is played by the lens camera; indeed, a fisheye system was employed to obtain a very wide field of view (FOV) and therefore high overlapping among the frames. The camera geometry is in according to a forward motion along the axis camera. Consequently, to avoid instability of bundle adjustment algorithm a preliminary calibration of camera was carried out. A specific case study was reported and the accuracy achieved.
1. INTRODUCTION
1.1 Motivation
Nowadays every modern city has a complex structure of subterranean spaces. Most of them are used to provide an efficient transit system traffic free (i.e. subway, underpass, etc.); while others host a series of infrastructures as several cable ducts or drainage system. Every underground space should be accurately mapped and georeferred in order to simplify both the routine and extraordinary maintenance. Actually, the most part of the big cities has not an accurate map of the underground space, although new evolution of GIS (Geographic Information System) technology are starting to allow the management of such data. Indeed, during the last years several projects have emerged to implement a smart city model based on a BIM (Building Information Modeling) (Hergunsel, 2011), in order to achieve a strong interoperability among different systems. Moreover, while new infrastructures are accurately mapped, the old one are often unsurveyed.
Generally, whichever type of metric survey, carried out in indoor or in hypogea environment, is expressed in a Local Reference System (LSR), which in turn is linked to a global reference system, such as the geocentric coordinate system ETRS-2000. Not always the relationship between the LRS and the global one is well-known, although this information is essential to implement a BIM. Such relationship parameters could be determined by a classical topographic survey with total station, where the accuracy and precision achievable are strictly related to the survey adopted techniques (i.e. open and/or close traverses); of course, the specific technique adopted is conditioned by several factors: the morphology and position of
the hypogea site, the extension of the site, the number of breaches that allow to reach open spaces.
In specific critical cases, when the extension of hypogea site is huge and the quality of the air can change quite rapidly even becoming unbreathable, could be suitable a different kind of survey: speeder than the topographic one, even if less rigorous. The aim of this work is to positioning in global reference system a target site located in hypogea environment; testing the opportunity to employ a prompt approach based on the image acquisition, that allows to survey and to georeferencing a complex network of underground tunnels.
This methodology is based on Structure from motion (Sfm) algorithms, which works on videotape recording. The solution proposed in this paper is taking pictures (video frame) by a single camera during tunnel advancing. In order to ensure a wide FOV (Field of View) a fisheye lens was employed. In post-processing, a commercial software of photogrammetry was used to obtain the track of camera movement as well as the reconstruction of 3D model of the hypogea environment.
1.2 Related Works
Generally, the tunnel survey is performed using high -performance topographic system; although, the main purpose of this specific survey is to inspect the tunnel structure, mostly such solution provides a mapping of the entire tunnel.
In specific environmental conditions such type of instruments are not suitable; for example, in France 42 km of underground waterway are fully operative and they require continuous inspection. In this particular case an alternative to the traditional topographic instruments is to be found. The photogrammetry and laser - scanning techniques provide reliable and precise results and they are not time-consuming techniques allowing to
do not interfere with the navigation traffic (Charbonnier et al., 2013). The photogrammetric technique is employed during tunnel construction as well, indeed while tunnelling advance a single camera is used to take pictures of the tunnel surface from several positions. Therefore, collected images are processed to obtain a dense 3D reconstruction of the tunnel surface (Bauer et al., 2015). The latter methodology is not very fast; but of course the survey has to follow the excavation and it does not require quickly procedures.
On the other hand, a community who works with the autonomous mobile robotic is very interested to achieve a good knowledge of the environment, that involves the creation of digital map of such environment. The main aim of this group of researchers is to develop computationally efficient algorithms that can provide adequate real-time information about the robot position as well as its surrounding obstacles in order to achieve a good degree autonomous navigation (Thurn, 2002). Good results in terms of speed and accuracy are provided from SLAM (Simultaneous Localization And Mapping) techniques (Thurn et al., 2000). SLAM solutions are generally based on the optimization of the classical structure from motion algorithms (Mouragnon et al., 2009), even though the recent approaches integrate several instruments, such as range cameras or laser scanning (Biber et al., 2004), (Cole et al., 2006). The main goal of SLAM is to provide the mapping of an environment in real-time.
In order to reach more coverage of the environments a fish-eye camera was employed by several authors (Häne et al., 2014) (Caruso et al., 2015). Generally, in most cases the path followed by the camera is closed, therefore the environment map is updated frame by frame. Few cases study tackles open path in indoor survey; specifically, a study about a vision-based mapping and localization system for operation in pipes using a single fisheye camera mounted on micro-robot (Hansen et al., 2013). Meanwhile, another very interesting work carried out a 3D motion track of a stereo laparoscope employed for endoscopy in minimal invasive surgery purposes (Chang et al., 2014). SLAM is considered to be a complex problem because to localize itself a robot needs a consistent map and for acquiring the map the robot requires a good estimation of its location. During last years, several approaches were developed to tackle the SLAM problem, meanwhile several methodologies were applied to establish performances and accuracy benchmarking (Kümmerle et al., 2009), (Nardi et al., 2015).
2. SURVEY SETUP
2.1 Site description
The ancient Romans mined the soft rock from underground to
erect the building (i.e. tuff or “pozzolana”); actually this activity
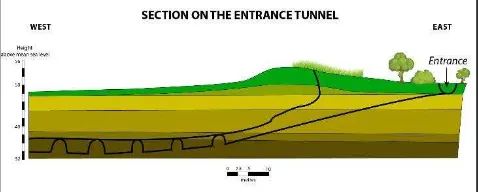
was carried out till the middle of twentieth century. Such action has involved the appearance of a series of tunnels, about 10-15 meters deep, realizing a complex labyrinth in Rome underground (Figure 1).
Figure 1. Section of the tunnels network entrance.
Such quarries were also employed as air-raid shelter during the second world war, whereas actually some of them are used for mushrooms cultivation. The largest proportion of them are closed to the public access. There is no topographic map of this intricate labyrinth excavated from more than 2000 years ago, furthermore the total extension is still unknown.
There are several entrances to this complex network and no one knows which series of galleries are connected each other, thus some of these galleries are interested by cave-in so that not all the network is accessible. In this application an accurate mapping of a part of this complex system was needed to find the planimetric position of a specific point of one of these galleries located in the southern part of the city.
Several researchers focused their activity about the survey of underground structure, such as necropolis (Remondino et al., 2011) or catacomb (Bonacini et al., 2012). Generally, the aim of these works is to produce a complete and high quality documentation of the architecture and painting of the site, combining several methodologies (i.e. laser scanning, photogrammetry, geo-radar etc.) (Mayer et al., 2007).
Very low luminosity is a typical feature of a hypogea environment, therefore the laser scanner is usually employed as main instrument, while the photogrammetry is generally used to obtain a high-quality texture. The results are very impressive, and the quality of the survey is very high, but these techniques are very time-consuming. electric energy, therefore there is no lighting system; and there is no an artificial ventilation to clean air inside.
The survey operations have to be performed as soon as possible, indeed both the air quality inside tunnels and the battery life of portable flashlights do not allow to stay long. Furthermore, for heritage conservation reasons is not allowed to leave permanent and invasive markers.
2.2 Photogrammetry Setup
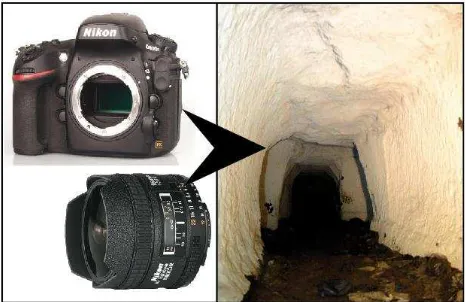
The survey was carried out using a full frame DSLR camera Nikon D800E with a Nikkor 16 mm fish-eye lens pre-calibrated. Fisheye lens provides a diagonal FOV (Field of View) almost of 180°. The choice of fisheye lens allows to achieve large overlap between two consecutive frames. The camera was set in video mode and recording was performed in standard HD (High Definition) 1080p on 30 fps (frame per second). Such camera settings allow to obtain a pixel size of 18.7 micron.
2.2.1 Camera calibration:
The camera calibration procedure is a fundamental task in the photogrammetric workflow. The well-known self-calibration method (Fraser, 1997) is generally used to determine the camera calibration parameters.
Specifically, this technique employs analytical calibration methods to derive the calibration parameters indirectly from photogrammetric image coordinate observations. The mathematical model is the classical Brown model (Brown, 1971), that is composed by classical internal orientation parameters (principal distance, coordinates of principal point, pixel size) extended by the inclusion of additional parameters that model the image distortion effects. Once the mapping between a distorted image and its corresponding perspective image is obtained, the calibration problem is solved.
Generally, an inexpert end-user, who uses one of the most popular solution for automated image orientation, performs a
special procedure of self-calibration indicated as “on the job” (Lhuman et al., 2007). This last procedure is not always suitable to compute correctly the interior orientation parameters; indeed, a weak geometry of the network camera frame and the lack of ground control point could provide results with low accuracy and reliability (Nocerino et al., 2014).
Figure 2. On the left is shown the Nikon D800E and fisheyes lens adopted: Nikkor 16mm, on the right a generic frame
recorded during the survey.
For this work fisheye lens were used, such lens utilises a different optical design that departs from the central perspective imaging model to produce image circles up to 180° (Figure 3). If the image format sensor is larger than the resultant image circle, the camera is termed as fisheye system. Conversely, as shown in Figure 3 if the format is smaller than the image circle, such that the image diagonal covers about 180° of field of view, a quasi-fisheye system is attained (Figure 3).
Figure 3. Representation of full frame fisheye lens. In yellow the image circle, in red the coverage of the FX sensor; while the
orange dotted line shows the sensor active area during the acquisition.
It is well known that under planar perspective projection, images of straight lines in space have to be mapped into straight lines in the planar perspective image. However, such assertion, for fisheye cameras, is not true: the central perspective mapping is replaced by another model such as stereographic, equidistant and orthographic projection.
When modelling the distortions in a fisheye lens, conventional radial lens distortion corrections are mathematically unstable. On the peripheral region of the image sensor the gradient of the distortion curve describing the departure from the central
perspective case is high. In such a case is necessary to apply the appropriate fisheye lens model before using the conventional radial distortion model (Lhuman et al., 2014).
In this work, as shown in Figure 3, a quasi-fisheye system was realized, therefore the peripheral portion of image circle is not recorded on the sensor and the fisheye distortions can be modelled using the conventional perspective camera model and its classical radial distortion coefficients. Such model is more flexible than the fisheye model, because can be exported in any photogrammetric software as well as integrated in any Structure from motion algorithm.
The camera was preliminary calibrated in controlled environment before starting survey operations. Two type of calibration camera models were made in use:
1. Fisheye camera, it is the rigorous camera model, it combines the kinds of distortion: fisheye lens provided and conventional ones.
2. Perspective camera, it is classical model used in photogrammetry in according to the Brown one. It uses only the conventional distortion model.
The fundamental parameters of two models are reported in Table 1. Note that the distortion coefficients are very different between them, indeed the fisheye camera model departs from the perspective one, introducing radial distortions yet.
Table 1. Comparison of Camera Calibration Parameters Model Perspective camera Fisheye camera
Focal [pixel] 923.95 917.27
K1 -0.3242916 -0.0335356
K2 0.1219527 0.0039540
K3 -0.02844459 -0.041438
Of course the Table 1 does not quantify the differences from the two models, for this reason the two lens distortion curves are plotted in Figure 4. Basically, the two curves are identical, just on the image periphery the difference is few pixels.
Figure 4. Radial distortion curves: in blue the distortions obtained using frame camera model, while in red the distortions
determined with the fisheye camera model.
2.2.2 Acquisition phase
The acquisition phase started outside with the aim of acquire sufficient targets to georeferencing the entire survey. The camera operator, slowly, brought it toward the downhill to the tunnel labyrinth. The transition between the very bright environment (open-air) and the dark location (tunnels) was gradually performed. Focus camera was set to infinite, and aperture was maximum; while the sensitivity of digital image
system ISO automatically changed, to adjust the great bright gradient. The data collection continues holding the optical axis aligned with the path axis (Figure 5).
The acquisition phase lasted less than two hours, to cover about 1 Kilometre, and it consisted in a simple video tape acquisition recorded during the path. For the duration of the acquisition some cautions were taken: the light source is never located in front of the camera and within the scene no person or moving object was detected, except for the shadow of the camera operator projected by the light source located behind him.
Figure 5. Camera geometry carried out during the acquisition phase
As shown in Figure 5 the camera is moving forward along optical axis.
2.2.3 Geometric adjustments
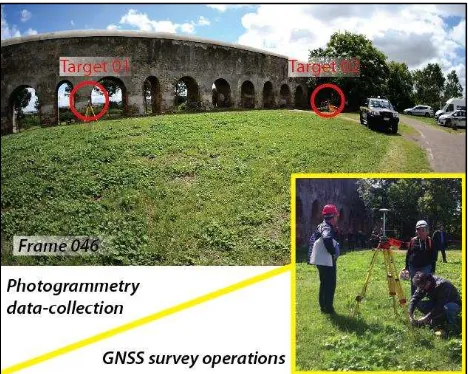
To link the photogrammetric survey to the global ETRS-2000 system three targets were positioned outward. Therefore, these targets were measured using differential double frequencies GNSS techniques. Each target a fast-static session (at least 20 minutes) was carried out.
Of course, such constrains do not provide a strong georeferencing and scaling for the survey. Consequently, in order to increase the metric reliability, during the path, several distances were measured, such operations allowed to contain the deformations of photogrammetric model as well.
The tunnel network was very complicated and it did not offer others accesses to the surface. Anyway during the acquisition several structures were noted, but just one was used to control the final solution.
3. ELABORATION AND RESULTS
3.1 Image relative orientation
The acquired video was processed using a classical procedure employed in 3D image-based modeling by sampling, in average, a frame every 1/3 seconds, for a total of 4425 camera stations. In order to correctly positioning the light source, the video tape was recorded not continually, indeed 33 video clip were acquired. As a consequence, the survey was divided into several photogrammetric sub-projects, each one was oriented using an automatic tie-point extractor, known as blob detector, that provides highly distinctive features invariant to image scaling and rotation, and partial invariant to brightness (Lowe, 1999), (Bay et al., 2006). Especially in this specific environment, such operators are very important to preserve the multiplicity of
tie-points, further they allow to achieve a solution for thousand images, in reasonable time.
Each different sub-project was oriented independently using internal camera parameters computed during the calibration task. Two consecutive sub-projects have in common at least 20 images. Such overlap permitted to join the sub-projects among them.
The Figure 6 shows the multiplicity for extracted tie-points in the joint model. Such parameter is very high, both for the great overlap assured by the fisheye lens, and for feature extractor employed during the orientation phase.
Figure 6. An orthographic projection of 3D tie-points, the colour is in according to multiplicity associated. In red the track
of camera moving.
A3D sparse cloud points has been obtained by about 4200 images correctly oriented, indeed, due to imposed overlapping camera stations, the number of unique images was reduced. The bundle result obtained with such camera stations provided about 2.5 millions of tie-points.
3.2 Scaling and georeferencing
The photogrammetric model needs to be georeferred using at least 3 GCPs (Ground Control Point), this step was performed at recording start. Precisely, the acquisition started outward where three GCPs were signalized by targets (Figure 7).
Figure 7. Targets were located on tripods, afterward a GNSS survey was performed.
The GNSS observations, collected in fast-static mode, were processed and adjusted, the 3D final global accuracy is about 2-3 centimeters. Such achieved accuracy is more than enough for the goal of this work, where is required an accuracy of about 10 meters. Further scale constrains were added to the project, indeed, as described in previous section, during the acquisition phase several measurements distance were carried out.
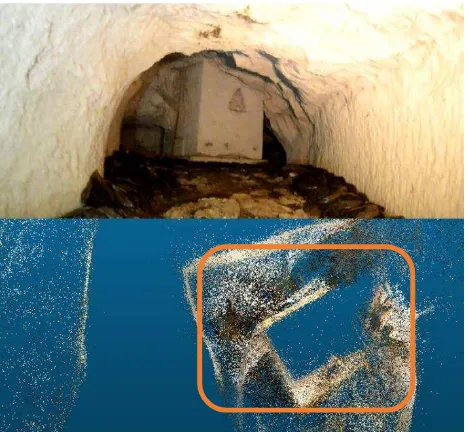
Figure 8. On top figure is shown the structure found, the bottom figure shows the rectangular plant surveyed in the
photogrammetric model.
The 3D model was scaled and georeferenced by three GCPs and two scale constrain. Initially the bundle adjustment was performed in free network mode, afterward, adding GCP measurement it was performed in minimal constrain mode. The total error reported on the GCP is very low: about 1 centimeters. Probably, due to the camera network geometry the scale of photogrammetric 3D model decrease gradually with the increase of distance from GCPs.
In order to limit this scale deformations, the bundle adjustment was carried out again, enhancing the constrains.
The total error in the final three-dimensional is growing up to about 6 meters
3.3 Obtained Results
The final result is a georeferred 3D points cloud of the explored tunnels. Finally, such georeferred sparse point cloud was further processed to obtain an orthoimage map, which was imported in GIS environment to be converted in vector format.
The hypogea site does not provide any reference point to control the solution, and the tunnels network is very complex; anyway on the path are present several structures that probably are wells casing or building foundation. Unfortunately, such structures are not easily recognizable on the surface, because numerous buildings are in the surroundings; furthermore, it is reasonable that old wells are probably closed.
In order to verify the accuracy of the survey, every structure met during the pathway was inspected, afterward it was carried out a deep research to find the equivalent one outward. Just a specific structure characterized by a body of rectangular plant matches on the outer one (Figure 6).
Indeed, projecting the plant on the Google Earth, it was discovered a rectangular structure in surface (Figure 9). Therefore, the structure plant dimensions were measured in
hypogea environment, as well as an inspection on the detected zone was carried out. Afterward, it was surveyed that the construction materials are identical and the collected measurements fit.
The Figure 9 shows the structure found on Google Earth close to that plant projection surveyed in the hypogea environment: such discovery provide a check about the 3D model obtained (just in planimetry). Comparing the positions of the barycentre, it was achieved an accuracy within 7 meters.
4. CONCLUSIONS
In this paper a prompt methodology to survey a complex hypogea environment was described. The complexity was further increased both for the environmental conditions (such as the low brightness, no electric energy, low level of oxygen etc.) and for the morphology of the site. Such difficulties did not allow to use laser-scanner or to plan a classical topographic survey with total station. The equipment was composed by a generic camera HD and a simple measuring tape, further to a GNSS receiver.
Furthermore, initially no one reference point was detected to check the solution or to add a supplementary constrain.
This type of approach allows to obtain a prompt survey in a short time, furthermore the essential equipment is easily reachable and it does not require high profile skill to be manged. On the other hand, skills and time are necessary in post-processing to obtain a reliable solution.
Of course, the attained accuracy is not so high, but it can be compared within the accuracy achievable with a low-cost GNSS receiver, which operates in single point mode, although is unusable in hypogea environments.
Figure 9 – Comparison between the structure plant inspected in underground environment (in red) and the correspondent in
outward.
ACKNOWLEDGEMENTS
Part of this study was supported by individual research contribution of University of Naples Parthenope.
REFERENCES
Bauer, A., Gutjahr, K., Paar, G., Kontrus, H., & Glatzl, R., 2015: Tunnel Surface 3D Reconstruction from Unoriented Image Sequences. arXiv preprint arXiv:1505.06237.
Bay, H., Tuytelaars, T., & Van Gool, L., 2006: Surf: Speeded up robust features. In Computer vision–ECCV 2006 (pp. 404-417). Springer Berlin Heidelberg.
Biber, P., Andreasson, H., Duckett, T., & Schilling, A., 2004: 3D modeling of indoor environments by a mobile robot with a laser scanner and panoramic camera. In Intelligent Robots and Systems, 2004.(IROS 2004). Proceedings. 2004 IEEE/RSJ International Conference on (Vol. 4, pp. 3430-3435). IEEE.
Bonacini, E., D’Agostino, G., Galizia, M., Santagati, C., & Sgarlata, M., 2012: The catacombs of San Giovanni in Syracuse: surveying, digital enhancement and revitalization of an archaeological landmark. In Euro-Mediterranean Conference (pp. 396-403). Springer Berlin Heidelberg.
Brown, D.C., 1971: Close-range camera calibration. PE&RS, Vol. 37(8), pp.855-866.
Chang, P. L., Handa, A., Davison, A. J., & Stoyanov, D., 2014: Robust real-time visual odometry for stereo endoscopy using dense quadrifocal tracking. In International Conference on Information Processing in Computer-Assisted Interventions (pp. 11-20). Springer International Publishing.
Charbonnier, P., Chavant, P., Foucher, P., Muzet, V., Prybyla, D., Perrin, T., Guillemin, S., 2013: Accuracy assessment of a canal-tunnel 3d model by comparing photogrammetry and laserscanning recording techniques. ISPRS-International Archives of the Photogrammetry, Remote Sensing and Spatial Information Sciences, 1(2), 171-176.
Fraser, C. S., 1997: Digital camera self-calibration. ISPRS Journal of Photogrammetry and Remote sensing, 52(4), 149-159.
Cole, D. M., & Newman, P., M. 2006: Using laser range data for 3D SLAM in outdoor environments. In Robotics and Automation, 2006. ICRA 2006. Proceedings 2006 IEEE International Conference on (pp. 1556-1563). IEEE.
Hansen, P., Alismail, H., Rander, P., & Browning, B., 2013: Pipe mapping with monocular fisheye imagery. In 2013 IEEE/RSJ International Conference on Intelligent Robots and Systems (pp. 5180-5185). IEEE.
Hergunsel, Mehmet F., 2011. Benefits of building information modeling for construction managers and BIM based scheduling. Diss. Worcester Polytechnic Institute, 2011.
Kümmerle, R., Steder, B., Dornhege, C., Ruhnke, M., Grisetti, G., Stachniss, C., & Kleiner, A., 2009: On measuring the accuracy of SLAM algorithms. Autonomous Robots, 27(4), 387-407.
Lowe, D. G., 1999: Object recognition from local scale-invariant features. In Computer vision. The proceedings of the seventh IEEE international conference on (Vol. 2, pp. 1150-1157).
Luhmann, T., Robson, S., Kyle, S., & Boehm, J., 2014: Close-range photogrammetry and 3D imaging. Walter de Gruyter.
Luhmann, T., Robson, S., Kyle, S., & Harley, I., 2007: Close range photogrammetry. Wiley.
Mayer, G. E. I., 2007: 3d-geometry and 3d-texture. Documenting early-Christian wall paintings at the Domitilla
Catacomb in Rome. Archäologie und Computer 2007– Workshop.
Mouragnon, E., Lhuillier, M., Dhome, M., Dekeyser, F., & Sayd, P, 2009: Generic and real-time structure from motion using local bundle adjustment. Image and Vision Computing, 27(8), 1178-1193.
Nardi, L., Bodin, B., Zia, M. Z., Mawer, J., Nisbet, A., Kelly, P. H., ... & Topham, N., 2015: Introducing SLAM-Bench, a performance and accuracy benchmarking methodology for SLAM. In 2015 IEEE International Conference on Robotics and Automation (ICRA) (pp. 5783-5790). IEEE.
Nocerino, E., Menna, F., & Remondino, F., 2014: Accuracy of typical photogrammetric networks in cultural heritage 3D modeling projects. The International Archives of Photogrammetry, Remote Sensing and Spatial Information Sciences, 40(5), 465.
Remondino, F., Rizzi, A., Jimenez, B., Agugiaro, G., Baratti, G., & De Amicis, R., 2011: The Etruscans in 3D: From space to underground. Geoinformatics FCE CTU, 6, 283-290.
Thrun, S., 2002: Robotic mapping: A survey. Exploring artificial intelligence in the new millennium, 1, 1-35.
Thrun, S., Burgard, W., & Fox, D., 2000: A real-time algorithm for mobile robot mapping with applications to multi-robot and 3D mapping. In Robotics and Automation, 2000. Proceedings. ICRA'00. IEEE International Conference on (Vol. 1, pp. 321-328). IEEE.