www.elsevier.nlrlocateraqua-online
Breeding new strains of tilapia: development of an
artificial center of origin and linkage map based on
AFLP and microsatellite loci
Jeremy J. Agresti
a,), Shingo Seki
a,b, Avner Cnaani
c,
Supawadee Poompuang
d,e, Eric M. Hallerman
e, Nakdimon Umiel
f,
Gideon Hulata
c, Graham A.E. Gall
a, Bernie May
a,ga
Department of Animal Science, Meyer Hall, UniÕersity of California, DaÕis,
One Shields AÕe, DaÕis, CA 95616, USA
b
Department of Aquaculture, Faculty of Agriculture, Kochi UniÕersity, B-200, Monobe, Nankoku,
Kochi 783, Japan
c
Department of Aquaculture, Volcani Center, Agricultural Research Organization, P.O. Box 6, Bet Dagan 50250, Israel
d
Department of Aquaculture, Faculty of Fisheries, Kasetsart UniÕersity, Chatuchak,
Bangkok 10900, Thailand
e
Department of Fisheries and Wildlife Sciences, Virginia Polytechnic Institute and State UniÕersity,
Blacksburg, VA 24061-0321, USA
f
Department of Ornamental Horticulture, Volcani Center, Agricultural Research Organization, P.O. Box 6, Bet Dagan 50250, Israel
g
Department of Natural Resources, Fernow Hall, Cornell UniÕersity, Ithaca, NY 14853, USA
Accepted 15 October 1999
Abstract
Based on ideas from plant breeding and the opportunities offered by molecular biology, a program was initiated in 1995 to derive genetically superior tilapia from a synthetic stock
Žartificial center of origin, ACO produced by inter-crossing five groups of fish: Oreochromis.
w Ž . Ž . x Ž . Ž .
niloticus wild-type On and red ROn strains , O. aureus Oa , O. mossambicus Om , and
Ž . Ž . Ž .
Sarotherodon galilaeus Sg . Three-way cross families 3WC and four-way cross families 4WC
have been produced, so that all four species are represented in the ACO. A genomic map has been
Ž .
created for each of the parents in an Om= Oa=ROn family using microsatellite and AFLP
)Corresponding author. Tel.:q1-530-752-6351; fax:q1-530-752-0175.
Ž .
E-mail address: [email protected] J.J. Agresti .
0044-8486r00r$ - see front matterq2000 Elsevier Science B.V. All rights reserved.
Ž .
Žamplified fragment length polymorphism DNA markers. The female Om parent had a total of. Ž .
Ž . Ž
78 segregating markers 17 microsatellites, 61 AFLPs . Of these, 62 13 microsatellites, 49
. Ž .
AFLPs were linked in 14 linkage groups covering a total of 514 centimorgans cM . The first
Ž . Ž
generation F1 hybrid male parent had a total of 229 segregating markers 62 microsatellites, 167
. Ž .
AFLPs , of which 214 60 microsatellites, 154 AFLPs were linked in 24 linkage groups covering a total of 1632 cM. The construction of these maps is a key step in a molecular marker-assisted
Ž .
breeding program to detect quantitative trait loci QTL for cold and salinity tolerance and carcass quality in tilapia.q2000 Elsevier Science B.V. All rights reserved.
Keywords: Tilapia; Oreochromis; Genetic map; AFLP; Microsatellite; Cichlidae; Interspecific hybridization
1. Introduction
Ž .
The use of interspecific composite or complex crosses, an established practice in plant breeding, is a means of achieving wide genetic and phenotypic variability. The
Ž .
method is based on the creation of an artificial center of origin ACO via composite interspecific crosses. The ACO contains wide genetic diversity and presents opportuni-ties for genes to recombine and interact with other genes originating from different species; combinations and interactions that are impossible in any of the pure species. An
Ž .
adaptation of this method, termed multiple re-speciation MRS , recently was applied to
Ž .
develop new cultivars of carnations Umiel, 1993 .
We have constructed a tilapia ACO, exploiting the relative ease of making
interspe-Ž .
cific hybrids with these species Wohlforth and Hulata, 1983 . The ACO involved four
Ž Ž . Ž . .
tilapiine species: Oreochromis niloticus wild-type On and red ROn strains , O.
Ž . Ž . Ž .
aureus Oa , O. mossambicus Om , and Sarotherodon galilaeus Sg .
Genetic maps have been constructed for a number of fish species including zebrafish,
Ž .
Danio rerio Postlethwait et al., 1994; Johnson et al., 1996 ; rainbow trout,
On-Ž . Ž
corhynchus mykiss Young et al., 1998 ; and Nile tilapia, O. niloticus Kocher et al., .
1998 . In order to best utilize the unique genetic material produced in the creation of the ACO, we are producing linkage maps from several three-way and four-way crosses
Ž3WC and 4WC, respectively produced as part of the breeding program. These maps.
provide linkage information for markers that are segregating directly in the multi-specific
Ž .
crosses, they further develop the existing map of the On genome Kocher et al., 1998 ,
Ž .
and they establish a framework for the detection of quantitative trait loci QTL for traits of importance to the culture of tilapia. These maps will also be used to evaluate the genetic composition of the strains derived from the ACO. Here we report on the results of the breeding program that created the ACO and linkage maps from a 3WC family containing genetic material of Oa, Om, and ROn.
2. Materials and methods
2.1. Breeding program
Four different species of tilapia were used for producing the composite population
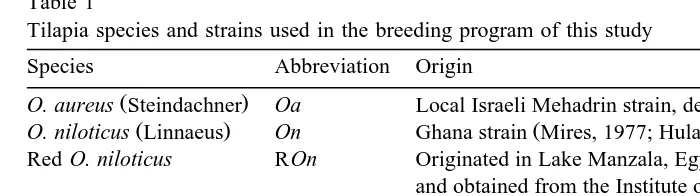
Table 1
Tilapia species and strains used in the breeding program of this study
Species Abbreviation Origin
Ž . Ž .
O. aureus Steindachner Oa Local Israeli Mehadrin strain, described by Hulata et al. 1993
Ž . Ž .
O. niloticus Linnaeus On Ghana strain Mires, 1977; Hulata, 1988
Ž .
Red O. niloticus ROn Originated in Lake Manzala, Egypt McAndrew et al., 1988 , and obtained from the Institute of Aquaculture, University of Stirling, Scotland
Ž . Ž .
O. mossambicus Peters Om Natal, South Africa Hulata, 1988
Ž . Ž
S. galilaeus Linnaeus Sg Endemic species originating in Lake Tiberias Kinnereth, Sea of
. Ž .
Galilee Ben-Tuvia, 1959; Goren, 1974
Agricultural Research Organization, Bet Dagan, Israel, except where otherwise stated. Parental fish were individually tagged using colored and numbered plastic discs, attached to the fish on nylon threads pushed through the dorsal muscle and knotted.
Ž
Parents of all crosses retained for further study were PIT tagged Destron-Fearing, St.
.
Paul, MN, USA and placed in holding tanks. Starting with the parental species,
Ž . Ž . Ž .
two-way crosses 2WC were made to produce first F1 and second F2 generation populations. Some of the 2WCs were crossed to a third species to produce a series of 3WC, or intercrossed to create 4WC.
Reproduction procedures were similar to those described in Rosenstein and Hulata
Ž1994 , except that eggs removed from the buccal cavities of females were transferred to.
hatching jars to complete incubation. The S. galilaeus=Oreochromis sp. F hybrids1 Ž
were produced by artificial fertilization Don and Avtalion, 1986; Yeheskel and
Avtal-.
ion, 1988 at the Laboratory of Fish Immunology and Genetics, Bar-Ilan University, Ramat Gan, Israel. To produce the artificially fertilized groups, a batch of eggs of a single S. galilaeus female was divided into four sub-samples, each fertilized with sperm collected from males of the four Oreochromis stocks. Samples of the F progeny were1
transferred to Bet Dagan for use in the breeding program. 3WCs and 4WCs were obtained from these F fish by natural spawning.1
2.2. Linkage mapping
2.2.1. Tissue
Sixty-three 3WC progeny of a single mating between an Om female and an F1
ŽOa=ROn male were chosen for evaluating joint segregation of microsatellite and.
Ž . Ž 2.
amplified fragment length polymorphism AFLP markers. Fin tissue 1–4 cm was collected from adult fish of each parental species, including all parents of the progeny group contributing to the ACO, and stored in 95% ethanol. The tissue of progeny was
Ž .
obtained from newly hatched fry 10–14 days old and placed in 95% ethanol for storage. DNA from a 0.7-cm2 piece of fin or an entire fry was extracted using the
Ž .
CTAB phenolrchloroform protocol of Saghia-Maroof et al. 1984 and Doyle and Doyle
2.2.2. Microsatellites
Ž .
Fluorescently labeled microsatellite primer pairs ns133 developed from an On
Ž .
genomic library Lee and Kocher, 1996 were purchased from Research Genetics
ŽHuntsville, AL, USA . These were screened for the ability to amplify alleles and.
demonstrate polymorphism in the mapping family and in individuals from each of the five ‘‘pure’’ species used in the breeding program. PCRs were performed in 10 ml
Ž .
volumes in a PTC-100-96V Thermocycler MJR; Watertown, MA, USA . The reaction
Ž
conditions were as follows: Gibco 1= PCR buffer 20 mM Tris–HCl pH 8.0, 50 mM
.
KCl , 2.4 mM MgCl , 1602 mM each dNTP, 0.2 U Taq polymerase, 0.16 mM each primer, and 10 ng of template DNA. An initial screen of the primers for amplification and polymorphism was done at 28 cycles of 948C for 1 min, 508C for 2 min, and 728C for 1 min. The annealing temperature was adjusted for each locus as necessary to produce scorable amplification product.
2.2.3. AFLP protocol
Ž .
The use of AFLP markers was based on a modification of Vos et al. 1995 . As described below, visualization of bands in gels and data collection utilized a fluorescent scanning system.
Ž .
2.2.3.1. Digestion–ligation. Genomic DNA 200 ng was restricted for 1 h at 378C in a
Ž
200-ml tube containing 2 U each of EcoRI and MseI New England Biolabs; Beverly,
. Ž
MA, USA and 1=NEBuffer 2 10 mM Tris–HCl, 10 mM MgCl , 50 mM NaCl, 12
.
mM DTT, 100mgrml BSA, pH 7.9 in a total volume of 16ml. After digestion, 4ml of
Ž
a ligation mixture 20 pmol of MseI adapter, 2 pmol of EcoRI adapter, 1 mM ATP, 4 U
Ž . .
T4 DNA ligase New England Biolabs , 100 mgrml BSA, and 1=NEBuffer 2 was added. The reaction mixture was incubated at 258C for 12–16 h, and then diluted
Ž .
10-fold with 180ml of TLE 10 mM Tris–HCl pH 8.0, 0.1 mM EDTA .
2.2.3.2. Pre-amplification. A pre-amplification step was used to reduce the number of
possible bands to amplify, and to create a virtually unlimited supply of digestion–liga-tion template. Primers complementary to each adapter sequence with a one-base extension were used to amplify 1r16 of the total restriction fragments created in the digestion–ligation above. The template, 5ml of diluted digestion–ligation product, was amplified using 30 ng each of EcoqG and MseqC primers in a 20-ml reaction
Ž .
containing Gibco 1= PCR buffer 20 mM Tris–HCl pH 8.0, 50 mM KCl , 1.5 mM MgCl , 2002 mM of each dNTP, and 0.4 U of Taq polymerase. The template was amplified for 24 cycles of: 948for 30 s, 568C for 1 min, and 728C for 1 min. The PCR product was diluted 10-fold with 180ml of TLE, and stored at 48C.
and Mse primer, respectively. Reactions were amplified with 30 s denaturing at 948C, followed by 30 s annealing at 658C and 1 min extension at 728C. This cycle was repeated 11 more times reducing the annealing temperature 0.78C each cycle. The cycle was repeated a final 24 times with the annealing temperature held at a constant 568C.
2.2.4. Electrophoresis
Ž
After amplification, an equal volume of loading buffer 98% formamide, 10 mM
.
EDTA was added to the amplification products of both the microsatellite reactions and the AFLP reactions. The reactions were denatured at 958C for 2 min, then snap-cooled
Ž
on ice for at least 5 min prior to loading on a 5% polyacrylamide 19:1
acrylamide:bi-. Ž .
sacrylamide , 7.5 M urea denaturing gel 20 cm=32 cm=0.4 mm . Microsatellite
Ž .
products 48 samples; 2.5ml each were loaded on the gel and run at 35 W for 25 min. Then another 48 reactions from the same locus were loaded and the gel was run for 30
Ž .
more minutes. AFLP products 48 samples were loaded and the gels were run at 35W
Ž508C between 1 and 1.5 h, depending on the fragment sizes for a particular primer.
combination.
2.2.5. Scoring and analysis
Ž .
Each band on the AFLP gel was scored as band presence qrq,qry as one
Ž .
allele, or absence yry as the alternate allele. Although it has been reported possible
Ž .
in other studies van Eck et al., 1995; Vos et al., 1995 , we did not feel confident
Ž .
enough distinguishing differences in band intensities between homozygotes qrq and
Ž .
heterozygotes qry to score the AFLP bands as codominant markers. For all loci scored, the approach used was to score only loci for which one parent was scored as band-present and the other parent was scored as band-absent. All loci scored were checked for segregation distortion using a x2 for goodness of fit to a 1:1 genotype ratio Žp-0.05 . Twenty-five loci that showed a significant deviation were not included in.
further analyses.
Ž
Bands were sized using ‘‘FragmenNT Analysis’’ Molecular Dynamics; Sunnyvale,
.
CA, USA and genotypes were scored by the presence or absence of bands by eye.
Ž .
Linkage was analyzed using Mapmaker 3.0 Lander et al., 1987 . The LOD criterion for determining linkage was taken as 3.0 and the map units used were Kosambi centimor-gans.
The linkage phase for some of the loci from parental fish used to make the cross was not known. Therefore, data were entered into Mapmaker first as the bands appeared on
Ž .
the gel band presentsH, band absentsA , and as the reciprocal data set by changing A’s to H’s and H’s to A’s. This process created two identical but reciprocal sets of linkage groups, so only one set was used for further study.
Ž
Data also were organized using ‘‘Map Manager XP’’ Cudmore and Manly,
.
http:rrmcbio.med.buffalo.edurmapmgr.html , which provides graphic display of the genotypes of linked loci, and therefore enables visual inspection of recombination events. When double crossovers were observed in a small area, an indicator of possible
Ž .
genotyping errors Lincoln and Lander, 1992 , gels were reexamined and corrections were made in the data set if necessary. Linkage groups were drawn using the
‘‘Draw-Ž .
3. Results
3.1. Breeding program
Ž .
The following 2WCs female listed first were produced: On=Oa, Oa=ROn Ž1995 , Om. =Oa, Sg=Oa, Sg=Om, Sg=ROn, Sg=On 1996 , Om=Ž . ROn, On=
Ž . Ž .
Om 1997 and Oa=On 1998 . We failed to produce any hybrids with ROn as a
Ž .
female, apparently due to behavioral incompatibility Hulata et al., 1995 .
In 1997, F2 groups produced from Oa=ROn hybrid progeny and the following
w Ž .x w Ž .x w Ž .x
3WCs were produced: Om= Oa=ROn , Om= On=Oa , On= Om=Oa , w Ž .x
and Om= Sg=On . Thus, all 3WCs required for mapping the five strains of the four
participating species were produced and stored in 95% ethanol for further analysis
ŽTable 2 . Some of the 3WC were difficult to produce: three spawns of Om. w =ŽSg=Oa.x
w Ž .x
produced progeny, but none were viable; seven spawns of On= Om=Oa were
w Ž
attempted, but only a few eggs hatched in only one spawn; 28 spawns of Om= On= .x
Oa were obtained from two parental breeding groups, but none was viable; another breeding group produced six spawns with three producing viable offspring, two had high mortality, and one was not viable.
wŽ
Most possible 4WC combinations were attempted with the following results: Om=
. Ž .x wŽ . Ž .x
Oa = Sg=On , its reciprocal, and Sg=Om = On=Oa produced viable
off-wŽ . Ž .x
spring. The 4WC Sg=ROn = Om=Oa was difficult to produce: we had one
wŽ . Ž
successful spawn with only 20 surviving fish. Several spawns of Oa=ROn = Sg= .x
Om were not viable, and other attempted combinations for producing 4WC did not spawn at all.
3.2. Linkage maps
A linkage map was created for each of the parents in the mapping family. There were totals of 63 microsatellites and 229 AFLPs segregating in one or the other parent. The
Table 2
Ž
Summary of all 3WCs obtained, fixed in ethanol as fry and shipped to UCDavis for mapping purposes each
.
pool represents a different F male and one to three females . See Table 1 for abbreviations1 Genetic combination Total number of fry Number of spawns pooled
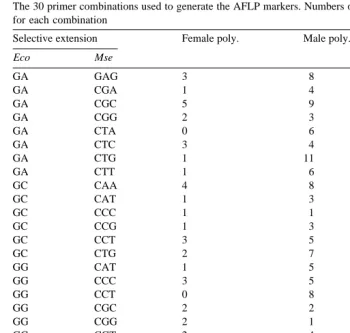
Table 3
The 30 primer combinations used to generate the AFLP markers. Numbers of polymorphic markers are shown for each combination
Selective extension Female poly. Male poly. Total
Eco Mse
AFLP primer combinations used and the numbers of polymorphic loci amplified for
Ž .
each combination are listed in Table 3. The female Om parent had a total of 78
Ž . Ž
markers segregating 17 microsatellites, 61 AFLPs . Of these, 62 13 microsatellites, 49
. Ž .
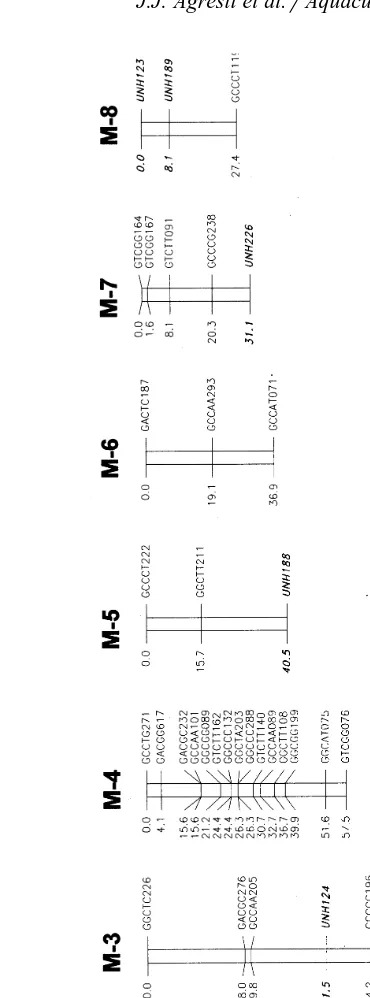
AFLPs were resolved into 14 linkage groups covering a total of 514 cM Fig. 1A . The
Ž .
male had many more segregating markers because it was an F hybrid Oa1 =ROn . The
Ž .
male parent had a total of 229 markers segregating 62 microsatellites, 167 AFLPs . Of
Ž .
these, 214 60 microsatellites, 154 AFLPs were resolved into 24 linkage groups
Ž .
covering a total of 1632 cM Fig. 1B .
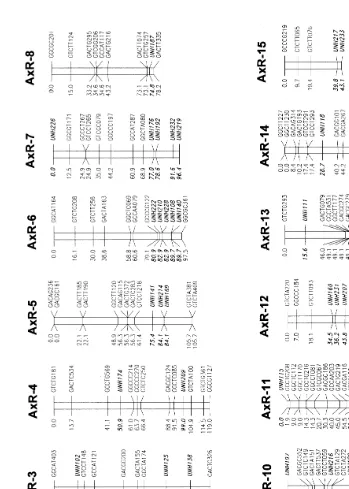
3.3. Alignment of tilapia maps
Ž . Ž . Ž .
Fig. 1. A and B A linkage map of the male tilapia ROn=Oa and the female Om , respectively.
Microsatellites are identified by ‘‘UNH’’ and a three-digit identification number, and are emphasized in bold text. AFLPs are identified by GU
CUU
NNN, where ‘‘GU
’’ refers to the Eco-selective nucleotides, and the ‘‘CUU
Ž .
Fig. 1 continued .
Ž .
has been published by Kocher et al. 1998 based on haploid gynogens from a single On
Ž .
Table 4
Ž .
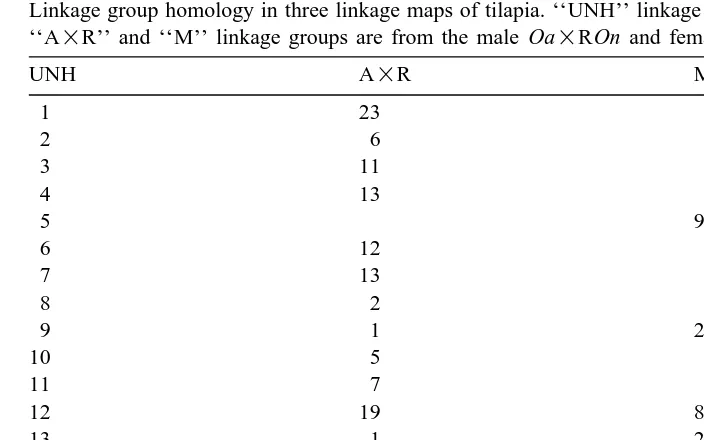
Linkage group homology in three linkage maps of tilapia. ‘‘UNH’’ linkage groups from Kocher et al. 1998 . ‘‘A=R’’ and ‘‘M’’ linkage groups are from the male Oa=ROn and female Om in this study, respectively
UNH A=R M
1 23
2 6
3 11
4 13
5 9
6 12
7 13
8 2
9 1 2
10 5
11 7
12 19 8
13 1 2, 5
15 22 1
16 3
19 24
20 4 1
21 9
23 10
30 20
Ž .
markers in common, which can be used as ‘‘allelic bridges’’ Gebhardt et al., 1991 to join and align them. Linkage groups found to have syntenic regions based on at least one
Fig. 2. Comparisons of linkage groups for tilapia showing synteny for three or more microsatellites. Linkage
Ž .
groups from different maps are identified as follows: ‘‘A=R’’ — male Oa=ROn this study , ‘‘M’’ —
Ž . Ž .
shared microsatellite locus are listed in Table 4. The group A=R-13 combined the groups UNH-4 and UNH-7. The group A=R-1 combined UNH-9 and UNH-13. Group M-1 combined A=R-4, A=R-22, UNH-15, and UNH-20. Alignment of linkage
Ž
groups with three or more microsatellites in common resulted in four aligned sets Fig.
.
2 .
3.4. Species comparisons
There is evidence of at least one chromosomal inversion event among the UNH
Ž .
linkage group 9 and both of the maps obtained by this study A=R-1, M-2 . The region between the loci UNH-166 and UNH-178 is inverted in linkage group UNH-9 with respect to the A=R-1 and M-2 in this study.
The 63 microsatellite loci that were determined to be polymorphic in the mapping family were also tested for amplification in the five parental species used in the breeding program, by testing five individuals of each parental species. In every case, a PCR product was visible on the gel. PCR conditions needed to be optimized for several loci, but interspecific and even inter-generic amplification was demonstrated for these 63 loci.
4. Discussion
4.1. Alignment of tilapia maps
Although we were not yet able to combine all three maps into one, our efforts did
Ž .
further enhance the work presented by Kocher et al. 1998 by combining some previously reported linkage groups. We were unable to combine all three maps for several reasons. Many linkage groups only had one shared microsatellite, so it was impossible to assess the orientation of the markers within the group. The UNH map and the Om map from this study were from a female parent, while the Oa=ROn map was from a male. It is possible that males and females have different recombination rates that would lead to different linkage distances between markers. In general, distances between similar markers tend to be smaller in the female map than the male map, but from one family it is premature to make any generalizations about relative recombination rates in males and females. The three maps include four different species and, while they have all been shown to have the same chromosome number, the number of arms may be
Ž .
different Majumdar and McAndrew, 1986 . This is due to chromosomal rearrange-ments, such as Robertsonian translocations or fusions, which could cause different loci
Ž .
to be linked in the different maps. Majumdar and McAndrew 1986 did not see any evidence of these rearrangements in the chromosomal banding patterns of seven tilapiine species, but they did not study chromosomal pairing in hybrids.
4.2. Species comparisons
Ž .
Majumdar and McAndrew 1986 suggested that there might be pericentric inversions between tilapiine species that account for differences in centromere placement. The inversion shown in Fig. 2 could be evidence of such an inversion. As further evidence of
Ž .
UNH-147 and UNH-178 would show absolute linkage because there would be no recombination in this area.
It has been proven difficult in the past to distinguish some species of tilapia based on
Ž .
morphology Trewavas, 1983; Macaranas et al., 1986 . This breeding study exacerbates the identification problem because interspecific hybrids are particularly ambiguous to identify based on morphology. Some of the markers used to create the map are diagnostic for distinguishing the strains used in this cross. These markers can be used to track the parentage of crosses and will be useful in tracking the species origin of alleles determined to be linked to QTL.
It should be noted that when scoring AFLP markers, we are scoring alleles and not necessarily loci. There are many cases where two adjacent polymorphisms from the same primer combination show absolute linkage on the map. It is likely that these are actually alleles at the same locus, but without sequence characterization of the bands it is impossible to reach definitive conclusions. It is less likely that two alleles at a locus would have mutations that would cause them to be amplified by different primer
Ž .
combinations. Roupe van der Voort et al. 1997 found that the absolutely linked loci are often alternate alleles at a single locus. The map presented here is not unusual in showing some clustering of AFLP markers, and the scoring of alleles as independent
Ž .
loci is a likely explanation of this observation. Roupe van der Voort et al. 1997 also showed that same-sized AFLP bands amplified from the same primer combination in
Ž .
different crosses were usually 95% alleles at the same locus. This information will allow maps of further crosses of tilapias to be aligned based on shared AFLP markers as well as microsatellite markers.
This study will continue by constructing genetic maps of crosses of other species used in the creation of the ACO. These crosses will contain new polymorphic loci that will continue to add to an increasingly dense consensus map of tilapia. Our maps will be aligned with each other through the use of the same species being involved in production of different F hybrid parents. Further work should also include the addition1
of highly conserved type I markers to the map so that the genome of tilapia can be compared to other organisms based on homologous markers. The high polymorphism of the hybrids produced in this study should overcome the concerns of low polymorphism
Ž
at these types of loci. Genetic mapping of centromeres will be completed soon Tom
.
Kocher, University of New Hampshire, personal communication , and linkage groups will then be associated with specific chromosomes.
The maps produced for the ACO families currently are being used for determining the location of QTL for cold tolerance and salinity tolerance. Markers linked to QTL
Ž .
detected could be used in a marker-assisted selection MAS program to increase the growing range and productivity of tilapia aquaculture. Phenotypic challenges are cur-rently underway, and the first practical application of the mapping of the tilapia genome will soon be tested.
Acknowledgements
References
Ben-Tuvia, A., 1959. The biology of the cichlid fishes of Lake Tiberias and Huleh. Bull. Res. Counc. Isr. 8B
Ž .4 , 153–188.
Don, J., Avtalion, R.R., 1986. The induction of triploidy in Oreochromis aureus by heat shock. Theor. Appl. Genet. 72, 186–192.
Doyle, J.J., Doyle, J.L., 1987. A rapid DNA isolation procedure for small quantities of fresh leaf tipsier. Phytol. Bull. 19, 11–15.
Gebhardt, C., Ritter, E., Barone, A., Debener, T., Walkemeier, B., Schachtschabel, U., Kaufmann, H., Thompson, R.D., Bonierbale, M.W., 1991. RFLP maps of potato and their alignment with the homologous tomato genome. Theor. Appl. Genet. 83, 49–57.
Goren, M., 1974. The freshwater fishes of Israel. Isr. J. Zool. 23, 67–118.
Grewe, P.M., Krueger, C.C., Aquadro, C.F., Bermingham, E., Kincaid, H.L., May, B., 1993. Mitochondrial
Ž .
DNA variation among lake trout SalÕelinus namaycush strains stocked into Lake Ontario. Can. J. Fish.
Aquat. Sci. 50, 2397–2403.
Ž .
Hulata, G., 1988. Israel. In: Pullin, R.S.V. Ed. , Tilapia Genetic Resources for Aquaculture. ICLARM Conf. Proc. 16, Manila, Philippines. pp. 48–51.
Hulata, G., Karplus, I., Harpaz, S., 1995. Evaluation of some red tilapia strains for aquaculture: growth and colour segregation in hybrid progeny. Aquacult. Res. 26, 765–771.
Hulata, G., Wohlforth, G.W., Karplus, I., Schroeder, G.L., Harpaz, S., Halevy, A., Rothbard, S., Cohen, S., Israel, I., Kavessa, M., 1993. Evaluation of Oreochromis niloticus=O. aureus hybrid progeny of different
geographical isolates, reared under varying management regimes. Aquaculture 115, 253–271.
Johnson, S.L., Gates, M.A., Johnson, M., Talbot, W.S., Horne, S., Baik, K., Rude, S., Wong, J.R., Postlethwait, J.H., 1996. Centromere-linkage analysis and consolidation of the zebrafish genetic map. Genetics 142, 1277–1288.
Kocher, T.D., Lee, W.-J., Sobolewska, H., Penman, D., McAndrew, B., 1998. A genetic linkage map of the
Ž .
Cichlid fish, the tilapia Oreochromis niloticus . Genetics 148, 1225–1232.
Lander, E.S., Green, P., Abrahamson, J., Barlow, A., Daly, M.J., Lincoln, S.E., Newburg, L., 1987. MAPMAKER, an interactive computer package for constructing primary genetic linkage maps of experimental and natural populations. Genomics 1, 174–180.
Lee, W.-J., Kocher, T.D., 1996. Microsatellite DNA markers for genetic mapping in Oreochromis niloticus. J. Fish Biol. 49, 169–171.
Lincoln, S.E., Lander, E.S., 1992. Systematic detection of errors in genetic linkage data. Genomics 14, 604–610.
Macaranas, J.M., Taniguchi, N., Pante, M.J.R., Capilia, B., Pullin, R.S.V., 1986. Electrophoretic evidence for extensive hybrid gene introgression into commercial Oreochromis niloticus L. stocks in the Philippines. Aquacult. Fish. Manage. 17, 249–258.
Majumdar, K.C., McAndrew, B.J., 1986. Relative DNA content of somatic nuclei and chromosomal studies in
Ž .
three genera, Tilapia, Sarotherodon, and Oreochromis of the tribe Tilapiini Pisces, Cichlidae . Genetica 68, 175–188.
McAndrew, B.J., Roubal, F.R., Roberts, R.J., Bullock, A.M., McEwen, I.M., 1988. The genetics and histology of red, blond and associated colour variants in Oreochromis niloticus. Genetica 76, 127–137.
Mires, D., 1977. Theoretical and practical aspects of the production of all-male tilapia hybrids. Bamidgeh 29, 94–101.
Postlethwait, J.H., Johnson, S.L., Midson, C.N., Talbot, W.S., Gates, M., Ballinger, E.W., Africa, D., Andrews, R., Carl, T., Eisen, J.S., Horne, S., Kimmel, C.B., Hutchinson, M., Johnson, M., Rodriguez, A., 1994. A genetic linkage map for the zebrafish. Science 264, 699–703.
Rosenstein, S., Hulata, G., 1994. Sex reversal in the genus Oreochromis. Optimization of feminization protocol. Aquacult. Fish Manage. 25, 329–339.
polymorphisms in barley, Mendelian inheritance, chromosomal location, and population dynamics. Proc. Natl. Acad. Sci. U. S. A. 81, 8014–8018.
Trewavas, E., 1983. Tilapiine Fishes of the Genera Sarotherodon, Oreochromis and Danakilia. British Museum of Natural History, London, UK.
Ž .
Umiel, N., 1993. Generating genetic variation by the creation of artificial center s of origin and its use via multiple respeciation for the breeding of carnations. In: Proc. XVII Eucarpia Symp. ‘‘Creating Genetic Variation in Ornamentals’’. pp. 37–45.
van Eck, H.J., Roupe van derVoort, J.N.A.M., Draaistra, J., van Zandvoort, P., van Enchevort, E., Segers, B., Peleman, J., Jacobsen, E., Helder, J., Bakker, J., 1995. The inheritance and chromosomal localization of AFLP markers in a non-inbred potato offspring. Mol. Breed. 1, 397–410.
Van Ooijen, J.W., 1994. DrawMap, a computer program for drawing genetic linkage maps. J. Hered. 85, 66. Vos, P., Hodgers, R., Bleeker, M., Reijans, M., van de Lee, T., Hornes, M., Frijters, A., Pot, J., Peleman, J., Kuiper, M., Zabeau, M., 1995. AFLP, a new technique for DNA fingerprinting. Nucleic Acids Res. 23, 4407–4414.
Wohlforth, G.W., Hulata, G., 1983. In: Applied Genetics of Tilapia. 2nd edn. ICLARM Studies and Reviews 6, 26 pp.
Yeheskel, O., Avtalion, R.R., 1988. Artificial fertilization of tilapia eggs: a preliminary study. In: Zohar, Y.,
Ž .
Breton, B. Eds. , Reproduction in Fish, Basic and Applied Aspects in Endocrinology and Genetics. French–Israeli Symposium, Tel-Aviv, Israel. Colloq. — Inst. Natl. Rech. Agron. 44, 169–176, INRA, Paris, France.