Oracle Business
Intelligence with
Machine Learning
Artificial Intelligence Techniques in
OBIEE for Actionable BI
Rosendo Abellera Lakshman Bulusu Aetna St. Tarzana, California Priceton, New Jersey
USA USA
ISBN-13 (pbk): 978-1-4842-3254-5 ISBN-13 (electronic): 978-1-4842-3255-2 https://doi.org/10.1007/978-1-4842-3255-2
Library of Congress Control Number: 2017963641
Copyright © 2018 by Rosendo Abellera and Lakshman Bulusu
This work is subject to copyright. All rights are reserved by the Publisher, whether the whole or part of the material is concerned, specifically the rights of translation, reprinting, reuse of illustrations, recitation, broadcasting, reproduction on microfilms or in any other physical way, and transmission or information storage and retrieval, electronic adaptation, computer software, or by similar or dissimilar methodology now known or hereafter developed. Trademarked names, logos, and images may appear in this book. Rather than use a trademark symbol with every occurrence of a trademarked name, logo, or image, we use the names, logos, and images only in an editorial fashion and to the benefit of the trademark owner, with no intention of infringement of the trademark.
The use in this publication of trade names, trademarks, service marks, and similar terms, even if they are not identified as such, is not to be taken as an expression of opinion as to whether or not they are subject to proprietary rights.
While the advice and information in this book are believed to be true and accurate at the date of publication, neither the authors nor the editors nor the publisher can accept any legal responsibility for any errors or omissions that may be made. The publisher makes no warranty, express or implied, with respect to the material contained herein.
Cover image by Freepik (www.freepik.com)
Distributed to the book trade worldwide by Springer Science+Business Media New York, 233 Spring Street, 6th Floor, New York, NY 10013. Phone 1-800-SPRINGER, fax (201) 348-4505, e-mail [email protected], or visit www.springeronline.com. Apress Media, LLC is a California LLC and the sole member (owner) is Springer Science + Business Media Finance Inc (SSBM Finance Inc). SSBM Finance Inc is a Delaware corporation.
For information on translations, please e-mail [email protected], or visit www.apress.com/rights-permissions.
Apress titles may be purchased in bulk for academic, corporate, or promotional use. eBook versions and licenses are also available for most titles. For more information, reference our Print and eBook Bulk Sales web page at www.apress.com/bulk-sales.
Contents
About the Authors ... vii
About the Technical Reviewer ... ix
Acknowledgments ... xi
Introduction ... xiii
■
Chapter 1: Introduction ... 1
Artificial Intelligence and Machine Learning ... 2
Overview of Machine Learning ... 4
Patterns, Patterns, Patterns ... 5
Machine-Learning Vendors ... 7
Build or Buy? ... 7
Introduction to Machine-Learning Components in OBIEE ... 8
Oracle BI and Big Data ... 8
R for Oracle BI... 9
Summary ... 9
Citations ... 10
■
Chapter 2: Business Intelligence, Big Data, and the Cloud ... 11
The Goal of Business Intelligence ... 11
Big-Data Analytics ... 12
A Picture Is Worth a Thousand Words ... 14
Data Modeling ... 17
The Future of Data Preparation with Machine Learning ... 18
Oracle Business Intelligence Cloud Service ... 19
Oracle Analytics Cloud ... 19
Oracle Database 18c ... 19
Oracle Mobile Analytics ... 20
Summary ... 20
■
Chapter 3: The Oracle R Technologies and R Enterprise ... 23
R Technologies for the Enterprise... 23
Open Source R ... 23
Oracle’s R Technologies ... 25
Using ORE for Machine Learning and Business Intelligence
with OBIEE: Start-to-Finish Pragmatics ... 38
Using the ORD randomForest Algorithm to Predict Wine Origin ... 38
Using Embedded R Execution in Oracle DB and the ORE R Interface
to Predict Wine Origin ... 41
Using ore.randomForest Instead of R’s randomForest Model ... 52
Using Embedded R Execution in Oracle DB with the ORE SQL
Interface to Predict Wine Origin ... 57
Generating PNG Graph Using the ORE SQL Interface and Integrating
It with OBIEE Dashboard ... 66
Integrating the PNG Graph with OBIEE ... 70
Creating the OBIEE Analysis and Dashboard with the Uploaded RPD ... 87
Machine Learning Trending a Match for EDW ... 89
■
Chapter 4: Machine Learning with OBIEE ... 99
The Marriage of Artificial Intelligence and Business Intelligence ... 99
Evolution of OBIEE to Its Current Version ... 101
The Birth and History of Machine Learning for OBIEE ... 103
OBIEE on the Oracle Cloud as an Optimal Platform ... 105
Machine Learning in OBIEE ... 105
Summary ... 106
■
Chapter 5: Use Case: Machine Learning in OBIEE 12c ... 107
Real-World Use Cases ... 107
Predicting Wine Origin: Using a Machine-Learning Classification Model ... 108
Using Classified Wine Origin as a Base for Predictive
Analytics - Extending BI using machine Learning techniques in OBIEE ... 108
Using the BI Dashboard for Actionable Decision-Making ... 108
Technical and Functional Analysis of the Use Cases ... 109
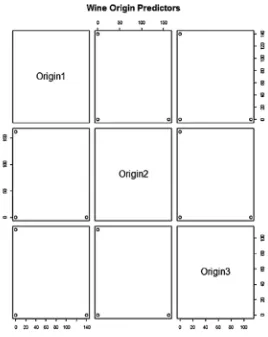
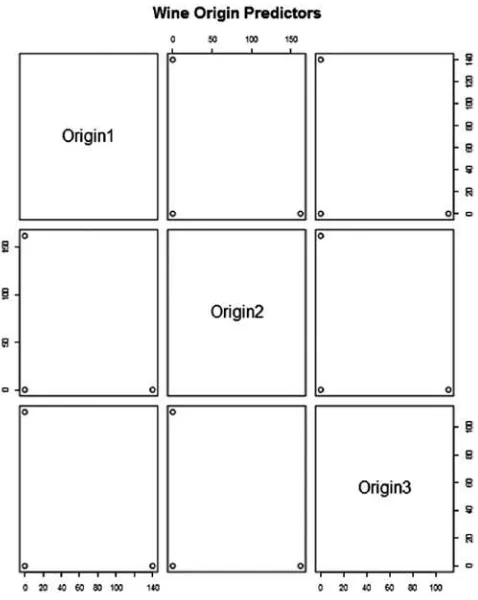
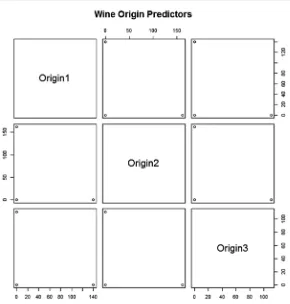
Analysis of Graph Output: Pairs Plot of Wine Origin Prediction
Using Random Forest ... 111
Analysis of Graph Output: Predicting Propensity to Buy Based on
Wine Source ... 111
Analysis at a More Detailed Level ... 112
Use Case(s) of Predicting Propensity to Buy ... 121
Summary ... 133
■
Chapter 6: Implementing Machine Learning in OBIEE 12c ... 135
Business Use Case Problem Description and Solution ... 135
Technically Speaking ... 136
First Part of Solution ... 136
Summary of Logit Model ... 168
AUC Curve ... 173
Implementing the Solution Using the ORE SQL Interface ... 174
Integrating PNG Output with the OBIEE Dashboard ... 187
Summary ... 193
About the Authors
With a proven track record of successful implementations continuously through several decades, Rosendo Abellera ranks among the nation’s top practitioners of data warehousing (DW), business intelligence (BI), and analytics. As a SME and expert practitioner, he has architected DW/BI and big-data analytic solutions and worked as a consultant for a multitude of leading organizations including AAA, Accenture, Comcast, ESPN, Harvard University, John Hancock Financial, Koch Industries, Lexis-Nexis, Mercury Systems, Pfizer, Staples, State Street Bank, and the US Department of the Interior (DOI). Moreover, he has held key management positions to establish the DW and BI practices of several prominent and leading consulting firms.
Rosendo founded BIS3, an Oracle Partner firm specializing in business intelligence, as well as establishing a data science company and big-data analytics platform called Qteria. Additionally, Rosendo is certified by Oracle in Data Warehousing, OBIEE, and WebLogic and keeps up with the latest advancements to provide both strategic and tactical knowledge toward successful implementation and solutions delivery. He has authored several books and is a frequent speaker at business intelligence and data events.
Lakshman Bulusu is a Senior Oracle Consultant with 23 years of experience in the fields of Oracle RDBMS, SQL, PL/SQL, EDW/BI/EPM, Oracle-related Java, and Oracle-related R. As an enterprise-level data warehouse and business intelligence solution architect/technical manager in the ORACLE RDBMS space, he focused on a best-fit solution architecture and implementation of the Oracle Industry Data Model for telecom. He has worked for major clients in the pharma/healthcare, telecom, financial (banking), retail, and media industry verticals, with special emphasis on cross-platform heterogeneous information architecture and design.
About the Technical
Reviewer
Shibaji Mukherjee is a senior technology professional with more than 20 years of technology development, strategy, and research experience. He has worked on designing and delivering large-scale enterprise solutions, data integration products, data drivers, search engines, large repository Indexing solutions, large complex databases, data analytics, and predictive modelling. He has worked in early-stage start-ups, big product MNCs, services, and consulting firms as product manager, architect, and group head. The major companies he has worked for include I-Kinetics, SeeBeyond, SUN Microsystems, Accenture, Thomson Reuters, and Oracle.
He has research experience in bioinformatics, machine learning, statistical modeling, and NLP and has worked on applications of machine-learning techniques to several areas. He also has extensive research experience in theoretical physics and has been a speaker at conferences and workshops.
Shibaji is a senior industry professional with over 20 years of industry and academic experience in areas of distributed computing, enterprise solutions, machine learning, information retrieval, and scientific modelling.
Acknowledgments
I acknowledge and dedicate this book to my mother, Violeta Mendoza Abellera, who embodies sheer determination and perseverance and showed me that it is never too late to reach your goal. You have been a shining example for all your kids and grandkids to never give up hope.
Special thanks to Eric Perry for developing the Qteria POC with machine learning and real-time streaming analytics. Also, to Chien-Ming Tu and Miguel Gamis for contributing research.
—Rosendo Abellera
Thanks to all the readers of my previous books for their invaluable comments and feedback that have enabled me to overcome challenges as I ventured into the trending landscape of AI meets BI.
Introduction
It’s an exciting new era for business intelligence as we usher in artificial intelligence and machine learning. Imagine. What if this new technology can actually help us to augment our thinking and provide capabilities that are normally not humanly possible. Should we take a chance and bank on this new technology? Can it really help give us a competitive advantage with our data? Can it make the right recommendations? Are we ready for this?
For several decades now, we have been developing and implementing data-centric solutions. I’d like to say that “we’ve seen it all,” but the industry never ceases to amaze me as new advances are made and exciting new technologies break new ground—such as with artificial intelligence and machine learning. This one promises to be a game changer, and I can’t wait to get my hands on it. But wait! How do I successfully incorporate this into my busy schedule? How do I implement is successfully? We have the same old excuses.
With each new advancement in technology, we always seem to go through a ritual before adopting it. First, there is the doubt and denial. We ask, “Could this be real?” or “Is this the Holy Grail that we’ve been waiting for?” This prompts endless discussions and debates. Lines are drawn, and divisions are made, where people are pitted against each other. Sometimes, a brave soul steps out and goes through the motions of trial and error, where experience (through some success) softens the pangs of doubt and disapproval. When the dust settles, confident players finally arrive at attempting to incorporate the new technology into their plans. These rituals are a far cry from the days when every technologist and developer would jump to become the beta tester for new software.
So that’s what it has become—no matter whether the new technology seems fascinating. “Once bitten, twice shy,” they say, as we struggle through new technologies. So we wait until we see proven success and are able to repeat it successfully. Then it becomes a tried-and-true approach that practitioners can trust and use in their projects. Finally, confidence takes over, knowing that others have paved the way.
One way to circumvent that experience is to have a mentor go through the implementation with you step by step and show you how it’s done. As consultants, we offer that of, course, and we would love to always be in the trenches with you, ready for action. But because that may not be feasible, we give you the next best thing: our book as a guide. Here we have captured our proven successes and demonstrate our code.
With the subject being so fresh, we wrote this book to encompass both a strategic and tactical view, to include machine learning into your Oracle Business Intelligence installation. For practitioners and implementers, we hope that the book allows you to go straight to the parts you need to get your system up and running.
manager or director in charge of analytics, this would be the method suggested for you. Then perhaps, you can pass it on to your development team to incorporate the R code to get the most out of this book. For the purposes we have described, we have purposely written some chapters purely centered around the code, while others help shape the discussion surrounding the topic.
Moreover, if taken as a whole, each chapter builds onto the previous ones. The book starts with an introduction to artificial intelligence and machine learning in general. Then it introduces Oracle Business Intelligence. Finally, it progresses to some coding and programming, culminating with an actual use case to apply the code. This progressive nature of the book is purposeful and mimics a software development life cycle approach as we go from planning and analysis all the way to implementation.
We hope you find this book helpful and wish you success in implementing this new and exciting technology.
Introduction
“I think, therefore I am.” Just as this concept has fueled discussions in philosophy classes about man’s existence, it can now certainly apply to an exploration of what it really means to be a thinking entity. Moreover, it sparks today’s discussions about what artificial intelligence (AI) is as it pertains and compares to human intelligence. Is the aim of artificial intelligence the creation of an object that emulates or replicates the thinking process of a human being? If so, then the Western philosopher Descartes’ famous phrase takes on a whole new meaning in terms of existence and the ability to think and—perhaps equally important, especially in machine learning—the ability to doubt, or to interpret that something is uncertain or ambiguous.
Beyond philosophy, this seemingly simple notion can be applied now to our capabilities in analytics and machine learning. But it certainly begs a very direct question: can we actually emulate the way that a human being thinks? Or at the very least, can a machine come up with logic as does a human—and if so, does it classify then as a thinking entity? Then again, do we really need to make this comparison? Or are we merely searching for any way to replicate or affect outcomes resulting from a thought or decision?
Indeed, the intelligence and analytical industry is undergoing drastic changes. New capabilities have been enabled by new technologies and, subsequently, new tools. Look around you. Machine learning is already being applied in obvious ways. It’s the technology behind facial recognition, text-to-speech recognition, spam filters on your inbox, online shopping, viewable recommendations, credit card fraud detection, and so much more. Researchers are combining statistics and computer science to build algorithms that can solve more-complex problems, more efficiently, using less computing power. From medical diagnosis to social media, the potential of machine learning to transform our world is truly incredible—and it’s here!
■
Note
The main focus of this book is applying artificial intelligence (machine learning)
to real applications in the business world. It is not enough to revel in the technology itself.
Instead, we’re interested in how it can change processes and functionality for the good of an
organization. In terms of business intelligence, that can clearly point to the ability to gain a
competitive edge.
With its anticipated prevalence in our daily lives, you probably want to know a little about artificial intelligence and machine learning. Let’s start with a few definitions to introduce our topic (www.oracle.com/technetwork/issue-archive/2016/16-jul/ o46ai-3076576.html):
• Artificial intelligence: The ability of a machine to execute a task without its being programmed specifically for that task. AI is now closely associated with robotics and the ability of a machine to perform human-like tasks, such as image recognition and natural language processing.
• Machine learning: An algorithm or set of algorithms that enable a computer to recognize patterns in a data set and interpret those patterns in actionable ways.
• Supervised learning: A machine-learning model that focuses its interpretation of a data set within specific parameters. A spam filter is a familiar example.
• Unsupervised learning: A machine-learning model that encompasses a complete data set when performing its interpretation. Data mining uses this technique.
• Predictive analytics: A machine-learning model that interprets patterns in data sets with the aim of suggesting future outcomes. Note: Not all predictive analytics systems use machine learning or AI-based techniques.
Artificial Intelligence and Machine Learning
It is said that Aristotle, the great thinker of the Western world, was looking for a way to represent how humans reason and think. It took 2,000 years for the publication of Principia Mathematica to then lay the foundation for mathematics. Subsequently, this work allowed Alan Turing to show in 1942 that any form of mathematical reasoning can be processed by a machine by using 1s and 0s. This, in turn, has led to some philosophical thoughts on the impact of machines on humankind.
made in computing power and in capabilities surrounding the effective handling of data via databases and business intelligence—and consequently now with big data. With each technological advancement, we are closer to being able to fully utilize artificial intelligence.
■
Note
Systems that were designed based on early philosophies and logic failed mainly
because of a lack of computing power, less access to large amounts of data, and an inability
to describe
uncertainty
and
ambiguity
. [1]
Let’s broadly define AI as “the field that studies the synthesis and analysis of computational agents that act intelligently.” [2] From this standpoint, our focus is on a computational agent that has the ability to act intelligently. For the purposes of our discussion, we need not be concerned about the fascinating human-like robots that carry out AI—which is usually the focus. We’ll simply agree that all of AI aims to build intelligent and autonomous agents that have a goal.
In this AI context, we’ll focus on what the agent is to accomplish. Mainly, AI aims to operate autonomously so as to come up with the best expected outcome. In the context of this book, that expected outcome is to improve decision-making and aid in predictive analytics.
So how does the agent go about being intelligent and performing its goal successfully? The answer lies in representation and reasoning.
In building a system for AI, you must do the following: • Acquire and represent knowledge about a domain
(representation)
• Use that knowledge to solve problems in that domain (reasoning) The agent can develop a representation of the current environment through past experiences of previous actions and observations. This and other data provide the inputs for which it can formulate reasoning. As part of designing a program to solve problems, we must define how the knowledge will be represented and stored by an agent. Then, we must decide on the goal and what counts as a solution for that goal. In other words, we want to do the following:
• Represent the problem in a language that the computer can understand (representation)
• Program the computer to compute the output (use knowledge and reasoning)
• Translate the output as a solution to the problem
Overview of Machine Learning
Machine learning brings together several disciplines dealing with computer science and statistics. In simple terms, artificial intelligence deals with the problem of extracting features from data and forming statistics so as to solve predictive tasks. Machine learning takes a unique approach to accomplishing that goal. It approaches the design of the machine learning agent able to make predictions without necessarily providing clear, concise instructions for doing it.
Essentially, machine learning allows the computer to “learn” by trying to find a function that will be able to predict outcomes. In this way, the main focus of machine learning is on the discovery and exploration of data that is provided. That is where it has great use in an enterprise business driven by data: in searching large amounts of data and discovering a certain structure or statistical pattern. In this way, machine learning allows us to take on data problems that were previously too difficult to solve or that we had no way of knowing how to solve. In the past, even the sheer volume of the data itself posed difficulties in terms of processing and extracting vital pieces of information. Later chapters cover in detail how machine learning can be applied and then implemented in an organization via enterprise business intelligence (BI) and advanced analytical solutions.
In simple terms, machine learning enables computers (machines) to learn from a certain stated task and patterns discovered in data. Moreover, it does this without being programmed with the specific steps needed to perform that task—much like a human can decipher and analyze an experience to improve a task. In other words, the computer learns how to best perform a task rather than being programmed with specific steps and instructions to accomplish the task. This is extraordinary, to say the least, because machines are mimicking humans in being able to learn. Let’s take this a step further and apply this concept.
With the goal of solving many tasks and providing the correct output, machine learning extracts features from input with hopes of being directed to a desired point. Consider that as a toddler recognizes a flower as a flower by looking at its distinct structure; the input to the toddler’s brain comprises the photons perceived through sight that the toddler’s brain processes. But a toddler isn’t born with the knowledge that a flower is a flower. The toddler learns it by seeing flowers over and over again and recognizing distinct features such as a stem, petals, and its circular symmetry. Machine-learning AI is similar, in that it learns and improves at performing a task (such as recognizing flowers) from experience.
The key here is that the algorithm for recognition is not specifically designated by the designer or the programmer. Rather, it is created by repeated data and statistical methods and training the AI agents of machine learning need to be trained. As part of this training, a large volume of historical data must be provided. [5]
in accordance with your features and characteristics. As the computer inputs more and more images. it can begin to check whether that feature falls within your learned attribute. Perhaps even before then, it can scan a picture and determine whether the object in the picture is human or not. The machine-learning algorithm can begin there and perhaps identify humans in the photograph. It learns whether the image is of a human or not. A virtual line is determined that indicates whether the object is indeed human. Perhaps the machine goes even further to look specifically for faces or facial features.
Patterns, Patterns, Patterns
A vital and important branch of machine learning is pattern recognition. Patterns and regularities in data help form meaningful labels. This pattern recognition mimics how we, as humans, categorize and classify things as we observe them. Through time and repetitive reinforcement, we begin to identify a pattern in our observations, and thus begin a process of learning from those patterns. This works much the same way for machines in today’s world of big data; that repetition can now be readily provided at an accelerated pace as computers sift through massive amounts of data to learn and recognize patterns.
Take, for instance, being able to distinguish faces in a social media application. The application is fed images and begins to formulate information based on data points. A computer programmed to learn will seek statistical patterns within the data that enable it to recognize and then represent that information, numerically organizing it in space. But, crucially, it’s the computer, and not the programmer, that identifies those patterns and establishes the algorithm by which future data will be sorted. Of course, there can be mistakes. The more data the computer receives, the more finely tuned its algorithm becomes, and the more accurate it can be in its predictions. Applied to “recognizing” a face, definitive points are determined to distinguish and identify similarities.
But what if the data points are fuzzy and not so definitive? Could a machine distinguish a likeness or even a representation of a person (for example, in a painting)?
We can reason that the likeness is close enough for us to even make an educated guess about the painting, and that a machine would not be able to pick up the pattern in order to learn and recognize the resemblance. We can then begin to understand how exactly a machine can learn, and how pattern recognition is the key to this ability.
Machine learning can be divided into three main types. Two of those main categories are supervised and unsupervised. These are most applicable and pertinent to today’s big data.
With unsupervised learning, the agent can pick up patterns in the input that is provided. Moreover, no explicit feedback or instruction is given. The most common unsupervised learning task is clustering, which deals with detecting potentially useful clusters of input examples. [1] Let’s apply this concept to people. Children don’t need to be told that something is a flower in order to recognize it as something distinct; when repeatedly seen, the flower is mentally registered as a visual pattern by the child. Without specific instruction, the child can recognize the flower as a thing that belongs in a group. The association with the word flower is made later, and is just a classification of this thing that the child’s mind already grouped. With enough data that covers all possibilities, grouping can be done. Clustering is the most common type of grouping.
Contrast this to supervised learning, where the agent is provided a direct input to home in on as it attempts to clarify and classify items accordingly.
Furthermore, along with supervised/unsupervised learning, we have reinforcement learning. Here the agent learns (in either a supervised or unsupervised manner) from a series of reinforcements in the form of rewards or punishments. A binary result is the focus, as each respective reward or punishment signals to the machine that it may have done something right or wrong, respectively. It is then up to the agent to decide which of the actions prior to the reinforcement were most responsible for it. [1] In turn, the machine uses this information to further learn and move toward a certain outcome.
major topics such as knowledge discovery and classification. However, we will continue to cover this subject in our blog at www.bis3.com, where we cover the latest in business intelligence software, service, and solutions.
Machine-Learning Vendors
In a race to provide artificial intelligence and machine learning to the mainstream, a multitude of vendors have clamored to the market to offer premiere tools. In 2016, artificial intelligence and machine learning exploded onto the scene, becoming a reality in many facets of our daily lives—especially in the Internet world, including Google and Facebook, for instance. From a corporate standpoint, some of the leaders thus far have been those organizations that led the software and database application revolution in the past, such as Oracle, which offers a complete, holistic enterprise reporting and analytics offering.
Build or Buy?
This new trend in analytics is resulting in a barrage of unique partnerships. Even some strange bedfellows are looking to collaborate in order to offer capable services or products in the new BI and big-data analytics market. If the past strategies of major software companies hold true, I can easily predict that if some of these vendors can’t develop their own software, they will end up acquiring their missing pieces.
In terms of this book, the real questions we need to answer are as follows: • What improvements do vendors need to offer in order to satisfy
capabilities in this space for the future?
• Is Oracle Business Intelligence the right platform and technology to provide a foundation for what is to come with artificial intelligence?
Numerous industry analysts make predictions about which vendors will win the race to deliver the best offering. Many look for Oracle to be a leader in this area. With its latest offering relying heavily on artificial intelligence and machine learning, it will be interesting to see what Oracle can develop, or perhaps which companies and technologies it will acquire to complete its offering.
Introduction to Machine-Learning
Components in OBIEE
Oracle Corporation has long been in the business of data management. And with every advancement in data and knowledge management, new capabilities have led users to more—and even advanced—features of business intelligence. With Oracle’s introduction of Oracle Business Intelligence Enterprise Edition (OBIEE) a decade ago, and its
subsequent adoption and popularity, users wanted to gain more control of their data and any capabilities that their analytical tool could offer.
So began this need for self-service BI. It was exactly this functionality that users sought in a BI system that would allow some degree of independence and capability for users to do their own analysis. I’m sure that almost all would agree that this idea of self-service BI is perhaps the true overall vision and essence of what a business intelligence solution should offer. Indeed, the industry has come a long way to be able to offer all the technologies that enable a person to access and readily use large amounts of data. In recent years, the industry has introduced new tools and technologies, such as big data and artificial intelligence, to help realize self-service BI and beyond.
Oracle BI and Big Data
Self-service BI revolves around the fact that using data for decision-making is aided, in particular, by interactive and business-user-driven interfaces to that underlying data. Data today consists not only of structured data, but also of unstructured data—which is often referred to as big data. The analysis of big data demands fast processing as well as an integrated approach to the analysis of online transaction processing (OLTP) and online analytical processing (OLAP) data and the discovery of new information from that data. Big data for decision-making must support new data, new analytics, and new metrics that involve past performance analytics along with predictive analytics.
Self-service and, more important, the resulting actionable analytics, can become a reality as the latest technologies and business analysis processes (such as mobile device management, visual discovery, and spreadsheet analysis) become business-user driven, with no disconnect across all needed data points. Oracle’s concentration on the enterprise is making this possible.
OBIEE combined with Oracle Essbase provides a holistic solution that enables predictive analytics, operational BI, and self-service reporting on structured data. Similarly, Oracle offerings for analytics and big data can help extend BI beyond relational data and its multidimensional analysis, which in turn allows self-service analytics on gig data. This can answer what we call the who, what, when, why, and even how of big data in near-real-time, with results easily served via a dashboard and various visualizations of the data to expose the vital information discovered.
R for Oracle BI
Perhaps the biggest enabler and game changer in today’s analytical space is the introduction of the R language for statistics into various BI and analytical products. Beginning in 2012, Oracle made a major leap into artificial intelligence when it announced Oracle Advanced Analytics for big data. This package integrated the R statistical programming language into the Oracle Database (version 11g at the time), and bundled Oracle R Enterprise with Oracle Data Mining. Since then, Oracle has continued to add R and its capabilities in its suite of BI tools. Oracle also has committed to using it for machine learning to fine-tune and improve its own products, including its flagship database offering, being dubbed as a self-healing database system.
Introduced in 1995 as an open source project, R has been adopted by millions of users for statistical analysis. Oracle has integrated it and enabled its functionality to be utilized by its applications and systems. Oracle customers can utilize this analytical functionality to explore and discover valuable information from all the data gathered in their Oracle systems.
This book later provides an example of applying R and machine-learning techniques to create and develop actionable BI and analytics.
Summary
This chapter provided an introduction to artificial intelligence and machine learning— rom their early history and evolution, to today’s world as a game changer in our daily lives. A multitude of algorithms have already been written as well as applications that successfully use machine-learning techniques. From the early automation of tasks found in industries such as agriculture and manufacturing, we have now reached an age in which new applications are being sought to automate tasks for knowledge workers.
One such area of automation is in decision support systems (DSSs) and enterprise data warehouses (EDWs) specifically in an organization. It is here where the power of computing and the capability to handle volumes of data are being put to the test with new applications of AI-powered technologies. The basic goal of the EDW is to find a trend in the data that has been integrated and stored. Often, it is only in the EDW that an organization has data that is completely gathered, integrated, and further cleansed; this enables the delivery of a usable set of data that can provide historical insight into the enterprise and expose trends. Applying AI and machine learning can extend the EDW even further by supplying missing or unknown data.
Machine-learning application algorithms that can discover trends and basic patterns lend themselves to the exact focus and purpose of an EDW. OBIEE is the perfect
Citations
Russell, S. J., & Norving, P. (2010). Artificial Intelligence: A modern Approach. New Jersey: Pearson. [1]
Artificial Intelligence: Foundations of Computational Agents by David L. Poole and Alan K. Mackworth [e-textbook] http://artint.info/html/ArtInt.html#cicontents [2]
https://www.forbes.com/sites/mikhailnaumov/2016/12/30/2017-guide-for-deep-learning-business-applications/#6a0217147b84 [3]
https://journalofbigdata.springeropen.com/articles/10.1186/s40537-014-0007-7 [4]
http://docs.aws.amazon.com/machine-learning/latest/dg/training-ml-models.html [5]
Business Intelligence,
Big Data, and the Cloud
In our first book together, written around 2015, we described how a complete, holistic BI solution involved three main classifications of reporting and analytics in general. In that book we labeled them as:
• Operational Reporting • Operational BI • Analytical BI
At the time, we focused on mainly describing the elements in an enterprise business intelligence solution—that is, one that involves structured data. Although we wrote a few chapters about it, we almost purposely ignored the changes in the industry that were happening at the time with the emergence of big data and the cloud. Since then, we can no longer ignore their presence and dominance in what is to become the future of business intelligence and analytics. This book covers these components along with artificial intelligence (machine learning) that enable advanced analytics and even big-data analytics.
Now with the new capabilities advanced by today’s latest technologies such as big data, artificial intelligence, and cloud computing, a new classification in the reporting and analytics realm has taken the forefront and grabbed a lot of attention. That new classification comprises data discovery and exploration and even big-data analytics in general. In this new classification, even the area of business intelligence as a whole takes on an entirely new role. Business intelligence has transformed into a totally different level of functionality, with capabilities to provide insights about and interactions with the intelligence gathered from the data. This next level of business intelligence—being fueled by artificial intelligence—is called actionable intelligence.
The Goal of Business Intelligence
technologies that were needed. Take, for instance, real-time or near-real-time analytics. The challenge was that by the time the data reached the right person, the intelligence would no longer be fresh or worth utilizing. A line manager or director in charge of such operations would not even have access to that type of information (and related insights) in order to affect the operational process; this lack of information could prevent businesses from gaining a competitive edge.
So it was that real-time business intelligence did not even come into play until the tools and technologies became sophisticated enough to move data to and from the source in a way that was conducive to using that data to gain a competitive edge. The mere act of gathering data within your organization in order to utilize it posed a big challenge. For many decades, just the idea of being able to store all that information together in one place was a big issue. There was simply no effective way of moving data to and from one system to another. Several approaches were studied to determine the most effective method of creating intelligence and analytics from raw data. Let’s discuss an early solution to moving data around.
A great deal of the evolution in capabilities to collect and use data was initiated by companies such as Informatica, which focused on delivering data from one source to a target. With Oracle-Based Optimization Engine (OBOE), we already had methods of moving data by, for example, writing SQL scripts and using SQL *Loader with Oracle. But there just wasn’t a sophisticated way of moving data from one system to another. Even if you were able to collect all the data, you’d still have the challenge of cleaning it, transporting it, and converting it. This problem was addressed by companies such as Informatica, which automated the process by creating what is now called extract, transform, and load (ETL). An entire market grew around this new technology as executives were able to focus on business intelligence and analytics.
Although ETL was effective for managing the process, it still left a void in being able to handle large amounts of disparate data and, especially the unstructured data we now call big data. There simply was no effective way of moving data around, not even with powerful ETL tools. This issue opened up a whole new paradigm for handling large amounts of data. We will discuss this new approach for data preparation later in this chapter.
Big-Data Analytics
There are differences between business intelligence and big-data analytics. Although today the two terms are often used interchangeably. However, with new advancements in technology, data architectures, and strategies—and specifically in advanced analytics—I expect that the two will eventually converge to be one and the same.
In the early days, starting with reporting, the capability to access data for use transactionally was the main focus. However, it was not really capable of gaining any kind of insight analytics based on history—at least not automatically. Reporting was really just a means to access whatever data your transactional system had. Any kind of analytics thereafter was done by a different system, often referred to as a decision support system (DSS) or an online analytical processing (OLAP) system.
whole are encompassed by what is now referred to as business intelligence). But with each advancement of the tools and technology that deliver reporting and analytics capabilities seamlessly, new subcategories arise that have their own sets of success criteria and requests.
In terms of big-data analytics, a whole new set of goals has arisen related to actionable business intelligence. We aim to push analytical systems to go further, to be predictive and prescriptive. If we were to truly change the success of this industry, we would have to point to these recent advancements as the impetus for an evolution that would then take business intelligence and analytics truly to the next level, where information and intelligence provides valuable insights that can then be totally actionable.
With the cloud, we come closer to this goal of actionable business intelligence, as this ubiquitous solution clearly offers several advantages (see Figure 2-1).
In 2016, a popular data visualization vendor wrote a white paper titled “Top 10 Cloud Trends for 2016.” The paper stated the following:
In 2015, the cloud technology landscape changed in ways that only a highly
disruptive market can. From watershed innovation announcements to
unexpected business moves, 2015 drove any last shred of doubt from the
minds of skeptics that the cloud revolution is permanent. At the eye of this
storm is the growing realization that data as a critical business asset can
be very efficiently (and cost-effectively) stored in the cloud. The database,
integration, and analytics markets are now in a race to understand how
each can ultimately capitalize on this shift.
But Why Machine Learning Now?
The argument in favor of machine learning is quite simple: we want to access as much data as possible in one repository and be able to analyze that data in order to find certain patterns that may be useful. These might be patterns that would not be humanly possible to derive without the use of a supercomputer. Therefore, we can argue that only through artificial intelligence, which is machine learning, can we even get to the results.
Until now, technology has not provided us the means to be able to use all the data that is now being produced. Without these new tools and technologies, we would have a sea of endless data that we, as humans, couldn’t possibly analyze and process.
In 2016, Oracle announced its future strategy and next generation of cloud infrastructure called Cloud at Customer. In response to the public’s acceptance and adoption of its previous cloud offerings, Oracle centered its new strategy on its customers and the advantages that new technologies can bring to the table for its ERP programs (for example, EBS) that cover every aspect of the enterprise, from human resources to supply-chain management.
Cloud at Customer combines data throughout the enterprise with multiple sources, and uses machine learning to make recommendations. Artificial intelligence is embedded into the software applications and coupled with Oracle’s data. Oracle describes the products as “software-as-a-service offerings that blend third-party data with real-time analytics to create cloud applications that adapt and learn.”
Moreover, with its the real-time analytics, machine-learning results presented in user-friendly displays, and data visualizations, engineered systems such as Cloud at Customer can offer users so much more insight into their enterprise data and information.
A Picture Is Worth a Thousand Words
What is data visualization? Let’s explore the increasing role that this tremendously popular technique is playing in today’s analytics. Visualization, by itself, is defined as the transformation of information to visual objects such as points, lines, and bars, with the goal of communicating that information to viewers more efficiently. The information can be a set of numerical data or even abstract ideas, processes, or concepts. Data visualization, in technology, refers to the display of information that can be stored in computers, with the goal of explaining or exploring patterns, trends, and correlations. In a broader sense, this can be seen as relations of numbers. Undoubtedly, using charts or graphs (or some other form of data visualization) is an easier means to process large amounts of complex data, as opposed to having to process the data laid out in a tabular form stored as spreadsheets.
We have all heard the popular quip that “a picture is worth a thousand words,” or should we say in today’s business intelligence and analytics world that “a visualization is worth a thousand data points.” Data visualization can compress rows of data into a pictorial representation, allowing viewers to quickly access a lot of information efficiently. It is designed to engage its viewers and hold an audience’s attention. This is because images are easier to absorb and interpret than tabular data; the human brain has better perception for images, as compared to words and numbers.
a lot of mental processing, as well as mathematical and statistical expertise, to see their relationships. In contrast, patterns, correlations, outliers, and trends are much easier recognize visually.
In terms of using data visualization for explanatory purposes, images are also easier to retain than words and numbers. Moreover, data visualization can answer questions in a more complete way that shows the bigger picture. For example, say you have a quantitative question, such as which month had the lowest amount of sales. An answer presented through data visualization would show a complete picture, enabling you to see the distribution of sales throughout the year as well as how much smaller that minimum was compared to other months. In contrast, an answer from simple query-based software would give you only the direct value. Data visualization also provides an ease of access to data and new insights that encourages follow-up questions, which in turn lead to new insights. For instance, the same data answering a monthly pattern can also answer a yearly pattern if aggregated.
Business managers need to pinpoint issues and opportunities in their businesses, but also to quickly figure out why and how they are occurring in order to make reactionary decisions. Business analysts need to find key variables that influence these issues and these opportunities in order to formulate the right solutions. [1] The effect that data visualization has on analytics is dictated by the continuing needs of businesses for BI and analytics. Businesses rely on analytics to put actionable information in the hands of line-of-business users quickly by providing self-service access to data and custom analysis on the fly to empower decision makers. [2]
Recognizing the need to combine visualization solutions with data analysis and data-mining front ends, a new discipline has emerged from information visualization, scientific visualization, and data-mining communities: visual analytics. Visual analytics
focuses on the entire so-called sense-making process that starts with data acquisition, continues through a number of repeated and refined visualization scenarios (during which interaction allows users to explore various viewpoints, or test and refine numerous hypotheses), and ends by presenting the users’ insight about the underlying phenomena of interest. As such, visual analytics typically focuses on processes or data sets that are either too large or too complex, by a single static or image. The goal of visual analytics is to provide techniques and tools that support end users in their analytical thinking. [3]
A further fundamental feature of visualizations is their interactive aspect. The visualization process is rarely a static one. In most applications, there is a need to visualize a large amount of data that would not fit on a single screen, a high-dimensional data set containing many independent data values per data point, or both. In such cases, displaying a static image that contains all the data is typically not possible. Moreover, even when this is possible, there usually are many ways of constructing the data-to-image mapping, which the user might like to try out in order to better understand the data at hand. All of these aspects benefit from the use of interactive visualizations. Such applications enable the user to modify several parameters (ranging from the view angle, zoom factor, and color usage to the type of visualization method used) and to observe the changes in the produced image.
science in order to perform more complex exploratory analysis to process big data. So the business thinkers may need to consult with the data team before getting a clear answer to questions about their data.
Visualization is a continuous process. Large amounts of data cannot all be summed up in one, or even just a few, images; big data is too vast, and each data point has too many attributes of value. For example, rows of data for a sales transaction for a department store chain has many attributes: the price sold, profit margin, date, location of sale, time, and even more attributes originating both from the product and the buyer. All these attributes cannot all be summed up into one or a few forms of visualization. Different variables need to be isolated, omitted, and filtered in a continuous process to gain new insights.
In a way, visual analytics has become the user-friendly interface for business thinkers to access big data. Business thinkers can take the initiative and be analysts. With quick and interactive access to data, business thinkers can freely explore data without necessarily having a specific question to answer or an issue to solve. Visibility of data for easier and quicker recognition of patterns, correlations, trends, and outliers backed with the business expertise to reason about these observations becomes a very powerful commodity for businesses. For this reason, many enterprise software providers are now adopting visual analytics as a necessity.
In today’s landscape of business intelligence and knowledge management, data visualization has become such an essential—and even the most powerful—tool for analytics. For that reason, many vendors have focused on it and marketed how it should be done effectively. There are many who say data visualization is an intricate blend of science and art. Its appealing and effective interface experience has become an essential part of the big-data analytics equation, and many vendors have recognized its role.
In conclusion, data visualization tools are transforming business intelligence, as many vendors in the marketplace have gone to market primarily around their data visualization tools. Some vendors have recently risen to popularity by riding this data visualization and discovery wave and have seen a new chance to compete by focusing on their product’s data visualization capabilities. Many of these were small “departmental” tools. On the other hand, the major players of business intelligence are also now in the game, such as Oracle with its most recent version of OBIEE 12c. In this case, they have released visualization capabilities to complement their traditional and already popular suites of tools.
CITATIONS
www.sas.com/en_ca/insights/analytics/what-is-analytics.htm
[1]
http://bluehillresearch.com/business-intelligence-data-visualization-and-the-brain/
[2]
Telea, Alexandru. Data Visualization: Principles and Practice. Boca Raton: CRC, Taylor
& Francis Group, 2015. Print. [3]
Data Modeling
The direction now in working with data is to turn unstructured data into structured data automatically. With the Oracle Analytics Cloud platform, Big Data Services will use a lightweight model and then use the Data Preparation with artificial intelligence to read the data from any data store and add it to the model. The focus is shifted toward the business and analytics modelers to apply their model on top of the data that is already prepared and ready for analysis, and the real work that is needed.
Another feature is Oracle Big Data SQL, which has the ability to send out a query of any format and standards that are not native, such as NoSQL databases. Furthermore, SQL with R will be used to do analytics.
It’s important to understand that two different structures and architectures are needed to support a transactional system and a decision support system. Simply speaking, one type of architecture can’t effectively satisfy both. As a data architect, you must understand how and when to apply the proper architecture to each respective system. To this day, I still encounter organizations that do not understand this basic notion and fail miserably at constructing a proper solution. Even worse, I have recently encountered organizations that took it upon themselves to create yet another structure (explaining it as a hybrid) that supports neither transactional nor decision support solutions effectively. What they end up with is yet another structure to maintain that costs a tremendous amount of money and resources to create, and yet still leaves a void in offering a proper solution. Furthermore, any future advancements aided by artificial intelligence and machine learning would be further confused by the patterns of the data structures and thus could not be utilized.
To illustrate this, try optimizing a transactional system the same way you do a decision support system, and vice versa. You will find that you end up with futile results. For instance, the index you create for a transactional system focuses on data manipulation (inserts, updates, and deletes) and will surely be different from one created for decision support, in which the main focus is for fast retrieval and querying. How great it would be to be able to hit your transactional system directly for querying, without any other type of work needed. Indeed, when technology catches up to a point where transactional systems and decision support systems can use the same database structure in the back, then there will be no need for data architects and their expertise. With machine learning, that day might have just arrived.
By using data points, we can create aggregates and summaries from the data that paint a picture of facts and behavior (which could be expected or unexpected). Moreover, through artificial intelligence and machine learning, anomalies can be identified based on baseline data in order to predict certain future actions. This predictive and prescriptive function is the ultimate aim for machine learning, which focuses on real-time analytics and automated anomaly detection in data.
The Future of Data Preparation with Machine Learning
Artificial intelligence has changed the future of analytics in Oracle by changing the way we create an analytical solution. One of the most significant changes has been in preparing data for generating reports. The term data preparation is becoming more and more important and could be the game changer we’ve been looking for all along.
Let me set the background for why this is significant. When building a solution from the ground up, the traditional method for implementation what’s the first put into place the data foundation needed to support the application your solution. In general, this endeavor involved a tremendous amount of time and effort between business and technical resources to come up with the proper data foundation. As such, data architects have been tasked with coming up with the day model and subsequent database, and the whole development process is dependent on it.
For over two decades, my expertise has been repeatedly utilized. It has been my personal observation that, although an extremely important skillset for developers of data-centric applications, it seems to be one that was forgotten or even set aside. As a result, I’ve seen projects that were unsuccessful due to the lack data architecture and data modeling skillsets. The fact is that laying down the foundation is probably the single most important piece of a data-centric and data-driven solution. Without the proper foundation, downstream applications would have to “muscle” a solution and try to make up for problems in the day model. It took me years of experience to finally be able to provide the expertise over and over again. So what if this expertise could be packaged up in a way that could be readily used to create a solution? That application would act as a data architect, armed with the appropriate design techniques needed to come up with a proper data model and foundation. Essentially, you would be able to deliver a solution on the fly because it would be readily handled with automation.
Enter today’s paradigm for creating a data model, which has shifted considerably. Timing is an equally important factor in today’s process. In starting a solution, instead of having a data model specified fully up front, machine learning enables us to identify certain data elements and objects that are missing and append them to a model that is already in place. This eliminates common obstacles that data modelers and architects encounter when attempting to set the right foundation correctly in the first attempt. So how does this affect development? Implementation can be considerably shortened by only having to set into place a baseline foundation and then letting AI continue the development by identifying missing components. In other words, through machine learning, a simple schema can be read and utilized by your machine-learning algorithm in order to determine the proper storage of data as it comes into your landing area. Consequently, via the machine-learning algorithm, the mechanism can recommend and even create the proper attributes in accordance with the data sampling to automatically create a new schema.
So what does that mean for data modeling? It means that you no longer have to make sure that your schema is currently specified with your database and subsequent RPD. Machine learning will help to automatically include any data that is beyond the structured schema, by adding it as a recommendation based on the patterns found in the data.
Oracle Business Intelligence Cloud Service
In 2014, Oracle released one of the first BI platforms on the cloud as part of its Oracle Analytics Cloud offering. It was a full-fledged cloud application that at the time was relatively new. For those practitioners familiar with OBIEE, it essentially offered the features of 11g.
In 2016, I was implementing OBIEE 12c for a US government agency, but also presented the BICS product at one of the Oracle Application User Group conferences. I noted that the data visualization feature and components came in a separate offering. I sensed that it was only a matter of time before Oracle integrated everything between OBIEE, Visual Analyzer, and big-data analytics. That time has now come, and I urge those who are interested and tried it before to give it another try.
Oracle Analytics Cloud
Leading up to the Oracle Analytics Cloud that we have today, BICS was the first
generation of the BI application on the cloud. As previously mentioned, it included in its suite package the tools needed to develop reporting and analytics from the ground up, including a database service, a modeling tool, a data loader, and dashboards. From an industry standpoint, it was one of first on the cloud, and its feature set was more like 11g.
Oracle Analytics Cloud, the second-generation analytics product, is essentially the “latest and greatest” version (12c) of Oracle’s cloud solution. Moreover, as a go forward strategic, Oracle will update the cloud version first with new features and the on-premises version will follow suit.
In terms of features, the Standard version concentrates on visualization (to compete against data visualization tools such as Tableau, Qlikview, and PowerBI. The enterprise includes everything to make it a complete holistic solution, including the Big Data Lake Edition with big data and artificial intelligence components. In addition, it has BI Publisher for reporting. For advanced analytics, R and mapping are built in. A content pack is provided free in order to help bootstrap development. Through machine-learning approaches programmed in R, corrective actions are suggested by the analytics. Subsequently, the analytics project can be published, exported, and imported to be shared with others or to embed in a web page to share.
Oracle Database 18c
Oracle Mobile Analytics
As an integral part of Oracle’s overall strategy, it has incorporated programs and applications to tie in today’s mobile devices. Day by Day and Synopsis are mobile applications that are part of its next generation of mobile apps that are integrated with the enterprise layer seamlessly.
ANALYTICS ON THE GO
Oracle Business Intelligence Mobile is the only mobile app that provides a full range
of functionality—from interactive dashboards to location intelligence—and lets you
initiate business processes right from your mobile device. The app enables you to do
the following:
–
Make business intelligence as easy to use as any consumer mobile
app
–
View, analyze, and act on all your Oracle Business Intelligence
content on the Apple iPhone and iPad
–
Instantly access new or existing content on mobile devices; no
design changes required
–
Increase the use of business intelligence in your organization with
an intuitive and easy-to-use mobile application
www.oracle.com/solutions/business-analytics/business-intelligence/ mobile/bi-mobile/index.html
The user would use the voice interface through the mobile device, which, in turn,
goes through the semantic layer of the Enterprise BI and Big Data Lake layer, and
then finally build a visualization in response to your inquiry.
Summary
Oracle, with its recent offering of the Oracle Analytics Cloud platform, has provided a complete, holistic, analytical solution encompassing business intelligence, big data, and artificial intelligence all on the ubiquitous cloud.
The two main features of machine learning are as follows: • Data visualization
• Data preparation
The Oracle R Technologies
and R Enterprise
Advances in artificial intelligence (AI) have extended the domain of business intelligence (BI) to areas of machine learning and predictive analytics as well as big-data analytics. This has resulted in an expansive set of machine-learning algorithms that can be used to solve real-world BI problems. One of the most popular and widely used languages for machine learning and statistical computing is the R open source language. Its extensive set of algorithms, coupled with its support for rich graphics and data visualization, has made it the language of choice for data analysis and data science.
This chapter focuses on R technologies for the enterprise. It also outlines the use of some of the expansive sets of open source R packages as well as the use of R scripts and Oracle R Enterprise in the Oracle database from a machine-learning perspective. The chapter explains how Oracle R Enterprise can be used with OBIEE. Finally, it explains how to perform big-data advanced analytics by using machine learning with the R ecosystem.
R Technologies for the Enterprise
R is an open source scripting language for machine and statistical learning and advanced graphics functionality. For the purposes of this chapter, R technologies can be broadly classified into two categories: open source R and Oracle’s R technologies.
Open Source R
R is extensible and comprehensive with the ability to add custom functionality in the form of new packages. R can be further extended with out-of-the-box features in the form of knobs that help in additional customization. Either the R project web site or the CRAN web site can be used to download and install R for free.
■
Note
Details of the R open source project can be found at
www.R-project.org.
Table 3-1 describes the widely used CRAN task views for machine learning. These can also be found at https://cran.r-project.org/web/views/MachineLearning.html.
Table 3-1. CRAN Task Views for Machine Learning
View Name
Description
Recursive Partitioning Tree-structured models for regression, classification, and survival analysis; rule-based models and boosting; recursive partitioning
Random Forests Regression and classification, ensemble learning, reinforcement learning trees
Regularized and Shrinkage Methods
Linear, logistic, and multinomial regression models; gene expression analysis
Boosting and Gradient Descent Gradient boosting and learning models based on gradient descent for regression tasks
Support Vector Machines Interface to SVMLIB and and SVMLight (only for one-against-all classification)
Bayesioan Methods Bayesian Additive Regression Trees (BART), genetic algorithms, etc.
Associative Rules Mining frequent itemsets, maximal itemsets, closed frequent itemsets and association rules
Fuzzy Rule-Based Systems Fuzzy rule-based systems from data for regression and classification, rough set theory, and fuzzy rough set theory
Meta Packages Building predictive models (caret), GBM, GLM (with elastic net regularization), mlr, and deep learning (feed-forward multilayer networks)
Oracle’s R Technologies
Oracle’s R technologies consist of the following:
• Oracle R Distribution
• ROracle
• Oracle R Enterprise (ORE)
• Oracle R Advanced Analytics for Hadoop
Each is descibed in the subsections that follow.
Oracle R Distribution
Oracle R Distribution is a free R software redistribution of open source R. This contains functionality to dynamically load math libraries for high-performance computations and learning, including multithreaded execution. The primary math libraries include Intel Math Kernel Library, AMD Core Math Library, and Solaris Sun Performance Library. Mathematical functions such as matrix functions, component analysis, fast Fourier series transformations, and vector analysis can be transparently done using these libraries. Oracle R Distribution also comes with enhancements to open source R and is available on Oracle Enterprise Linux, Solaris, AIX, and Windows. Oracle Support is included for customers of the Oracle Advanced Analytics option and Big Data Appliance as well as Oracle R Enterprise. Use of Oracle R Distribution also enables scalability across the client and database for embedded R execution. As of this writing, the latest version of Oracle R Distribution is 3.3.0.
View Name
Description
Visualization Various plots and graphs for visualization in R including scatter plots, feature sets, ggplots, pairs plots, plots for exploratory data analysis, trellis charts, and plots for learning models including random forests and SVMs, prediction functions, etc.
Statistical Learning Various alogirthms based on statistics and probability for data mining, inference, and prediction
ROracle
ROracle is a database-interface-compliant Oracle driver for R using Oracle Call Interface (OCI) libraries. Reengineered and optimized for connectivity between R and Oracle DB, ROracle is an open source R CRAN package managed by Oracle. It primarily enables execution of SQL statements from the R interface and transactional support for data manipulation language (DML) operations. ROracle is also used by Oracle R Enterprise to connect between R and Oracle DB. ROracle connectivity is faster while reading from Oracle table to R data.frame, and writing from R data.frame to Oracle table, as compared to RODBC and RJDBC. ROracle also is scalable across all data types (primarily, Oracle NUMBER, VARCHAR2, TIMESTAMP, and RAW data types) as well as large resultsets. As of this writing, ROracle 3-1.11 is the latest version of ROracle.
■
Note
ROracle can be used to connect to Oracle DB from the Oracle R Distribution.
Either the Oracle Instant Client or the Oracle standard Database Client
must be installed
for ROracle to be used. The SQL*Plus SQL interface can also be used with Oracle Instant
Client when connecting using ROracle. There is no need to create
ORACLE_HOMEwhen Oracle
Instant Client is used.
To use the ROracle package, first the Oracle Database must be installed. Then Oracle R must be installed, followed by installation of the ROracle package and database interface (DBI) package. Once this setup has been done, a connection can be established between Oracle DB and Oracle R by first loading the ROracle library and the Oracle DB driver, and then creating a database connection. Once this is completed, standard DDL, DML, and/or commit/rollback operations can be executed. When you’re finished using database operations, the DB connection needs to be closed and the database driver unloaded. Listing 3-1 gives an example of using ROracle; the codeloads the ROracle package and then retrieves results from an Oracle schema table. The built-in RConsole can be used to run ROracle methods.
Listing 3-1. Connecting to and Retrieving Results from an Oracle DB Table by Using ROracle from Oracle R
SQL> alter user testr quota unlimited on users; User altered.
This allocates unlimited quota to the user testr on the tablespace users.
SQL> create table temp_tab(cd varchar2(10 char) constraint temp_tab_pk primary key,
The following script must be executed in the R console.
library(ROracle)
drvr <- dbDriver("Oracle")
conn <- dbConnect(drvr, username = "myusername", password = "mypassword") select_resultset <- dbSendQuery(conn, "select * from myusername.temp_tab") fetch(select_resultset)
Here is the output of the code executed in RGui in:
> library(ROracle)
Loading required package: DBI Warning messages:
1: package 'ROracle' was built under R version 3.3.0 2: package 'DBI' was built under R version 3.2.5 > drvr <- dbDriver("Oracle")
> conn <- dbConnect(drvr, username = "testr", password = "testr") > select_resultset <- dbSendQuery(conn, "select * from testr.temp_tab") > fetch(select_resultset)
An Oracle instance can also be specified in dbConnect by using the DB instance name attribute, as as shown here: