Pentaho 8 Reporting for Java Developers
Francesco Corti
Pentaho 8 Reporting for Java
Developers
Copyright © 2017 Packt Publishing All rights reserved. No part of this book may be reproduced, stored in a retrieval system, or transmitted in any form or by any means, without the prior written permission of the publisher, except in the case of brief quotations embedded in critical articles or reviews.
Every effort has been made in the preparation of this book to ensure the accuracy of the information presented. However, the information contained in this book is sold without warranty, either express or implied. Neither the author, nor Packt Publishing, and its dealers and distributors will be held liable for any damages caused or alleged to be caused directly or indirectly by this book.
Packt Publishing has endeavored to provide trademark information about all of the companies and products mentioned in this book by the appropriate use of capitals. However, Packt Publishing cannot guarantee the accuracy of this information.
First published: September 2017
Production reference: 1120917
Credits
Author
Francesco Corti
Copy Editor
Safis Editing
Reviewers
Ruben Oliva Ramos
Juan Tomas Oliva Ramos
Project Coordinator
Nidhi Joshi
Commissioning Editor
Amey Varangaonkar
Proofreader
Acquisition Editor
Viraj Madhav
Indexer
Tejal Daruwale Soni
Content Development Editor
Cheryl Dsa
Graphics
Tania Dutta
Technical Editor
Dinesh Pawar
Production Coordinator
About the Author
Francesco Corti is an enthusiastic consultant in software solutions and loves working in developer, sales, and customers teams. Proud of the role of a software engineer, he is often involved in pre-sales presentations, public speaking, and IT courses. Developing software, designing architectures, and defining solutions in ECM/BPM and BI are his favorite areas of interest. He has completed dozens of projects, from very small ones to more complex ones, in almost 20 years of experience.
A product evangelist at Alfresco, Francesco represents the famous open source ECM in the developer community. In addition to helping developers adopt Alfresco technologies, he often helps Alfresco to improve the developer experience through talks, articles, blogging, user demonstrations, recorded demonstrations, or the creation of sample projects.
He is the inventor and principal developer of Alflytics (previously named
Alfresco Audit Analytics and Reporting), the main business intelligence solution over Alfresco ECM, entirely based on the Pentaho suite. He authored the
Pentaho Reporting video course with more than 40 videos and courses on the Pentaho Reporting Designer and SDK.
Francesco has specialty and principal experiences in enterprise content
management solutions with Alfresco ECM and Hyland OnBase (he is an OnBase certified installer); business process management solutions with Activiti, JBPM, and Hyland OnBase; data capture solutions with Ephesoft, Hyland OnBase, and custom software; record management solutions with O'Neil software and custom software (using Alfresco ECM and Hyland OnBase); and portal and
About the Reviewers
Ruben Oliva Ramos is a computer systems engineer from Tecnologico de Leon Institute, with a master's degree in computer and electronic systems engineering, teleinformatics, and networking specialization from the University of Salle Bajio in Leon, Guanajuato, Mexico. He has more than 5 years of experience in
developing web applications to control and monitor devices connected with Arduino and Raspberry Pi using web frameworks and cloud services to build the Internet of Things applications.
He is a mechatronics teacher at the University of Salle Bajio and teaches students of the master's degree in design and engineering of mechatronics
systems. Ruben also works at Centro de Bachillerato Tecnologico Industrial 225 in Leon, Guanajuato, Mexico, teaching subjects such as electronics, robotics and control, automation, and microcontrollers at Mechatronics Technician Career; he is a consultant and developer for projects in areas such as monitoring systems and datalogger data using technologies (such as Android, iOS, Windows Phone, HTML5, PHP, CSS, Ajax, JavaScript, Angular, and ASP.NET), databases (such as SQlite, MongoDB, and MySQL), web servers (such as Node.js and IIS), hardware programming (such as Arduino, Raspberry pi, Ethernet Shield, GPS, and GSM/GPRS, ESP8266), and control and monitor systems for data
acquisition and programming.
He has authored the book Internet of Things Programming with JavaScript by Packt Publishing. He is also involved in monitoring, controlling, and the acquisition of data with Arduino and Visual Basic .NET for Alfaomega.
Juan Tomas Oliva Ramos is an environmental engineer from the university of Guanajuato, with a master's degree in administrative engineering and quality. He has more than 5 years of experience in management and development of patents, technological innovation projects, and development of technological solutions through statistical control of processes. He is a teacher of statistics,
entrepreneurship, and technological development of projects since 2011. He has always maintained an interest for the improvement and the innovation in the processes through the technology. He became an entrepreneurship mentor and technology management consultant and started a new department of technology management and entrepreneurship at Instituto Tecnologico Superior de Purisima del Rincon.
He has worked on the book Wearable Designs for Smart Watches, Smart TVs and Android Mobile Devices.
He has developed prototypes through programming and automation technologies for the improvement of operations, which have been registered for patents.
www.PacktPub.com
For support files and downloads related to your book, please visit www.PacktPub.co m. Did you know that Packt offers eBook versions of every book published, with
PDF and ePub files available? You can upgrade to the eBook version at www.Packt Pub.comand as a print book customer, you are entitled to a discount on the eBook
copy.
Get in touch with us at [email protected] for more details. At www.PacktPub.com,
you can also read a collection of free technical articles, sign up for a range of free newsletters and receive exclusive discounts and offers on Packt books and eBooks.
https://www.packtpub.com/mapt
Why subscribe?
Fully searchable across every book published by Packt Copy and paste, print, and bookmark content
Customer Feedback
Thanks for purchasing this Packt book. At Packt, quality is at the heart of our editorial process. To help us improve, please leave us an honest review on this book's Amazon page at https://www.amazon.com/dp/1788298993.
If you'd like to join our team of regular reviewers, you can email us at
[email protected]. We award our regular reviewers with free eBooks and
Table of Contents
Preface
What this book covers What you need for this book Who this book is for
Conventions Reader feedback Customer support
Downloading the example code
Downloading the color images of this book Errata
Piracy Questions
1. Introduction to Pentaho Reporting Introducing Pentaho Reporting
Introducing Pentaho Reporting tools Types of users and required knowledge Technological advantages
A business friendly open source license Typical uses of Pentaho Reporting
Operational reporting
Business intelligence reporting Financial reporting
Pentaho Reporting history Feature overview
An advanced reporting algorithm A multitude of available data sources A wide variety of output formats Pixel accurate rich formatting
Java API for building reports Extensibility
2. Getting Started with Report Designer Prerequisites of your environment Setting up the Pentaho Report Designer
Introduction to the user interface
Creating your first report using the wizard Introducing the Report Design Wizard
Defining the look and feel
Defining the data source and query Defining the layout
Formatting the fields Previewing the report
Saving and opening the report Summary
3. Getting Started with Reporting SDK
Obtaining the Pentaho Reporting SDK
Anatomy of the Pentaho Reporting SDK Using the included Eclipse project Introducing the included examples
Creating a web application using Pentaho Reporting and Maven Prerequisites of your environment
Creating a web application in Java
Creating a Java web application using Apache Maven Creating the first page of the Java web application Including Pentaho Reporting Engine in a web application
Adding the Pentaho dependencies
Showing an existing Pentaho report in a web application Including an existing Pentaho report
Including the SampleData schema Updating the PentahoServlet Previewing the Pentaho report Summary
4. Creating a Report with Report Designer Creating a Pentaho report
Creating a new Pentaho report
Creating a datasource in Pentaho reports Adding details to Pentaho reports Previewing and saving a Pentaho report Customizing Pentaho reports
Customizing the font
Customizing the report header
Adding the details header and customizing the details Customizing the page footer
Grouping the details Adding charts
Previewing Pentaho reports in different formats Train yourself to learn faster
Summary
5. Design and Layout in Report Designer
Master report and report bands properties Common properties
Size and position properties
Font, text, and text-spacing properties Font properties
Query properties
Common properties in the attributes tab Wizard properties
Excel properties Advanced properties Pentaho properties
HTML properties
Vertical-line, horizontal-line, rectangle, and eclipse Survey-scale Visual layout in Report Designer
The grid Guide lines
Additional visual indicators
Moving and aligning single elements Aligning groups of elements
Miscellaneous layout capabilities Pentaho Report Designer shortcut keys Considerations for different output formats
Paging
Limits to rich graphics and charts Summary
6. Configuring JDBC and Other Data Sources Introducing data sources
Datasets in report explorer The JDBC data source
Adding or editing a JDBC connection About the JNDI access
Adding or editing a query The metadata data source The MongoDB data source
The Pentaho Data Integration data source The OLAP data source
The Pentaho community data access data source Summary
Including static images in reports Including dynamic images in reports Including charts in reports
XY series and XYZ series dataset Time series dataset
Thermometer dataset
Multipie chart example
XY bar chart, XY line chart, and XY area chart
XY bar chart, XY line chart, and XY area chart examples Extended XY line chart
Extended XY line chart example Waterfall chart Including sparkline charts in reports Summary
8. Parameterization, Functions, Variables, and Formulas Report parameterization
Using report parameters
The available report parameter types Creating parameters
Creating a report using parameters Functions and expressions
Creating and using functions
Rounding formulas Text formulas
User-defined formulas Summary
9. Internationalization and Localization Internationalization and localization Using resources to localize elements Resources for localization
Managing resource bundles Testing the localization
An example of report localization Summary
10. Subreports and Cross Tabs
Subreports in Pentaho Report Designer Subreport example
Other subreport examples Table of contents and index elements
Example of index
Cross tabs in Pentaho Report Designer Cross tab examples
Summary
11. The PRPT Format and the Java API to Build It Understanding the serialized report format
Anatomy of a .prpt bundle file
The datadefintion.xml file and datasources folder Parameters
Datasources folder layout.xml file
Group and detail band hierarchy Report elements
settings.xml file styles.xml file
Manual creation of a .prpt bundle file
Building a report using Pentaho Reporting Java API Adding a data source Adding elements to the report
Adding a label element Adding a chart element
Developing an example of Pentaho report Summary
12. Developing Using Data Sources
13. Internationalization, Subreports, and Cross Tabs Using Java Internationalization and localization using Java
Resources for localization using Java Testing the localization using Java
An example of report localization using Java Subreports using Java
Subreports using Java
An example of subreport using Java Cross tab using Java
Cross tabs using Java
An example of cross tab using Java Summary
14. Building Interactive Reports Interactive reports in HTML
Manipulating the reporting HTML DOM
Including an external CSS or JavaScript resource Example of interactive reports using Java
Opening a static URL from a Pentaho report Opening a dynamic URL from a Pentaho report Manipulating the content of a Pentaho report Example of master/details report interaction Summary
15. Using Reports in Pentaho Business Analytics Platform Introducing Pentaho Business Analytics Platform
Installing the Business Analytics Platform Basics of the Business Analytics Platform Publishing a report in the Business Analytics Platform
Manually uploading a report
Managing data sources Previewing a report
Previewing a report from the browse files page Previewing a report using a direct link
The bundled report preview Managing permits and schedule
Creating a dashboard with Pentaho reports Community dashboard editor basics Introduction of the report components
PRPT Component Execute Prpt Component Schedule PRPT Component Example of CDE dashboard Summary
16. Using Reports in Pentaho Data Integration Introducing Pentaho Data Integration
Installing Pentaho Data Integration Basics of Pentaho Data Integration
Jobs and transformations Steps and entries
Database connections Storage and reuse Introduction of Spoon client The Pentaho Reporting output step Introducing Pan and Kitchen
Summary
17. Pentaho Reporting Nightly Build and Support Pentaho Report Designer nightly build
Prerequisites for building the project Cloning the GitHub repository Building the release
Installing and running the nightly build Pentaho Reporting SDK nightly build
Updating the pom.xml file Adding the nightly build libraries Compiling and running the project Getting help from the community
Asking questions and helping others Online documentation
Submitting bugs and viewing backlogs Contributing code
Enterprise support
Preface
How many times you have been asked to develop appealing reports with the most up-to-date technology in a few days (or probably less) in various different formats using a web-based solution or a custom Java project? If this is the case, this book will enable you to reach that goal using the dedicated tool of the Pentaho suite, named Pentaho Reporting.
This book is a definitive guide for Java developers and information technologists about the open source reporting tool, allowing you to create pixel-perfect reports of your data in PDF, Excel, HTML, text, RTF, XML, and CSV, based on a wide range of data sources, using a visual design environment and the SDK to embed the Pentaho Reporting Engine into your applications.
The book is written when Pentaho Version 8 were about to be officially released, and it is mainly based on this version. The description of the features, tips and tricks and best practices is done using a learning-by-example approach. To better guide you through the different topics and the definition of a learning path, the book is organized into four main parts:
Introduction and basics of Pentaho Reporting
Core concepts and advanced features of Report Designer All about the Reporting SDK
What this book covers
Chapter 1, Introduction to Pentaho Reporting, covers the typical uses, history, and
origins of Pentaho Reporting, along with a more detailed overview of the reporting functionality that Pentaho Reporting provides.
Chapter 2, Getting Started with Report Designer, is focused on getting up and
running with Pentaho Reporting. It'll begin by setting up an environment for building and embedding reports. From there, the reader will walk through creating a report using the wizard and will finish the chapter learning how to save the report into the filesystem.
Chapter 3, Getting Started with Reporting SDK, is about the Pentaho Reporting
SDK. The reader will walk through embedding an existing report into a generic Java application.
Chapter 4, Creating a Report with Report Designer, goes one step further, covering
the most commonly used features for creating a report from scratch instead of using the wizard. The core concepts, such as customizing the report, saving it in the Pentaho repository, and previewing the content, will be detailed step by step.
Chapter 5, Design and Layout in Report Designer, dives deep into all the concepts
and functionality of Pentaho's Report Designer related to design and layout. The reader will explore in depth the ins and outs of design and layout of reports using the Pentaho Report Designer.
Chapter 6, Configuring JDBC and Other Data Sources, teaches you the
configuration of the data sources in all the ways Pentaho Reporting is able to connect in. The data source definition will be shown using Pentaho Reporting Designer.
Chapter 7, Including Graphics and Charts in Reports, shows how to incorporate
Chapter 8, Parameterization, Functions, Variables, and Formulas, starts off by
learning how to parameterize a report. This chapter covers all the predefined functions and expressions available for use within a report. It will help readers learn about Pentaho Reporting's formula capabilities, including the correct syntax and available formula methods.
Chapter 9, Internationalization and Localization, shows the details of
internationalizing and localizing a report.
Chapter 10, Subreports and Cross Tabs, covers building from scratch some
examples of subreports and cross tabs, exploring the capabilities offered by Pentaho Reporting. We will build a multi-page subreport that demonstrates the use of the sticky flag available for managing page headers and also build a subreport with a summary chart.
Chapter 11, The PRPT Format and the Java API to Build It, teaches Pentaho
Reporting's PRPT bundle format, along with the details of Pentaho Reporting's Java API. This chapter focuses on the composition of the PRPT file representing the Pentaho report and how to build it using the Java API.
Chapter 12, Developing Using Data Sources, shows various methods of loading
data into the Pentaho Reporting Engine, and digs deep into how the Pentaho Reporting Engine interacts with these data sources to render a report.
Chapter 13, Internationalization, Subreports, and Cross Tabs Using Java, covers
the details of report parameterization. You also learn the various ways to dynamically render a report, including learning all the available functions and expressions but from a Java perspective.
Chapter 14, Building Interactive Reports, teaches you to enable interactive
functionality within reports. You will also be able to modify report definitions to generate hyperlink events and many different HTML JavaScript events. You will learn how to render an HTML report on a server, along with including external script files within the HTML, rendered report.
Chapter 15, Using Reports in Pentaho Business Analytics Platform, shows the
Chapter 16, Using Reports in Pentaho Data Integration, covers how to use the
developed Pentaho reports inside the Pentaho suite, particularly with Pentaho Data Integration (Kettle) to develop jobs/transformations managing Pentaho reports.
Chapter 17, Pentaho Reporting Nightly Build and Support, covers a potpourri of
What you need for this book
Pentaho Reporting tools are cross-platform applications and will run in Linux, Windows, macOS, and other Java supported environments. The Reporting Engine is backward-compatible with previous versions of JDK, but it is always recommended to use the latest one. In the case of Pentaho 8, JDK version 1.8 is suggested.
All the examples contained into this book are developed using an Ubuntu
operating system v16.04 LTS with 4 GB of RAM and an Intel i7 processor. The development environment was composed by Java JVM 1.8.0_131, Apache Maven 3.3.9, Git version 2.7.4. This configuration is not mandatory for you to run the examples, but it is shared as a reference and suggestion to run the examples with success.
Who this book is for
Conventions
In this book, you will find a number of text styles that distinguish between different kinds of information. Here are some examples of these styles and an explanation of their meaning. Code words in text, database table names, folder names, filenames, file extensions, pathnames, dummy URLs, user input, and Twitter handles are shown as follows: "You will also learn the details of the Pentaho Reporting Engine data API specification, allowing you to implement your own DataFactory, if necessary."
A block of code is set as follows:
// Defining the connection provider.
DriverConnectionProvider provider = new DriverConnectionProvider(); provider.setDriver("org.hsqldb.jdbcDriver");
provider.setProperty("user", "pentaho_user"); provider.setProperty("password", "password");
provider.setUrl("jdbc:hsqldb:./resources/sampledata/sampledata");
When we wish to draw your attention to a particular part of a code block, the relevant lines or items are set in bold:
// Defining the connection provider.
DriverConnectionProvider provider = new DriverConnectionProvider(); provider.setDriver("org.hsqldb.jdbcDriver");
provider.setProperty("user", "pentaho_user"); provider.setProperty("password", "password");
provider.setUrl("jdbc:hsqldb:./resources/sampledata/sampledata");
Any command-line input or output is written as follows:
mvn clean install mvn package
java -jar target/dependency/jetty-runner.jar target/*.war
New terms and important words are shown in bold. Words that you see on the screen, for example, in menus or dialog boxes, appear in the text like this:
"Clicking the OK button moves you to the next screen."
Reader feedback
Feedback from our readers is always welcome. Let us know what you think about this book-what you liked or disliked. Reader feedback is important for us as it helps us develop titles that you will really get the most out of. To send us general feedback, simply email [email protected], and mention the book's title
Customer support
Downloading the example code
You can download the example code files for this book from your account at http:/ /www.packtpub.com. If you purchased this book elsewhere, you can visit http://www.pack tpub.com/support and register to have the files emailed directly to you.
You can download the code files by following these steps:
1. Log in or register to our website using your email address and password. 2. Hover the mouse pointer on the SUPPORT tab at the top.
3. Click on Code Downloads & Errata.
4. Enter the name of the book in the Search box.
5. Select the book for which you're looking to download the code files. 6. Choose from the drop-down menu where you purchased this book from. 7. Click on Code Download.
Once the file is downloaded, please make sure that you unzip or extract the folder using the latest version of:
WinRAR / 7-Zip for Windows Zipeg / iZip / UnRarX for Mac 7-Zip / PeaZip for Linux
The code bundle for the book is also hosted on GitHub at https://github.com/PacktPublis hing/Pentaho-8-Reporting-for-Java-Developers. We also have other code bundles from our
rich catalog of books and videos available at https://github.com/PacktPublishing/. Check
Downloading the color images of this
book
We also provide you with a PDF file that has color images of the
Errata
Although we have taken every care to ensure the accuracy of our content,
mistakes do happen. If you find a mistake in one of our books-maybe a mistake in the text or the code-we would be grateful if you could report this to us. By doing so, you can save other readers from frustration and help us improve subsequent versions of this book. If you find any errata, please report them by visiting http://www.packtpub.com/submit-errata, selecting your book, clicking on the
Errata Submission Form link, and entering the details of your errata. Once your errata are verified, your submission will be accepted and the errata will be uploaded to our website or added to any list of existing errata under the Errata section of that title. To view the previously submitted errata, go to https://www.packtp ub.com/books/content/support and enter the name of the book in the search field. The
Piracy
Piracy of copyrighted material on the internet is an ongoing problem across all media. At Packt, we take the protection of our copyright and licenses very seriously. If you come across any illegal copies of our works in any form on the internet, please provide us with the location address or website name
immediately so that we can pursue a remedy. Please contact us at
[email protected] with a link to the suspected pirated material. We appreciate
Questions
If you have a problem with any aspect of this book, you can contact us at
Introduction to Pentaho Reporting
Pentaho Reporting is an easy-to-use, open source, lightweight suite of Java projects built for one purpose: report generation. In this book, you will discover how easy it is to embed Pentaho Reporting into your Java projects, or use it as a standalone reporting platform. Pentaho Reporting's open source license—the GNU Lesser General Public License (LGPL)—gives developers the freedom to embed Pentaho Reporting into their open source and proprietary applications at no cost. An active community participates in the development and use of Pentaho Reporting, answering forum questions, fixing bugs, and implementing new features. While many proprietary reporting options are available, none can offer the openness and flexibility that Pentaho Reporting provides its users with.
As with most successful open source projects, Pentaho Reporting has a proven track record, along with a long list of features. Most of this history has been documented in open forums and in email threads, which are still available for folks to browse through and glean ideas from. Starting as a side hobby and turning into an enterprise reporting suite over the course of many years, the Pentaho Reporting Engine and its suite of tools, such as the Report Designer, Reporting Engine, and Reporting SDK, are used as critical components in countless corporate, educational, governmental, and community-based information technology solutions.
In most business software applications, a reporting component is necessary, be it for summarizing data, generating large numbers of customized documents, or simply for making it easier to print information that would be useful in various output formats. With a complete set of features, including PDF, Microsoft Excel, HTML, Text, XML, CSV, and RTF report generation, along with advanced reporting capabilities such as subreports and cross tabs, Pentaho Reporting can crack the simplest of problems quickly, along with solving the more advanced challenges when designing, generating, and deploying reports.
Read on in this chapter to learn more about Pentaho Reporting, its typical uses, history, and origins, along with a more detailed overview of the reporting
In this chapter, you will cover the following topics:
Introduction to Pentaho Reporting Typical uses of Pentaho Reporting Pentaho Reporting history
Introducing Pentaho Reporting
As introduced, Pentaho Reporting is an easy-to-use, open source, lightweight suite of Java projects, built to let the report developer be able to create pixel-perfect reports of his/her data in PDF, Microsoft Excel, HTML, Text, RTF, XML, and CSV formats. These computer generated reports easily refine data from various sources into a human readable form, and can be accessed via an integrated web viewer, saved as files and sent by email to a predefined list of recipients. It is also possible to generate reports as part of a Pentaho Data Integration transformation, to distribute the generated files according to more complex business rules (http://community.pentaho.com/projects/reporting).
Pentaho Data Integration transformations are used to describe the data flows in a process, such as reading from a source,
transforming data, and loading it into a target location. You will learn more in Chapter 16, Using Reports in Pentaho Data
Integration.
As it renders such high performance, consuming, considerably low amount of memory, the report processing can tower from small footprint embedded scenarios to large-scale enterprise reporting scenarios. Pentaho Reporting integrates perfectly with the Business Analytics Platform and allows you to share reports with coworkers and peers.
Pentaho Reporting styling is flexible and it permits the report designer to choose the granularity at which they desire to manipulate the entire user interface, right down to the minute details like the font styling on individual characters. In
Introducing Pentaho Reporting tools
Pentaho Reporting can be defined as a suite of open source tools and can be described as being composed of the following:Report Designer: This is a desktop application providing a design, develop, and test environment to enable the knowledge worker to easily create simple as well as complex reports. The tool is designed to be used by experienced and power users, who are familiar with few technical concepts.
Reporting Engine: This engine is born as an evolution of the JFreeReport project, a free Java class library for creating reports. The library can be used in both client-side (Report Designer, for example) and server-side
applications (web applications, for example).
Reporting SDK: This is a packaging of several resources (the engine, some documentation, and all the libraries required to embed the Pentaho
Reporting Engine into your application), to be a valid support for all the developers, particularly, for all the Java developers.
Types of users and required
knowledge
Pentaho Reporting is designed and developed to make life easier for report designers, with less limitations on flexibility and the ability to develop
sophisticated and rich reports. For this reason, the Report Designer can be used by developers (not necessarily Java developers) but also by information
technologists with a basic knowledge of databases and technical concepts.
For advanced development, especially using the Reporting SDK, technical skills on Java development are required, and you must be familiar with importing JARs into a project and be comfortable reading inline comments in code, to figure out advanced functionality on your own.
Technological advantages
Pentaho Reporting offers the following unique functionalities, not found in competing embeddable solutions:
Requires a Java runtime environment, not necessarily a JDK. Even if you need a JDK installed on your development environment, you do not need a JDK to run an application that embeds the Pentaho Reporting Engine. Only a Java runtime environment is required.
Potentially backwards compatible. In theory, Pentaho Reporting can run use dated versions of the Java virtual machine. Pentaho highly suggests to use JRE 1.8.0, but it is possible to use the Reporting Engine in older JRE versions (few integrations would be required).
All Processing is done in memory. All the processing, calculations, and algorithms are designed and developed to run in memory only, without the use of temporary files, tables, or any sort of memory mass usage.
Low memory requirement. An application based on Pentaho Reporting can run with only 64 MB of memory, even though 128 MB would
dramatically increase the report processing speed.
Dynamically library loading. Pentaho Reporting Engine is able to detect JAR libraries at runtime. By adding new JARs or removing the existing ones, you can expand the engine's capabilities or remove unnecessary libraries to reduce your application's memory and disk space usage.
Parameterization at runtime. All the report elements, and we can say the same for styling, functions, and queries, are completely customizable through parameters passed to the Reporting Engine at run time.
OpenFormula standard. OpenFormula is an open standard that will be introduced in the next chapters. You will be able to create your own custom formulas or customize the existing ones using a known standard.
A business friendly open source
license
One very attractive feature of Pentaho Reporting is its license. Pentaho
Operational reporting
One of the most commonly used forms of reporting is operational reporting. When a developer or an IT organization decides to generate reports directly from their operational data sources for the purpose of detailed transaction level
reporting, it is referred to as operational reporting. In this scenario, the database is designed to solve an operational problem, and usually contains live data supporting critical business functions. Users of Pentaho Reporting can point directly to this data source and start generating reports.
Some examples of operational reporting include building custom reports directly based on a third-party software vendor's database schema. These reports might include summaries of daily activity, or detailed views into a particular project or users in the system. Reports might also be generated from data originating from an in-house custom application. These reports are typically based on an SQL backend, but could be generated from flat log files or directly from in-memory Java objects.
Pentaho Reporting's parameterization capabilities provide a powerful mechanism to render up-to-the-minute customized operational reports. With features such as cross tabs and interactive reporting, business users can quickly view their
operational data and drill back into operational systems that might require attention.
However, there are limitations when developing reports based on live
operational data. Developers need to be careful to make sure that queries in the operational system do not impact the performance of regular operations. An extreme CPU-intensive query could delay a transaction from taking place. Also, certain historical questions, for example, state transitions or changes to particular informational fields such as address, aren't traditionally captured in an
Business intelligence reporting
When you've reached the limits of operational reporting, the next logical step is to move your data into a data warehouse. This move is often referred to as business intelligence reporting. Reporting alone does not provide the necessary tools to make this transition. You will need an Extract, Transform, Load
(ETL) tool, such as Pentaho Data Integration, along with a sensible warehouse design, such as a snowflake schema.
A snowflake schema is a logical arrangement of tables in a multidimensional database, such that the entity relationship diagram resembles a snowflake shape. A multidimensional
database is defined as "a variation of the relational model that uses multidimensional structures to organize data and express the
relationships between data".
This type of use allows business users to monitor changes over time. It also helps gain performance benefits by pre-calculating aggregations and defining schemas that are built in mind for summarized reporting. Until recently, data warehousing and business intelligence had been limited to large enterprises due to the cost of software and limited expertise. With open source tools becoming more widely available, a large number of small and medium size businesses are deploying data warehouses in order to get solutions for the critical questions in their business domain. Common examples of data warehouse reporting include combining sales and inventory data into a single location for reporting, or combining internal proprietary sales data with publicly available market trends and analysis.
Pentaho Reporting's flexible data source support makes it easy to incorporate reports in your business intelligence solutions. Also, with Pentaho Reporting's speed and scalability, you can deploy Pentaho Reporting with the confidence that reports will be executed efficiently.
Financial reporting
The financial reporting is a very specific, but very common, form of reporting, geared towards generating financial summaries for accountants, managers, and business investors. Standard reports that fall into this category include balance sheets, income statements, retained earning statements, and cash flow
statements. Unlike business intelligence or operational reporting, many of these reports are required by law, with regulations around their content and
presentation. Financial reports often include computations for assets, liabilities, revenues, and expenses.
With features such as group summary aggregations, Pentaho Reporting makes it very easy for developers to implement custom financial reports that business managers and owners require.
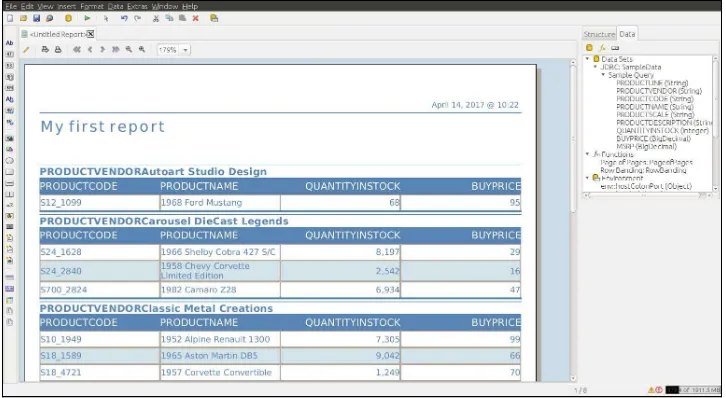
Production reporting
Another typical use of Pentaho Reporting includes production reporting. This type of reporting includes reports such as customized form letter, invoice, or postcard for a large audience, as well as automated mail merging. Normally, batch processing is involved in this form of reporting. However, custom reports based on a standard template, generated for individuals, can also fall under this category.
The following is a screenshot that presents such a report:
Pentaho Reporting history
Pentaho Reporting began as JFreeReport, a Java-based Reporting Engine and Swing widget, back in 2002. David Gilbert, author of JFreeChart, implemented the initial version of JFreeReport to address report rendering needs. Soon after launching the project, Thomas Morgner became the primary developer. He added critical functionalities, such as report functions and XML report
definitions, launching JFreeReport into a successful open source Java project.
Since the beginning, Pentaho Reporting has been an international project. David was located in Hertfordshire, United Kingdom, and Thomas was located in Frankfurt, Germany. Many others from all over the world have contributed translations and code to Pentaho Reporting.
From 2002 to 2006, Thomas continued to develop JFreeReport into an
enterprise-worthy Reporting Engine. While working as a consultant, Thomas added support for a variety of outputs, including Excel and RTF. At the
beginning of 2006, Thomas and JFreeReport joined Pentaho, an open source business intelligence company, and JFreeReport officially became Pentaho Reporting. At this time, Thomas transitioned from a full-time consultant to a full-time developer on the Pentaho Reporting Engine and suite of tools.
In January 2006, along with the acquisition of Pentaho Reporting, Pentaho announced the general availability of the Pentaho Report Design Wizard, which walks business users through a set of simple instructions for building
sophisticated template-based reports. Mike D'Amour, a senior engineer at Pentaho, was the initial author of this wizard, which is now used in many Pentaho applications.
Another important milestone in Pentaho Reporting's history was the introduction of Pentaho Report Designer. In 2006, Martin Schmid contributed the first
version of the Pentaho Report Designer to the community. Since its introduction, the Report Designer has evolved with the Reporting Engine.
In 2007, Pentaho teamed up with Sun's OpenOffice to deliver a reporting
Morgner, and is now known as the Pentaho Reporting Flow Engine. While this engine shares many of the concepts from the classic engine discussed in this book, it is a separate project with dramatically different features and
functionalities than Pentaho's classic reporting project.
Beginning in Pentaho Business Intelligence Platform release 1.6, Pentaho
Reporting also tightly integrates with Pentaho's Metadata Engine, allowing easy-to-use web-based ad hoc reporting by business users who may not have SQL expertise, data driven formatting in reports, as well as column and row level data security. The same functionality is available inside Pentaho Report Designer for query and report building, allowing business users to go from a quick template-based report to a full-fledged custom report.
Feature overview
In this quick introduction to the various features available in Pentaho Reporting 8, you'll have an executive summary of how Pentaho Reporting works and what it can accomplish for your reporting needs. The topics that will follow are
An advanced reporting algorithm
The reporting algorithm is at the heart of Pentaho Reporting. This algorithm manages the layout and rendering of the entire report, no matter which output format is being rendered. This algorithm combines a reporting template and a dataset on the fly, in order to generate the final report. There is no unnecessary compilation step. All other Pentaho Reporting features can be described in the context of the overall reporting algorithm.This algorithm allows reports to render with a page header and footer, a report header and footer, group headers and footers, as well as a details band. The reporting algorithm traverses the dataset multiple times to render the report. In the first pass, the algorithm performs calculations and determines how to
A multitude of available data sources
Pentaho Reporting defines a standard Java API for accessing data. Many data source implementations are made available with Pentaho Reporting. The most commonly used implementations include JDBC and JNDI database connectivity, XML XPATH capability, and multidimensional OLAP data access using MDX and MongoDB NoSQL database support.Java Naming and Directory Interface (JNDI) is a Java API for a directory service that allows Java software clients to discover and look up data and objects via a logical name, decoupling the
implementation from the configuration and settings.
Online Analytical Processing (OLAP) is an approach to answering multidimensional analytical queries swiftly in computing. Multidimensional Expressions (MDX) is a query language for OLAP databases. Much like SQL it is a query language for relational databases.
Additional data sources that are available include a Pentaho Data Integration data source, a Hibernate Query Language (HQL) data source, a Pentaho Metadata data source, a scripting data source (in JavaScript, Python, TCL, Groovy, and BeanShell), a simple table defined as a static list of rows and columns, and other advanced data sources (OpenERP data access, community data access, and sequence generator).
Using Pentaho's Data Integration data source, it is easy to use Excel, logs, or other file formats as inputs to a report, without the need to write any code. All these data sources interact with the Reporting Engine through a standard API, which is easy to extend.
By combining Pentaho Reporting's data source functionality with Pentaho's Data Integration Engine, most known data formats and systems are available for
A wide variety of output formats
Pentaho Reporting has the ability to render to the most widely used output formats, including Adobe's PDF standard using the iText library, Microsoft's Excel standard using the POI library, and HTML, all highlighted in the following screenshot. Other available formats include XML, plain text, RTF, and CSV. In addition to these output formats, a Pentaho report can be rendered in Swing and directly printed using PostScript formatting, allowing print previewingcapabilities.
Pixel accurate rich formatting
Reports defined in Pentaho Reporting can specify at the pixel level where objects such as text or images should render. Using Pentaho Report Designer, it is easy to align fields and group items that need to stay aligned. While not
always possible due to different format types, such as XML, CSV, and plain text, the three main graphical outputs, HTML, PDF, and Excel, strive to look as
similar as possible.
Rich formatting includes the TrueType system font selection, the ability to render
geometrical shapes and lines, along with the ability to include images and other objects in a report. This rich formatting is specified under the covers through styles similar to CSS, separating out the format from the report detail. This
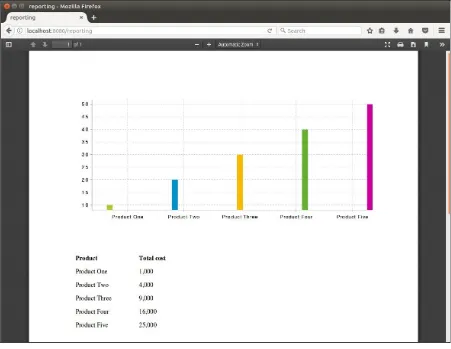
Embedded charts
The Pentaho Reporting Engine and suite of tools make it easy to embed charts in reports, originally developed using the JFreeChart Engine. Many chart types are available, including bar, histogram, pie, and line charts, as shown in the
Report parameterization
Pentaho Reporting provides easy-to-use tools to parameterize a report, allowing users to specify ranges and other values to customize the output of a report. Parameter values can be selected from a list of hardcoded values or driven from a query. With parameterization, end users may control the amount of information that is displayed on a report. The following screenshot is an example of
Formulas and style expressions
Subreports
Pentaho Reporting allows report developers to include subreports within a master report. This provides a powerful capability, which allows reports to contain different smaller reports, both side-by-side and within the various bands of a report. These subreports may be based on different data sources. The
following screenshot is an example of a report that includes a separate chart
Cross tab reports
Interactive reporting
While most reports are static after being rendered, a subset of reporting includes functionalities such as drill through, pivoting, and other interactivity. Pentaho Reporting provides a straightforward Java and JavaScript API for manipulating a report after it has been rendered, allowing report builders to create very
interactive reports. Pentaho Reporting's interactive functionality is available when rendering a report in HTML, Excel, or Swing. Links to external documents can also be added to PDF documents.
Rich authoring tools
Reporting server
As part of the Pentaho suite, reports created by Pentaho Reporting may be published, executed, and scheduled on Pentaho's Analytics Platform. The
Java API for building reports
Pentaho Reporting comes with a well-documented Java API for building reports from the ground up, so developers can stick with the Java programming
Extensibility
Pentaho reporting website
In addition to these features, Pentaho Reporting is in active development. Visit htt p://community.pentaho.com/projects/reporting/ to learn more about what additional features
Pentaho Reporting architecture
Pentaho Reporting Engine is mainly a Java class library, broken up into other Java projects, which are then combined to render reports. The library is
optimized for performance and a small memory footprint, and can run
completely in memory without generating temporary files or requiring extra compilation steps. The source code is available, under the terms of the GNU LGPL Version 2.1, in the GitHub repository https://github.com/pentaho/pentaho-reporting.
The GitHub repository includes the Pentaho Report Designer, providing a
graphical editor for report definitions and used as a standalone desktop reporting tool. In addition, there are also other related open source tools and projects in the Pentaho Reporting landscape, including the Report Engine Demo, Report Design Wizard, Report Designer, and the web-based ad hoc reporting user interface.
The following is an introduction of the Java project defining the Pentaho
Reporting Engine's libraries
The Pentaho Reporting Engine uses the following libraries to render reports:
Flute: This is a CSS 2 parser written in Java that implements SAC (https://ww w.w3.org/Style/CSS/SAC/). SAC is a standard event-based API for CSS parsers,
closely modeled on the SAX API for XML parsers.
LibBase: This is the root library for all other Pentaho Reporting libraries. This library contains common capabilities, such as debug and error logging utilities, library configuration, along with library initialization APIs, for consistent startup and shutdown management of the Reporting Engine.
LibDocBundle: This abstracts the management of Pentaho Reporting file bundles, which are by default stored as ZIP files, and implements the ODF. This makes it simpler for other parts of the Reporting Engine to work with and manipulate Pentaho Reporting's file formats.
LibFonts: This allows Pentaho Reporting to work with TrueType system fonts, extracting the necessary metadata from font types and populating an abstract interface to allow appropriate rendering in various contexts,
including PDF and Excel views.
LibFormat: This is a string formatting library, which can render dates and numbers appropriately, based on format strings. This library is focused on memory and CPU efficiency for high performance report rendering.
LibFormula: This is a formula parsing and execution library based on the OpenFormula standard. You can learn more about OpenFormula by visiting
http://wiki.oasis-open.org/office/About_OpenFormula. This library is similar in function
to Excel-based formula definitions. LibFormula is a very general library and is used outside Pentaho Reporting in other projects that require OpenFormula style parsing and execution. LibFormula-UI is a formula editor for OpenFormula expressions based on LibFormula.
LibLoader: This manages the loading and caching of all necessary resources required for generating reports in a generic way, providing a simple API for other parts of the Reporting Engine that control static and dynamic content, including data sources and images.
parsing of the XML file, and all client-side state managements.
LibPixie: This is a WMF-file reading library, originally written by David R. Harris as converter for the Pixie-image viewer. Pixie was long time dead and has now been resurrected as WMF-reader and image producer for Java 1.2.2 or higher. Pixie lacks the support for most bitmap-formats, but
everything else works fine.
LibRepository: This abstracts the input and output of hierarchical storage systems, such as file systems, that Pentaho Reporting interacts with. This makes it possible for a custom storage system, such as FTP, to be
implemented and to be mapped to the API, giving Pentaho Reporting access to the system.
LibSerializer: This provides helper methods for serializing non-serializable objects. This is necessary so that the Reporting Engine can serialize
standard Java classes that don't implement Java's serializable interface.
LibSparkline: This is a library developed to render sparkline graphs. Sparklines are small-scale bar or line charts that are inserted into text to provide visualized information along with the textual description.
LibSwing: This is a common helper class storage for design-time elements, so that they don't have to move into the engine project, where they
potentially bloat up the project due to third-party dependencies or a large amount of code.
LibXml: This provides utility classes for Simple API for XML (SAX) parsing and XML writing, based on Java's Java API for XML Parsing
Reporting Engine core
Reporting Engine extensions
The Reporting Engine extensions project contains third-party extensions to the Reporting Engine, which are very useful, but increase dependencies. Extensions in this project include JavaScript expression support using the Rhino project, a hibernate data source factory, bar code support using Barbecue, sparkline support using the LibSparkline, along with additional JDK 1.4 support for configuration and printing. Additional extension projects exist that include charting and many of the data sources discussed in this book.
The following are some links to the quoted projects for further details:
Rhino: https://developer.mozilla.org/en-US/docs/Mozilla/Projects/Rhino
Hibernate: http://hibernate.org
Summary
In this chapter, we introduced Pentaho Reporting and highlighted some typical uses, providing you with baseline ideas for implementing your own solutions. Typical uses for embedded reporting include operational, business intelligence, financial, and production reporting.
We briefly described the unique history of Pentaho Reporting, from its
JFreeReport roots, and also learned a great deal about the rich features included in the release 8.0. Core features include a wide variety of data source integration, along with PDF, HTML, and Excel rendering. On the other hand, more advanced features include subreports and cross tab reports. Additionally,
developer-oriented features, such as open Java APIs, along with the available source code and a business-friendly LGPL open source license, gives Pentaho Reporting a leg up on all other Java reporting toolkits.
The architecture of Pentaho Reporting is also covered in this chapter, providing developers with a twenty thousand foot view of where they might be able to modify or contribute to the Pentaho Reporting Engine, along with giving them the ultimate flexibility of access to source code.
You'll soon be able to apply the rich feature set of Pentaho Reporting to your use case.
Getting Started with Report Designer
After the introduction of Pentaho Reporting and an overview from twentythousand feet, in this chapter, you will start with a practical hands-on session, learning how to run Pentaho Report Designer for the very first time. In addition, you will take your first steps in creating a report with your preferred layout, using some initial data as an example.
You will begin by setting up an environment for building reports. From there, you will walk through some initial details of the user interface, like menus, toolbars, report element palettes, report canvas tab panels, report explorer, element properties, and messages. After learning more about the user interface, you will walk through the creation of a report from scratch. At this stage, you will be using the easy wizard available in Pentaho Report Designer, to make the session more practical, you will see how to save your report in the filesystem. This will be useful to store it safely for the following sessions, according to your needs and use cases. Along the way, you will receive the first details on building a report and getting data into it, along with generating a preview and iterating between design and preview, for the best result.
Prerequisites of your environment
As described in Chapter 1, Introduction to Pentaho Reporting, Pentaho Reporting
is a suite of open source tools, including Report Designer, Reporting Engine, and Reporting SDK. All the preceding tools are written in pure Java, allowing any operating system that supports the Java runtime environment to run the
application. The latest version of Pentaho Reporting, the 8th, requires the use of JDK 8 or more recent version.
Pentaho Reporting tools are cross-platform applications and will run in Linux, Windows, macOS, and other Java supported environments. The Reporting Engine is backward compatible with previous versions of JDK, but it is always recommended to use the latest one.
As stated in the introduction, in this chapter we are going to focus our attention on Pentaho Report Designer. The discussion on Pentaho Reporting SDK will be covered in the next chapter. About Reporting Engine, it is used as core
component in the designer and the SDK, so it will be treated during the description of the other two tools.
Talking about the Pentaho Report Designer, the only prerequisite your
environment should have onboard is obviously Sun's JDK. To get started, visit htt p://java.sun.com and download the latest patch release of the Java SE development
kit 8. Once downloaded, you can easily install it in your environment, mainly unzipping and setting few variables accordingly to your operating system. We won't show more details here, because it is assumed it will be straightforward for you to find the most recent tutorial about this task by googling a little bit. To verify your installation, run java –version on the command line and, if correctly
Setting up the Pentaho Report
Designer
As you can expect, the first task for our goal is to download Pentaho Report Designer from the correct website. The distribution packages are available in a couple of places: on the SourceForge website (https://sourceforge.net/projects/pentaho)
and directly on the official Pentaho website (http://community.pentaho.com/projects/reportin g). In every case, the distribution packages are free for downloading and no fee
or costs should be asked.
If you choose to download Pentaho Report Designer from the official Pentaho website, an automatic redirect will send you to the SourceForge website. To find the right distribution in the SourceForge website, follow the Report Designer folder
in the Files repository. There you will find one subfolder for each version.
Choose the latest available, in our case version 8.0.
In the distribution folder, you can find three packages available (let's ignore the
.sum files containing checksum strings only). The first two packages, prd-ce-mac-*.zip and prd-ce-*.zip, contain the binary distribution for macOS and
Windows/Linux operating systems. The third package, pre-classic-sdk-*.zip,
contains the Reporting SDK.
Once you have downloaded the binary distribution of the Pentaho Report Designer, create a directory in your machine and, inside that, unzip the content of the package. Once the content is unzipped, you will find a script named report-designer in the main directory.
Of course, if you are working with a Windows-based operating system, run the report-designer.bat script. If you are working with a
Linux-based operating system, run the report-designer.sh script. If
you are on macOS, find the Pentaho Report Designer in your finder and double-click directly on the application.
At this point, you may want to create a shortcut to your desktop or something that will make the run easier. In any case, congratulations, you have successfully installed Pentaho Report Designer!
Pentaho Report Designer, by default, comes packaged with the core Pentaho Reporting Engine libraries, so you now have the necessary reporting components to complete the examples described in this book.
If you have experienced difficulties installing Pentaho Report Designer, there are some common troubleshooting issues that you will want to verify. The most common issue is related to the Java virtual machine and SDK that you have installed. The report-designer script uses the first Java command found on the
system path. Therefore, you will want to verify that your path is configured correctly. You can do this by executing the command java -version in a command
The SamplaData schema
Together with the distribution package, the installation of Pentaho Report
Designer comes with a database schema called SampleData. The SampleData schema
contains a complete set of tables and data, to be used in your tests and training in general. In this book, you are going to use this database in all of the exercises. You will see for yourself that SampleData is a great starting point for every
common need around reporting.
Nothing has to be done to setup and use the SampleData schema. Pentaho Report
Designer comes with the HyperSQL RDBMS onboard and it is a natural choice considering that HyperSQL is an engine completely written in Java and does not require any installation or complex task to make it work.
If you want more information about HyperSQL RDBMS, you can check the huge quantity of documentation and tutorials available on the web or directly in the official website (http://hsqldb.org).
As you probably know, a HyperSQL database is contained in a bunch of files, all stored in a unique folder of the filesystem. In case of SampleData, you can find it on
the <report-designer>/resources/sampledata path.
Database apart, Pentaho Report Designer contains bundled a data source connected to the SampleData schema. We will see in detail what a data source is
and how a data source is used in your reports, but for now, it's enough for you to know that you can easily have access to it from inside the Pentaho Report
Designer, immediately and automatically after a correct installation.
To complete the introduction of the SampleData schema, let's take a look at the list
initial tests and experiments, as follows:
We won't see more than this the SampleData schema, but this introduction has been
Introduction to the user interface
Now that you have Pentaho Report Designer installed in your environment and you know how to launch it, let's move another step forward, introducing the user interface. After launching the Pentaho Report Designer, you will notice the following six main graphical components. All together, the components work with the unique goal to create the report. From the top left to the bottom right of the window, you can recognize:
The menu and toolbar, where you can request the execution of all the possible actions on reports
The report element palette, where you can select report elements for your report
The report canvas tab panel, which displays your report
The report explorer panel, with the Structure and Data tabs, displaying the entire report in object tree form
The element properties panel, displaying all the styles and attributes associated with the currently selected report element
The messages panel, displaying warnings and errors related to the currently opened report
Considering that the components should be managed with high confidence to have great results, following are their brief descriptions, to ensure you
Menu and toolbar
Report element palette
The report element palette panel is located on the left side of the Pentaho Report Designer and contains an icon list of the types of elements that can be placed on the report. The report element palette includes labels, shapes, fields, charts, subreports, and a lot of interesting and useful basic elements that you can use to develop your reports exactly as you (or your customers) want.
Report canvas tab
The report canvas tab panel is located in the center of the Pentaho Report
Designer and it is sort of a preview of your final result. Once you have created a new report or opened an existing one, this is where you drag and drop the
elements to build your preferred layout.
In design mode, the canvas displays some so-called report bands (we will see in detail in the next chapters what report bands are and what they do). The canvas offers many visual features that allow you to manage the alignment and sizing of your report elements. This is the place where the magic happens and you will be able to move, adjust, and tune the report to be exactly what you (or your
customers) want. In addition to the design canvas, you can also preview the current report directly in this panel.
Report explorer
The report explorer, located on the right side of the Pentaho Report Designer, includes the Structure tab panel and the Data tab panel. The Structure tab panel contains the tree structure of the report, including all the report bands. The Data tab panel contains all the data sources, functions, and parameters of your report. On right-clicking various portions of the structure and data trees, the interface shows a lot of possible options, such as adding new data sources and subgroups. The report explorer may be hidden through the window application menu.
Together with the canvas tab and the element properties, it is one of the most powerful components of the Pentaho Report Designer.
Element properties
The element properties panel is located following the report explorer panel, on the right side of the Pentaho Report Designer, and displays the details of the currently selected item in the report explorer or canvas. All styles and attributes, which are editable, appear in this panel. Many editable properties provide
additional dialogs for advanced editing capabilities. The report explorer may be hidden through the window application menu. Together with the canvas tab and the report explorer, it is one of the most powerful components of the Pentaho Report Designer.