Factors That Influence the Value of Companies Listed In Jakarta Islamic
Index (JII) in 2013-2016
Beta Asteriaa a
STIE Widya Wiwaha, Yogyakarta, Indonesia Corresponding e-mail: [email protected]
Abstract: The objectives of this study is to examine the effect of the size of the Board of Commissioners, the size of the Board of Directors and the Return on Assets (ROA) on the Company Value Listed in Jakarta Islamic Index (JII) in 2013-2016. The data was obtained from the financial statements published by the Indonesia Stock Exchange and the annual report of the company. The data was collected by using purposive sampling method. The study used panel data, which is a combination of time series and cross section data. The study used multiple linear regressions. The result of the research showed that the independent variable that has significant influence to the company value were Board of Directors variable and Return On Asset (ROA) at significance level of 5%, while the Size of Board of Commissioner has no significant effect to the value of the companies listed in JII. Research also proved that the size of Board of Directors, the size of Board of Commissioner and the size of Return On Asset (ROA) simultaneously influence to the value of the companies listed in JII in 2013-2016 in significant way.
Keywords: Size of Board of Commissioners, size of the Board of Directors, Return on Assets (ROA), Company Value
1. INTRODUCTION
The company's goal is to earn a profit. The goal in the long run is to increase the value of the company. According to Husnan and Pujiastuti (2006) the value of the firm is the available price paid by the prospective buyer if the company is sold. For companies that go public, the stock price traded on the stock exchange is an indicator of corporate value. Company certainly wants a high corporate value because it also indirectly shows the prosperity of shareholders is also high. Agent or management is more concerned with personal interests and not in accordance with the company's goal of
management that lasted for a long time and undetected. GCG mechanisms proxied by the size of the board of
commissioners, independent
commissioners, the size of the board of directors, and the audit committee affect the value of the company. In this study Good Corporate Governance is represented by the size of the board of commissioners and the size of the board of directors.
Maximizing company value is very important it also means maximize shareholders wealth as main objective of firm. Firm value is reflected in stock prices that steady and increase. High stock price makes firm high valued and affect on market confidence toward current firm performance and outlook for future firm. Firm value becomes something very important in investment decision (Putu et al : 2014). Price Ernings Ratio (PER), Price to Book Value Ratio (PBV), Tobin’s Q and Price sales ratio are some of the widely used ratios to determine the value of a company (Purwanto and Agustin : 2017). In this reasearch used PBV as proxied of Company Value. According to Husnan and Pujiastuti (2006), Price to Book
Value (PBV)
is a comparison between market price and book value of shares. For well-run companies, this ratio generally goes above one, indicating that the stock market value is greater than the book value. The larger the PBV ratio the higher the company is judged by the relative investors compared to the funds already invested in the company. Purwohandoko (2017) Price-book value (PBV) shows the level of the company’s
ability to create value relative to the amount of capital invested. the higher PBV means that the company has a higher stock price compared to the book value per share. The higher the stock price, the more successful companies create value for shareholders. When the company is able to creates value, it certainly gives hope to shareholders in the form of greater profit. Factors affecting the value of the company have been done by previous researchers and still find the research gap.
The Board of commissioners is focused on the monitoring function of the director’s policy implementation. The role of commissioners is expected to minimize the agency problems that arise between the board of directors and shareholders. Commissioners, therefore, should be able to oversee the company's financial information processs (Rachman: 2014). Suhartanti and Asyik (2014) prove that The board of commissioners influence positive significanlyt on company value. While Susanti and Nidar (2016), prove that the boards of commissioners has a negative and significant effect toward firm value. Contrary with Wahyudi (2010) and Gusni (2016) which proves that the board of commissioners not influence the value of the company.
composition of the board of directors shall be such as to enable effective, timely and prompt decision-making, and to act independently (KNKG: 2006). Susanti and Nidar (2016) proving that the board of directors has a positive and significant effect toward the firm value. But Nguyen and Faff (2007) found that there is no significant relationship between firm market value and board size.
According to Putu et al (2014), Firm Profitability is a firm's ability to generate net income from activities performed in an accounting period. Profitability can become an important consideration for investors in their investment decisions. Larger dividend payout will save capital costs. On other hand, managers (insider) increase power to increase its stake due to receipt of dividends as a result of high profits. An high profits offer is expected to attract investors to invest. So the higher profitability the higher company value. Putu et al (2014), Safitri et all (2014), also Marsha and Murtaqi (2017) proved that profitability has positive effect on firm value. Opposite with result research doing by Suhendra (2015) find that ROA has no influence on company value. The objectives of this research is to examine the effect of the size of the Board of Commissioners, the size of the Board of Directors and the Return on Assets (ROA) on the Company Value in partial and simultaneous.
2. LITERATUR REVIEW
The size of the board of commissioners
The basic principles of the board of commissioners are as corporate organs
that have the duty and responsibility to supervise and advise the board of directors. And ensure the company in the implementation of GCG. However, the board of commissioners can not participate in operational decisions. In order to execute the duties of the board of commissioners effectively: 1) The composition of the board of commissioners shall enable the decision making effectively and promptly, and may act independently; 2) Members of the board of commissioners must act professionally with integrity and ability to carry out their functions properly, as well as taking into account the stakeholders and 3) The supervisory and advisory functions of the board of commissioners shall include prevention, improvement to temporary dismissal (KNKG: 2006).
According to Marini and Marina (2017) The size of the board of commissioners is equal to the number of members of the board of commissioners. The board of commissioners influence positive significanlyt on company value (Suhartanti and Asyik : 2014).
The size of the board of directors
the following principles: 1) The composition of the board of directors shall be such as to enable effective, timely and prompt decision making, and may act independently; 2) The Board of Directors shall be professional in their integrity and have the necessary experience and skills in performing their duties; 3) The Board of Directors shall be responsible for the management of the company in order to obtain profits and ensure the sustainability of the company's business; and 4) The Board of Directors shall be responsible for its stewardship in the General Meeting of Shareholders in accordance with the prevailing laws and regulations.
Board of directors measure by the total number of board directors (Basyith, Fauzi and Idris :2015). The board of directors has a positive and significant effect toward the firm value (Susanti and Nidar : 2016)
Return On Asset (ROA)
Pofitability is one of the important indicators for investors to assess the prospects of the company in the future. This indicator is very important to know the extent to which investment will be an investor at a company able to provide the return required by investors. Return On Asset (ROA) describes the company's ability to use its assets to generate profits (Tandelilin, 2010). An high profits offer is expected to attract investors to invest. So the higher profitability the higher company value. Putu et al (2014), Safitri et all (2014), also Marsha and Murtaqi (2017) proved that profitability has positive effect on firm value.
Previous Research
Suhartanti and Asyik (2014), this research goals to examine the influence of corporate governance mechanism which is proxy by managerial ownership, institutional ownership, and the number of commissioners which is moderated by financial performance to the firm value. Technique Analysis is multiple linear regression. It can be concluded indicate from the analysis that the financial performance has an impact on corporate
governance mechanism and
simultaneously it has positive and significant impact on the firm value. it means that the enhancement of company performance and the implementation of corporate governance mechanism. Thus, the trust of the investors will rise and it will be responded positively through the enhancement of the stock price of the company which can increase the firm value.
Putu et al (2014), this study purpose is to determine effect of social responsibility, Corporate Governance and Firm size on corporate Profitability and corporate value in Manufacturing Firm listed in IDX. This study analysis method is path analysis using Partial Least Square. Results research showed that Corporate Social Responsibility, Corporate Governance, and Firm size have positive effect on Profitability. Also research result proved that Corporate Social Responsibility, Corporate Governance, Firm size, and Profitability have positive effect on Firm value.
Furthermore, partially the board of commissioners has a negative and significant effect toward firm value. The board of directors has a positive and significant effect toward the firm value.
3. HYPOTHESIS
Hypothesis of this research as follow:
H1 = Size of the Board of
Commissioners have significant effect on Corporate Value
H2 = Size of the Board of Directors
have significant effect on Corporate Value
H3 = Profitability (ROA) has
significant effect on Corporate Value
H4 = Size of the Board of
Commissioners, Size of the Board of Directors and Profitability (ROA) have significant effect on the Company Value.
4. RESEARCH METHOD
Research data is secondary data. It’s published by Indonesia Stock Exchange (IDX). Sampling technique used in this research is purposive sampling. The sampling criteria are:
a. Companies Included in the Jakarta Islamic Index (JII) in 2013-2016.
b. Companies publish their financial statements from 2013-2016.
c. Companies has positive profitability (ROA) and positive company value (PBV).
There are 13 companies listed on Jakarta Islamic Index (JII)from 2013-2016. Based on purposive sampling technique there are 13 mining companies that meet the criteria. Companies code are:
No Company
Code Company Name
1 AALI Astra Agro Lestari Tbk 2 ADRO Adro Energy Tbk 3 AKRA AKR Coporindo Tbk 4 ASII Astra International Tbk 5 BSDE Bumi Serpong Damai
Tbk
6 ICBP Indofood CBP Sukses Makmur Tbk
7 INDF Indofood Sukses Makmur Tbk
8 INTP Indocement Tunggal Prakarsa Tbk
9 KLBF Kalbe Farma Tbk 10 LPKR Lippo Karawaci Tbk 11 LSIP London Sumatra Ind Tbk 12 PGAS Perusahaan Gas Negara
Tbk
13 SMGR Semen Indonesia Persero Tbk
Operational Definition of Research Variables
Company Value (PBV)
Value (PBV) is a comparison between market price and book value of shares.
Price Per Share PBV =
Book Value per Share
Size of the Board of Commissioners
According to Siallagan and Machfoed (2016), the size of the board of commissioners is the number of members of the board of commissioners within a company, set in the number of units. According to Marini and Marina (2017), Size of the Board of Commissioners = member of the board of commissioners.
Size of the Board of Directors
The size of the board of directors is the number of members of the board of directors within a company, specified in the number of units Siallagan and Machfoed (2016). According to Marini and Marina (2017), Size of the Board of Directors = member of the board of Directors.
Profitability (ROA)
Return on Assets (ROA) is one of the profitability ratios that measure the effectiveness of the company in generating profits by utilizing all assets owned. The formula for calculating Return on Assets (ROA) is as follows:
Earning After Interest and Tax
ROA =
Total Asset
Data analysis technique
The analytical technique used to determine the effect of the size of the Board of Commissioners, the size of the Board of Directors, the Profitability (ROA) on Company Value (PBV) of companies listed in the Jakarta Islamic Index (JII), is multiple linear regression. The multiple regression equation is as follows:
Where:
Y = Company Value
α = Constanta
β = coefficience regression
X1 = size of the board of commissioners
X2 = size of the board of directors X3 = Return On Asset
e = Error
Test t-Statistics (Partial)
This test is conducted to determine the influence of each independent variable in the model to independent variables. Therefore, the decision of significance is determined by looking at the probability of t-statistics of the regression results based on the required level of significance.
Test F Statistics (Simultaneous)
Test coefficient of determination (adjusted R2)
To find out how well large the proportion of the dependent variable is explained by the independent variable.
Data Analysis Methods Classic Assumptions Test
Data analysis method used is multiple regression analysis model using regression analysis methods in testing the hypothesis, first tested whether the model meets the assumptions of classical. The classical assumption test consists of normality test, multicolinearity test, heterocedasticity test, autocorrelation test and linearity test.
5. EMPIRICAL RESULT Classic assumption test.
The classic assumption test is performed before performing multiple regression analysis. The classical assumption test consists of: 1) Normality Test, 2) Multicollinearity Test, 3),
Heterokedasticity Test, 4),
Autometeration Test and 5) Linearity Test. Test the classical assumptions that have been done as follows:
Normality test
Normality test is done by Normal Test of P-P Standardized Regression Plot.
Based on the SPSS data generated
Normal P-P Plot Regression
Standardized as shown in the picture above. Test normality using P-P Plot of
regression Standard Residual. Based on the Normal view of P-P Standardized Plots Regression it is seen that the dots spread around the diagonal line. Because of its normal distribution (Ghozali, 2013).
Picture 1. Normality Test
Multicollinearity Test
According Ghozali (2013), this test aims to test whether the regression model found a correlation between independent variables. A good regression model should not have a correlation between independent variables. If the independent variables are correlated, the variables are not orthogonal. The orthogonal variable is an independent variable whose correlation value among the independent variables equals zero. Multicollinearity can be seen from the Variance Inflation Factor (VIF). The common cutoff value used to indicate the presence of multicollinearity is the VIF value ≥ 10.
Model VIF
Size of The Broad Commissioners 1.266 Size of The Broad Directors 1.291 Profitability (ROA) 1.085
VIF for Profitability (ROA) is 1.085. Since the VIF for each independent variable has a value <10. Then the model is declared free of multicollinearity.
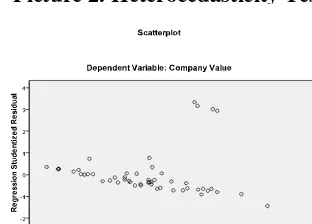
Heterocedasticity Test
According Ghozali (2013),
Heterokedastisitas test aims to test whether in the regression model there is a variance inequality of residual one observation to the other observation. If the variance of the residual one observation to the other observes
remains, then it is called
Homoskedasticity and the different jijka is called Heterocedasticity. A good regression model is Homocedasticity or Heterocedasticity does not occur. Based on SPSS results obtained Scatterplot output as follows:
Picture 2. Heterocedasticity Test
Based on the view on the scatterplot it appears that the plot spreads randomly above or below the zero on the axis of Regression Studentized Residual. Therefore, based on heterokedastisitas test using graph method, in the regression model that is formed otherwise there is no symptoms of heterokedastisitas (Ghozali: 2013).
Autocorrelation Test
According to (Suliyanto: 2011), this test aims to determine whether there is a correlation between members of a series of time series observation data (Time series) or space (cross section).
According Ghozali (2013),
autocorrelation test is done by Lagrange Multiplier method (LM Test). This test is done by:
a. Regress of Lag-1 of
Unstandardized Residual and other independent variables to dependent variable or with
equation: μ1 = a + b1X1 + b2X2 + b3X3 + μ1 + e.
b. Calculate the value of X2 count with the formula: X2 = (n-1) * R2.
c. Draw a conclusion by comparing count X2 with table X2 with df = (α, n-1). If counts X2 > table X2, this indicates an autocorrelation problem. Conversely if counts X2 ≤ table X2, it shows no autocorrelation problem.
SPSS output as follows:
Table 1. Autocorrelation Test
Model Summaryb
Model R R Square
Adjusted R Square
Std. Error of the Estimate
1 .732a .535 .495 4.81257
a. Predictors: (Constant), Ut_1, Size of
The Broad Commissioners,
Profitability, Size of The Broad Directors
b. Dependent Variable: Company Value
so X2 = (n-1) X R2 obtained X2 = (52-1) X 0.535 = 27.285. While value of table X2 with df = (0.05;51) = 68.669. Because count of X2 is 27.285 < table of X2 is 68.669. It can be concluded that the model is free from autocorrelation.
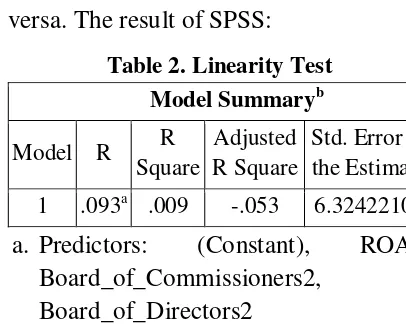
Linearity Test
Linearity testing needs to be done to know the research model is a linear model or not. The result of the linearity test is the information whether the empirical model should be linear, squared or cubic. According to Suliyanto (2011), the LM test is one of the methods used to measure linearity developed by Engle (1982). The principle of this method is to compare the value of X2 count (n x R2) with the value of X2 table
with df = (n, α). By way of squaring the
square of the independent variable to its residual value. As well as drawing the conclusion of linearity test with criteria if X2 count <X2 table with df = (n, α) then the model is declared linear and vice versa. The result of SPSS:
Table 2. Linearity Test
Model Summaryb
Model R R Square
Adjusted R Square
Std. Error of the Estimate
1 .093a .009 -.053 6.32422107
a. Predictors: (Constant), ROA2, Board_of_Commissioners2,
Board_of_Directors2
b. Dependent Variable: Unstandardized Residual
Based on the above results obtained coefficient of determination (R2) new equation of 0.009. So the value of X2 count = 52 X 0.009 = 0.489. While the value of X2 table with df (0.05, 52) =
69.833. Since the value of X2 count (0.468) <value of X2 table (69.832) it can be stated that the correct regression model is linear.
Regression Equation
Based on SPPS output obtained regression equation as follows:
Y = -5.544 – 0.815 X1 + 1.533 X2 + 0.433 X3 + e
The constant value is -5,544 meaning if the size of the board of commissioners (X1), The size of board of directors (X2) and profitability or ROA (X3) is zero, then the company value is -5.544. The regression coefficient of variable size of board of commissioner (X1) valued at -0.815 means that if other independent variables are fixed and the size of the board of commissioners increases by 1 person then the value of the firm decreases by 0.815. Coefficient of the size of board of directors (X2) valued at 1.533 means that if other independent variable value is fixed then the value of the company increased by 1.533. And the coefficient of Profitability or ROA (X3) valued at 0.433 means that if other independent variables fixed value and Profitability or ROA increased 1 then the value of the company will experience an increase of 0.433.
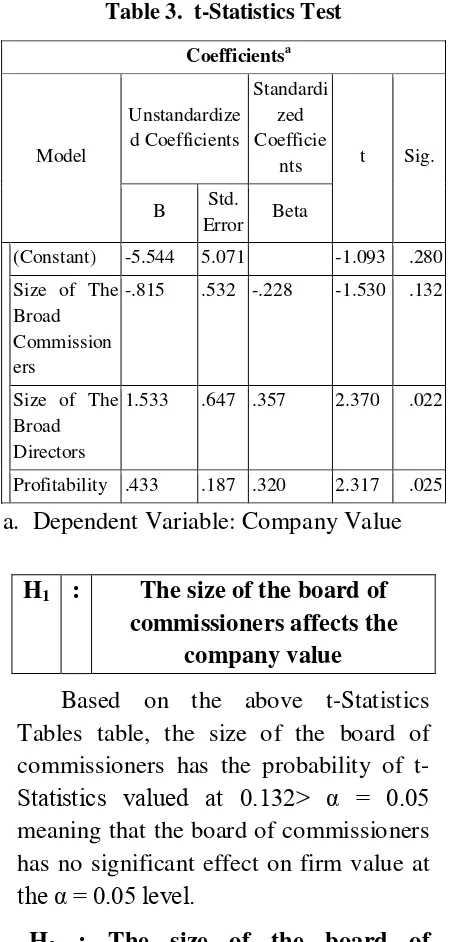
Test t-Statistics (Partial)
Table 3. t-Statistics Test
Coefficientsa
Model
Unstandardize d Coefficients
Standardi zed Coefficie
nts t Sig.
B Std.
Error Beta
(Constant) -5.544 5.071 -1.093 .280
Size of The Broad Commission ers
-.815 .532 -.228 -1.530 .132
Size of The Broad Directors
1.533 .647 .357 2.370 .022
Profitability .433 .187 .320 2.317 .025
a. Dependent Variable: Company Value
H1 : The size of the board of commissioners affects the
company value
Based on the above t-Statistics Tables table, the size of the board of commissioners has the probability of
t-Statistics valued at 0.132> α = 0.05
meaning that the board of commissioners has no significant effect on firm value at
the α = 0.05 level.
H2 : The size of the board of directors affects the company value
Based on the table t-Statistic Test above, the size of the board of directors has a probability t-Statistics valued at
0.022 <α = 0.05 means the board of
directors significantly influence the value
of the company at the level of α = 0.05.
H3 : Profitability (ROA) affect the company value
Based on the above t-Statistics table, profitability (ROA) has a t-statistic
probability of 0.022 <α = 0.05 meaning profitability (ROA) has significant effect
to firm value at α = 0.05.
Test F Statistics (Simultaneous)
Test F Statistics conducted to determine the effect of independent variables to the dependent variable simultaneously.
Table 4. Test. F-Statistics
ANOVAb
Model Sum of Squares Df
Mean Squar
e
F Sig.
Regression 357.350 3 119.1 17
2.95 2
042a
Residual 1936.580 48 40.34 5
Total 2293.930 51
a. Predictors: (Constant), Profitability, Size of The Broad Commissioners, Size of The Broad Directors
b. Dependent Variable: Company Value
H4 : Influence of board size, board size and profitability (ROA) on the value of the company.
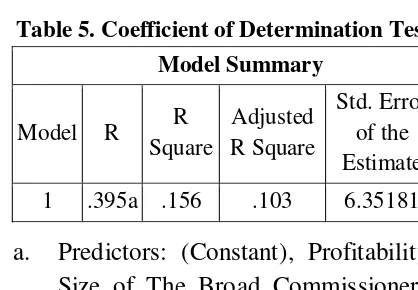
Test Coefficient of Determination (Adjusted R2)
Test the coefficient of determination to find out how much the proportion of variables explained by independent variables.
Table 5. Coefficient of Determination Test
Model Summary
Model R R Square
Adjusted R Square
Std. Error of the Estimate
1 .395a .156 .103 6.35181
a. Predictors: (Constant), Profitability, Size of The Broad Commissioners, Size of The Broad Directors
The results of the data show that the value of Adjusted R2 of 0.103 means that the size of the board of commissioners, board size and profitability (ROA) able to explain the variation of corporate value of 10.30 percent the remaining 89.70 percent explained by other variables outside the research model.
6. DISCUSSION
The results showed that partially significant effect on company value is the size of the board of directors and profitability (ROA). While the size of the board of commissioners has no significant effect on the value of the company. Simultaneously the variable size of the board of commissioners, the size of the board of directors and profitability (ROA) simultaneously affect the value of the Company. The explanation is as follows:
The effect of the size of the board of commissioners on company value
The results show that the size of the board of commissioners is negative not significant, in accordance with the research (Wahyudi: 2010). In accordance with Gusni research (2016) which proves that the board of commissioners not influence the value of the company. The number of boards of commissioners does not affect or increase the value of the company. Opposite with Suhartanti and Asyik (2014) prove that The board of commissioners influence positive significanlyt on company value. While Susanti and Nidar (2016), prove that the boards of commissioners has a negative and significant effect toward firm value.
The effect of the size of the board of directors on company value
The results showed that the size of the board of directors significantly influence the value of the company. The results of this study are in accordance with Marini and Marina (2017) also Susanti and Nidar (2016) studies which proves that the board of directors has a significant effect on company value. The results contradict the research of Nguyen and Faff (2007) which proves that there is no relationship between the market value of the company with board size. Contrary to Gusni's research (2016) which proves that the number of boards of directors has no effect on the value of the company.
company to the board of commissioners. In order for the execution of the duties of the board of directors to be effective, one of the principles that needs to be met is that the composition of the board of directors should be such as to enable effective, timely and prompt decision making, and to act independently. According to Marini and Marina (2017) Implementation of duties undertaken by the board of directors with good results will improve the performance of the company and will eventually increase the value of the company.
Effect of profitability (ROA) on corporate value
The results show that profitability (ROA) has a significant effect on firm value. Gusni (2016), Putu et al (2014), Safitri et al (2014), also Marsha and Murtaqi (2017) proved that profitability has a positive effect on firm value.
According to Putu et al (2014), Firm Profitability is a firm's ability to generate net income from activities performed in an accounting period. Profitability can become an important consideration for investors in their investment decisions. Larger dividend payout will save capital costs. On other hand, managers (insider) increase power to increase its stake due to receipt of dividends as a result of high profits. An high profits offer is expected to attract investors to invest. So the higher profitability the higher company value. Opposite with result research doing by Suhendra (2015) find that ROA has no influence on company value.
7. CONCLUSION
a. The number of Boards of Commissioners has no significant effect on the value of companies registered in the Jakarta Islamic Index (JII) in 2013-2016.
b. The number of Board of Directors has significant effect on the value of companies registered in Jakarta Islamic Index (JII) in 2013-2016. c. Profitability (ROA) has a
significant effect on the value of companies listed in the Jakarta Islamic Index (JII) in 2013-2016. d. The number of boards of
commissioners, the number of boards of directors and profitability (ROA) has a significant effect on the value of companies registered in the Jakarta Islamic Index (JII) in 2013-2016.
8. RECOMMENDATIONS FOR
FUTURE RESEARCH
variables based on previous research that proved to affect company value.
9. REFERENCES
Adestian, Yuda (2015). Pengaruh Dewan Komisaris, Dewan Direksi, Dewan Komisaris Independen, Komite Audit Dan Ukuran Perusahaan Pada
Kinerja Perusahaan
Perbankan Yang Listing Di BEI Pada Tahun 2012-2014. Skripsi. Fakultas Ekonomi & Bisnis. Universitas Dian Nusantoro.
Basyith, Abdul., Fitriya Fauzi and Muhammad Idris ( 2015), The Impact of Board Structure and Ownership Strructure on Firm Performce : An Evidence From Blue Chip Firms Listed In Indonesia Stock Exchange, Volume 12, Issue 4, Summer, Continued-3.
Husnan, Suad dan Enny Pudjiastuti. 2006. Dasar-Dasar Manajemen Keuangan. Edisi Kelima. UPP STIM YKPN : Yogyakarta.
Ghozali, Imam (2013), Aplikasi Analisis Multivariate Dengan Program IBM SPSS 21. Semarang: Badan Penerbit Universitas Diponegoro.
Gusni, Agnes Vinelda (2016), Prosiding dari Seminar Nasional dengan Tema Dinamika Global: Rebranding Keunggulan Kompetitif Berbasis
Kearifan Lokal ,Corporate
Governance, Profitability dan Nilai Perusahaan, Halaman 355-368.
Komite Nasional Kebijakan Governance (KNKG). 2006. Pedoman Umum
Good Corporate Governance
Indonesia. Indonesia : KNKG.
Susanti, Leni and Sulaeman Rahman Nidar (2016). Corporate Board And Firm Value: Perspective Two-Tier Board System In Indonesia. International Journal of Scientific & Technology Research Volume 5. Issue 05. May.
Marini, Yushita and Nisha Marina (2017), Pengaruh Good Corporate
Governance Terhadap Nilai
Perusahaan. Jurnal Humaniora, Volume 1, No 1, April.
Marsha, Nadya and Isrochmani Murtaqi (2017), “The Effect of Financial Ratios On Firm Value In The Food and Beverage Sector of The IDX”,
Journal of Business And
Management, Vol. 6, No.2, pp. 214-226
Nguyen, Hoa and Robert Faff (2007), Impact Of Board Size and Board Diversity On Firm Value: Australian Evidence, Corporate Ownership & Control, Volume 4, Issue 2, Winter 2006-2007.
Putu, Ni Nyoman G Martini., Moeljadi. Djumahir and Atim Djazuli (2014), Factors Affecting Firms Value of Indonesia Public Manufacturing Firms, International Journal of Business and Management Invention, Vol. 3, Issue 2, February, pp. 35-44.
Agricultural Firms Listed in the Indonesian Stock Exchange. International Journal of Economics and Finance; Vol. 9, No. 8.
Purwanto, P and Jillian Agustin (2017). “Financial Performance towards Value of Firms in Basic and Chemicals Industry”. European Research Studies Journal. Volume XX. Issue 2A. pp.443-460.
Rachman, Gun Gunawan (2014), The Effect Of Board Of Commissioners, Audit Committee, And Internal Auditor On Financial Reporting Quality Of Banks Listed On The
Indonesia Stock Exchange
International Journal of Economics, Commerce and Management. United Kingdom Vol. II. Issue 10. Oct.
Safitri, Okyana Nur., Siti Ragil Handayani, Nila Firdausi Nuzula (2014), “The Influence of Capital Structure And Profitability on Firm Value”, Jurnal Administasi Bisnis (JAB), Vol.13, No. 2, Agustus.
Suhartanti, Tutut and Nur Fadjrih Asyik
(2015), Pengaruh Corporate
Governance Terhadap Nilai
Perusahaan Dengan Kinerja
Keuangan Sebagai Variabel
Moderating, Jurnal Ilmu & Riset Akuntansi, Vol. 4, No.8.
Suhendra, Euphrasia Susy (2015),“The Influence of Intellectual Capital on Firm Value towards Manufacturing
Performance in Indonesia”,
International Conference on Eurasian Economies.
Salkon, Islam Fadzrin (2015), Pengaruh Ukuran Dewan Komisaris dan Komite Audit Terhadap Nilai
Perusahaan Pada Perusahaan
Pertambangan Yang Terdaftar di Bursa Efek Indonesia Periode 2009-2013, Tesis, Universitas Widyatama.
Siallagan, Hamonangan and Mas’ud
Machfoed (2016), Mekanisme
Corporate Governance, Kualitas Laba dan Nilai Perusahaan, Simposium Nasional Akuntansi 9 Padang.
Suliyanto (2011), Ekonometrika Terapan: Teori & Aplikasi dengan SPSS. Yogyakarta: Penerbit Andi.
Tandelilin, Eduardus (2010), Portofolio dan Investasi, Edisi Pertama, Yogyakarta : Penerbit Kanisius.
Wahyudi, Johan (2010), Pengaruh pengungkapan Good Corporate
Governance, Ukuran Dewan
Komisaris dan Tingkat Cross-Directorship Dewan terhadap Nilai.
Skripsi. Fakultas Ekonomi