Demand Response
Management in Power
Systems Using Particle
Swarm Optimization
Pedro Faria, Zita Vale, João Soares, and Judite Ferreira, Polytechnic of Porto
Price-based
demand response is
applied to electric
power systems.
Demand elasticity
and consumer
response enables
load reduction.
The methodology
is implemented in
the DemSi demand
response simulator.
Demand response (DR) has proven an effective approach for allocating electri-cal loads, gaining a competitive advantage, and providing significant benefits for elec-tricity market performance. DR programs can increase power consumption efficiency through active consumer participation, showing the value that each consumer attri-butes to his or her individualized additional demands.
Recent efforts aim to improve wholesale markets with more intensive use of DR. This includes, for example, the acceptance of de-mand bids and offers for ancillary services; the specification by the DR resources of the frequency, duration, and level of participa-tion in consumpparticipa-tion reducparticipa-tion; and the exis-tence of aggregators that bid into the market on behalf of customers.4
Fully leveraging all of the advantages of active consumer participation requires an infrastructure able to accommodate all cen-tralized and distributed energy resources. This approach corresponds to the practical
implementation of smart grids,5 which are
currently the focus of significant research efforts. In practice, DR programs imple-mentation is in an initial stage, using tech-nologies close to smart metering.
The available DR opportunities should be used in the best way to attain the involved agents’ goals. This entails time-consuming and complex optimization problems, requir-ing huge computational means. Traditional optimization methodologies are usually not able to cope with this type of problem for realistic cases. Researchers have used arti-ficial intelligence techniques to address sev-eral problems in the scope of power systems and electricity markets.6–7 Particle swarm
optimization (PSO)8–9 has been successfully
applied to power systems10 and is proposed
in this work to address DR management. This article presents a DR simulator (called DemSi) that we developed to simu-late the use of DR programs. DemSi uses Power Systems CAD (PSCAD; see https:// hvdc.ca/pscad) for network simulation and
C
ompetitive electricity markets have arisen as a result of power-
sector
restructuration and power-system deregulation. The players
participating in competitive electricity markets must define strategies and make
E M E R G E N C Y M A N A G E M E N T
provides users with optimized DR action management. The proposed methodology considers DR in terms of electricity price variation imposed by the distribution network operator in the presence of a reduction need for any reason, such as lack of gener-ation or high market prices. The pro-posed method is based on the use of real-time pricing. This price-responsive approach would help address the dif-ficulties in monthly fixed-remuner-ation programs, such as direct load control, and when the smart grid is at an initial implementation stage.
Demand Response Concepts and Programs
DR includes all intentional electricity-consumption pattern modifications by end users that alter timing, in-stantaneous-demand level, or total electricity consumption11 in response
to changes in electricity’s price over time. Further, we can also define DR as incentive payments designed to in-duce lower electricity use at times of high wholesale market prices or when system reliability is jeopardized.12
DR Benefits
An important advantage of DR im-plementation is the postponement of investments in generation resources and transmission and distribution lines. This is highly important when the generation is near its maximum capacity with exponentially increas-ing generation costs. In these condi-tions, a small reduction in load will cause a big reduction in generation costs and, therefore, a significant re-duction in the price of electricity.
Usually the actions that result from demand-side behavior or those in-tended to manage consumer behavior are referred to as DR, load manage-ment, and demand-side management. Traditionally, these measures are taken to encourage consumers to reduce
their electricity consumption during times of especially high demand13 and
usually occur through utility-load- management programs aiming es-sentially at obtaining peak reduction. Competitive electricity markets enable a wide set of new opportunities for more strategic consumer behavior and new models of DR.
Several studies have shown that loads aren’t rigid, exhibiting elasticity that can be used for the mutual ben-efit of power systems and consum-ers. Changes in electricity prices over time and incentive payments increase demand flexibility as users intention-ally modify their electricity consump-tion patterns in response to exterior stimulus. DR can be contracted over longer or shorter periods, either as a result of its inclusion in capacity markets or directly through bilateral contracts.
DR, including real-time pricing, can be used to optimize distribution-network operation, reduce incident consequences, and reduce wind cur-tailment.14 DR programs can be used
to both increase and decrease load demand. The use of DR to reduce load consumption in peak, congested, and/or incident periods helps distri-bution network operators by relieving the network components. In this way, important benefits can be achieved in terms of reliability and service qual-ity, cost minimization, and savings on network investments. In the case of incidents, the contracted load cur-tailment is expected to minimize the nonsupplied load’s monetary global value. Increases of wind-based elec-tricity generation systems and the wind’s intermittent nature often lead to periods of excess generated energy. This imposes relevant losses in wind curtailment, making wind farms less efficient and the corresponding in-vestment payback period higher. The use of DR programs to increase load
consumption in these periods helps to overcome this problem.
Measures and Programs
Price elasticity is a measure used in economics to evaluate the respon-siveness of the demanded quantity of a good or service to a change in its price, or the percentage change in quantity demanded in response to a one percent price change.15 In electric
loads, price elasticity is a normalized measure of the intensity of how usage of electricity changes when its price changes by one percent. In the oppo-site way, demand elasticity is a mea-sure of how price changes when usage of electricity changes.
Demand price elasticity can be evaluated using Equation 1, where
Quantity is the quantity of the us-age of the good or service and Price
is the price of this good or service.16 ∆Quantity and ∆Price refer to the quantity of usage and price variations between the periods before and after the implementation of DR programs.
ε =
We can divide DR programs into two general groups: price and incen-tive based.17 Price-based DR is related
to changes in energy consumption by customers in response to variation in the prices they pay. This group in-cludes three key pricing rates:
• Time-of-use pricing includes differ-ent prices for usage during differdiffer-ent periods, usually defined for periods of 24 hours. This rate reflects the average cost of generating and de-livering power during each period.
with a much higher peak pricing applied under specified conditions (for example, when system reliabil-ity is compromised or supply costs are high).
For different hours or time periods, if the price varies significantly, cus-tomers can respond with changes in energy use. Response to price-based DR programs is entirely voluntary.
Incentive-based DR includes pro-grams that give customers fixed or time-varying incentives and that com-plement their electricity rate. Utility companies, load-serving entities, or a regional grid operator can establish these approaches. Some of these pro-grams penalize customers who fail the contractual response when a pri-ori specified events are declared. This group includes programs such as di-rect load control, interruptible/curtail-able service, demand bidding/buyback, emergency DR, capacity market, and ancillary services market.
In other work, Lorna Greening ex-poses the expected responsibilities and functions of each player in a de-regulated electricity market.18
Green-ing states that larger participation is required for DR to be viable in the scope of electricity markets, and that this requires a more intensive collab-oration between regulators, market participants, and market and system operators.
Katherine Hamilton and Neel Gul-har propose a complex-bid, market-clearing mechanism that considers price-sensitive bids made by consum-ers.19 This work quantifies the effect
of the increasing participation of the demand-side on various categories
Direct load control is a DR model for which the utility is able to control customer equipment. This control has shown positive results, avoiding the use of additional generation. Imple-mented models have been applied to air conditioners and water heaters. However, some problems related to the functioning of switches installed by the utility have been reported. In the future, with further implementa-tion of the smart grid concept with two-way communication ability, it’s expected that utilities will have bet-ter control over the target equipment. This is important because incentive payments are usually paid monthly to customers as fixed rates.20 Although
this concept isn’t presently considered useful, utilities are planning to of-fer programs in which they give cus-tomers price signals through smart pricing programs. These signals are expected to give incentives to custom-ers to make their own investments in DR equipment.20
Problem Formulation and Resolution
The DR problem that we consider here is motivated by a need to reduce the energy supply to a set of con-sumers by a specified amount. This event is managed by a consumer ag-gregator, aiming at minimizing the global value paid by the consumers. To achieve this goal, the aggregator considers the individual consumers’ price elasticity, which relates demand reduction with price increase. Indi-vidual load reduction and price in-creases that minimize the consumers’ global cost are determined for each consumer.
The problem’s characteristics lead to a nonlinear model.
In practice, when a reduction in electricity consumption is needed, the aggregator, based on its knowl-edge about the consumers, raises the price of electricity with the expecta-tion that consumers will reduce their electricity use. The objective function can be expressed as shown in Equa-tion 2 and is subjected to several constraints. consumption of consumer c, ELoadRed(c) is energy consumption reduction of consumer c, PriceEnergyInitial(c) is ini-tial electricity price for consumer c, and PriceEnergyVar(c) is variation in con-sumer c electricity price. The objec-tive function in Equation 2 aims to minimize costs associated with elec-tricity consumption (that is, the to-tal amount consumers pay) when an overall demand reduction is required. We can calculate these costs based on the final load demand (initial load demand minus demand reduction value) and on the final price (initial price plus the price increment used to obtain the required consumption reduction).
E M E R G E N C Y M A N A G E M E N T
according to the extent in which they can and/or want to participate in the DR program and to their price elas-ticity. Power system operation re-quires the balance between load and generation to be guaranteed at all times (see Equation 5).
PLoadRed(c)≤MaxPLoadRed(c) (3)
PriceEnergyVar(c)≤MaxPriceEnergyVar(c) (4)
where MaxPLoadRed(c) is the maxi-mum permitted variation in power for consumer c; MaxPriceEnergyVar(c) is the maximum permitted variation in energy price for consumer c; PMain is power received from the main grid;
PReserve is reserve power; PLoad(c) is ini-tial power consumption of consumer c; and PLoadRed(c) is power consumption reduction of consumer c.
The consideration of load response is formulated based on elasticity val-ues (see Equation 6). Because the elasticity is a fixed and constant value for each load, the optimal relation between load and price variation is determined in the optimization. The present study considers the obliga-tion of having the same price varia-tion for the loads of the same type as expressed in Equation 7.
Elasticity( )c
= ×
×
P
P
c EnergyInitial c
Load c
LoadRed( ) Price ( ) ( ) PPriceEnergyVar c( )
(6)
PriceEnergyVar(c)
=PriceEnergyVar(T), ∀c ∈T, (7)
where Elasticity(c) is price elasticity for consumer c, and T is consumer type.
Particle Swarm Optimization The optimization of the formulated nonlinear problem consists of the minimization of a multimodal func-tion with many local minima and a global optimum. This is considered an NP-hard problem because the computational complexity is high even in simple cases.
In past decades, AI techniques have deployed a set of effective and efficient methods to mitigate the dif-ficulties of solving complex com-putational time problems. These algorithms explore a given search space and return the best solution found. PSO belongs to the category of swarm intelligence methods, and we use it in this work to solve the DR problem because it’s effective in dif-ficult optimization tasks such as non-linear problems.21 We describe the
algorithm as follows:
1. START
2. Initialization of param-eters (maximum veloci-ties, minimum velociveloci-ties, position limits, maximum iterations)
3. Random generation of ini-tial values (swarm) 4. REPEAT
5. Reproduction: Each particle generates 1 new descendent (movement, new position) 6. Evaluation: Each particle
has its fitness value, ac-cording to its current po-sition in search space 7. Store the best solution of
swarm
8. UNTIL termination criteria (Number of generations) 9. END PSO
We then compared the results and performance of this technique with those obtained with conventional techniques using the professional op-timization tool, General Algebraic Modeling System (GAMS; see www. gams.com).
Simulator
DemSi is a DR simulator that we de-veloped to simulate the use of DR programs. We used PSCAD as the base platform for the network simu-lation, enabling the use of detailed models of electrical equipment and the consideration of transient phe-nomena. These abilities are relevant to analyze the technical viability of the DR proposed solutions, both for steady state and transients (although we don’t present network response to load changes here).
DemSi considers the players in-volved in the DR actions and allows result analysis from each specific player’s viewpoint. This includes four types of players: electricity consum-ers, consumer aggregators, electricity retailers (suppliers), and the distri-bution network operator. Here, we analyze the case study from the view-point of a consumers’ aggregator.
Consumers can be characterized on an individual or aggregated basis. Based on their profiles, some clients can establish flexible supply contracts with their suppliers. DemSi considers the information concerning the quan-tity of load that can be cut or reduced and the corresponding compensa-tions for each client.
DemSi classifies the loads as five main types based on function of peak power consumption, energy destina-tion, and load diagram:
• domestic, • small commerce, • medium commerce, • large commerce, and • industrial.
Figure 1 shows DemSi’s general architecture.
each client and each supplier. The formulated optimization problem’s solution is found using Matlab and/or GAMS. Using diverse approaches for solving the optimiza-tion problems, it’s pos-sible to derive the best approach for each type of situation.
Once the simulation is started, a simulation line feeds DemSi with time-tagged events. PSCAD simulates all physical phe-nomena related to the power system. The man-agement of DR programs is undertaken by a module
developed in Matlab. The simulation’s end is determined by the end of the sim-ulation timeline.
Every time the simulator is initi-ated, an initial state (for example, load value, breaker state, and so on) is considered as the departing simu-lation point. Once the simusimu-lation is launched, the supply information and the consumer knowledge base have the required information that allows optimizing DR program use over time, allowing the simulation to con-tinue. The DR program-management module optimizes the use of DR op-portunities for each situation.
Case Studies
Here, we illustrate the use of the pro-posed methodology in the developed DR simulator DemSi. The case study considers a distribution network with 32 buses from Mesut Baran and Felix Wu,22 which we evolved in a scenario
to the year 2,040 in terms of load characterization.23 All the results
presented in this article are obtained for two scenarios, with 32 and 320 consumers, respectively.
Case Characterization
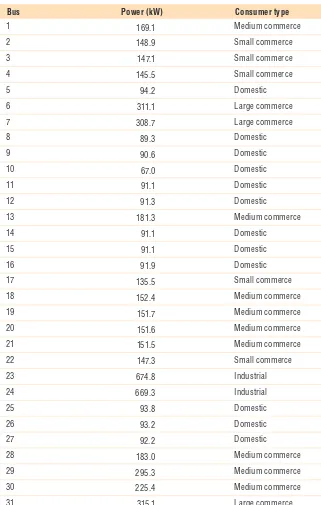
Table 1 shows the load demand in the first scenario, with 32 consum-ers. The second scenario had 10 con-sumers in each bus, corresponding to a total of 320 consumers. In this sce-nario, the 10 loads connected to each bus have the total power presented in Table 1 and are of the same load type. Table 1 also shows each con-sumer’s type.
In both scenarios, we considered that all loads of the same type have the same price variation during the DR program application. We solved each scenario and reduction need with two approaches: with the devel-oped PSO module and with nonlinear programming (NLP) implemented in GAMS. We compared results in terms of time of execution and solution val-ues. The values of elasticity are 0.14,
commerce, and indus-trial consumer types. The corresponding val-ues for electricity price, which correspond to re-tailer’s flat-rate tariff val-ues, are 0.18, 0.19, 0.20, 0.16, and 0.12 euros per kW hour.
As a restriction on the proposed formulation, we consider a price and power cap; we can pa-rameterize these cap val-ues for each case study. For this case study, the price cap is equal to 150 percent of the energy price value and the power cap is 15 percent of the power consumption value for every customer.
DR program use is triggered by a load reduction required by the sup-plier. We consider a set of seven re-duction values for each scenario. For each reduction requirement, the en-ergy price for each consumer type and the load reduction for each con-sumer are obtained as a result of the optimization problem.
Particle Swarm Optimization Application Details
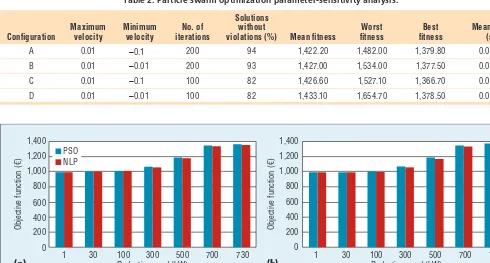
The problem described here has five variables that are the price variation upper limits for the five load types. In PSO, these variables are easily coded—that is, each particle has a di-mension space of five. Table 2 shows the results of the performance and parameters sensitivity analysis of the method for 1,000 runs.
Given our results, we adopted con-figuration A for this case study. The maximum position of each particle’s
Figure 1. The DemSi architecture. A simulation timeline is used to feed DemSi with time-tagged events. Power Systems CAD (PSCAD) simulates the physical phenomena related to the power system; the simulation’s end is determined by the end of the simulation timeline.
(PSCAD) Consumer
knowledge base
Simulation timeline end?
No Yes
End
Demand response program management Simulation
E M E R G E N C Y M A N A G E M E N T
dimension is the price variation upper limit; the minimum position is zero. This case study uses 60 particles and 200 iterations. The maximum and minimum velocity are 0.01 and −0.1, respectively.
We used control penalties to ad-dress the energy balance constraint.
We added the penalties to the fitness function to control the system energy balance (equality equation).
Results
We analyze the results in terms of execution time function and the ob-tained solutions. We verified that
ex-ecution time doesn’t depend on the consumption reduction need. PSO takes about 0.07 and 0.15 seconds for 32 and 320 consumers, respec-tively. NLP takes 0.32 seconds in both cases.
Although the execution time dif-ference between PSO and NLP might seem irrelevant, the advantage of the PSO approach is important for some studies for which a large number of simulations is required in a rela-tively short time. This could be the case when deciding to declare a DR event when the system has a mini-mum anticipation time for consumer notification.
Figure 2 shows the values of each approach’s objective function and each scenario’s reduction need. These values, in euros, correspond to the global costs for the loads after the DR program implementation.
Comparing PSO and NLP, we can conclude that, for lower reduc-tion needs, the results are almost the same. For higher reduction needs, PSO returns slightly worse results. These conclusions are not influenced by the problem’s dimension (that is, the number of consumers).
For a more detailed analysis, Fig-ure 3 shows the energy price varia-tion for the 32 loads scenario for each approach. In Figure 3a, results for the major reduction need are grouped by consumer type. For this reduction need, all loads are required to partic-ipate. The slight differences between the two approaches are because PSO is a stochastic method. Because finding the global optimum can’t be guaranteed, the obtained solution tends to be a local optimum with an objective function value close to the global optimum. Although the value obtained for the objective function is close to the one obtained by the NLP approach, the solution itself can present some differences—namely,
Table 1. Consumer data.
Bus Power (kW) Consumer type
1 169.1 Medium commerce
2 148.9 Small commerce
3 147.1 Small commerce
4 145.5 Small commerce
5 94.2 Domestic
6 311.1 Large commerce
7 308.7 Large commerce
8 89.3 Domestic
9 90.6 Domestic
10 67.0 Domestic
11 91.1 Domestic
12 91.3 Domestic
13 181.3 Medium commerce
14 91.1 Domestic
15 91.1 Domestic
16 91.9 Domestic
17 135.5 Small commerce
18 152.4 Medium commerce
19 151.7 Medium commerce
20 151.6 Medium commerce
21 151.5 Medium commerce
22 147.3 Small commerce
23 674.8 Industrial
24 669.3 Industrial
25 93.8 Domestic
26 93.2 Domestic
27 92.2 Domestic
28 183.0 Medium commerce
29 295.3 Medium commerce
30 225.4 Medium commerce
31 315.1 Large commerce
32 89.8 Domestic
in what concerns the consumers in-volved in the load reduction for each specific DR event. In Figure 3b, for each reduction need, the maximum variation on energy price is compared with the maximum allowed varia-tion. In all results, the variations are largely below the maximum permit-ted because the formulation consid-ers both price and power cap, and the power cap became prevalent, and
hence it limited higher response from loads.
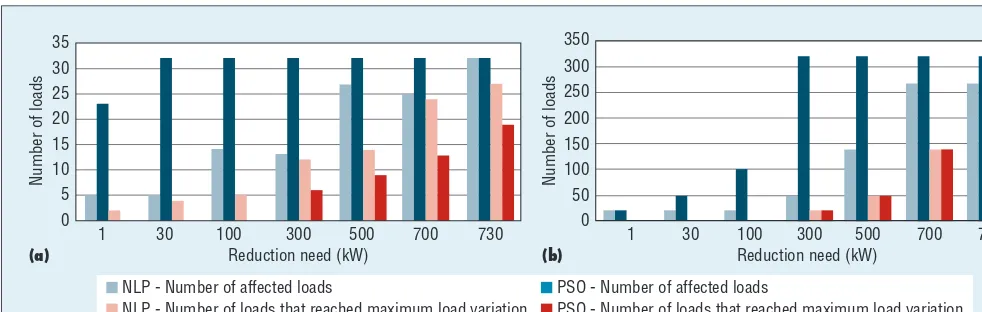
Finally, Figure 4 shows the DR program’s load participation in the two scenarios. In general, compar-ing the results for the two scenar-ios shows similar behavior. In terms of the number of loads affected, the PSO solutions tend to correspond to more distributed load participa-tion. For the loads that reached the
maximum power variation, NLP performs rational management of loads, scheduling loads like using an order of merit: the next load is used when the load under consideration has no more capacity. In contrast, PSO spreads the variation among the loads so the maximum variation is not reached except for higher reduc-tion needs when load variareduc-tions are forced to the limit.
Figure 2. The global costs for loads after DR implementation. The costs are determined by each approach’s objective function and each scenario’s reduction needs, which are shown here for (a) 32 loads and (b) 320 loads. For lower reduction needs, the results are almost the same. For higher reduction needs, PSO returns slightly worse results.
1,400
1,200
1,000
800
Objective function (€)
600
400 200
1 30 100 300
Reduction need (kW)
500 700 730
0
1,400
1,200 1,000
800
Objective function (€)
600
400
200
1 30 100 300
Reduction need (kW)
500 700 730
0
(a) (b)
PSO NLP
Figure 3. Detailed results for energy price variation for the 32 loads scenario. (a) Price variation in the major reduction need for each consumer, grouped by consumer type. (b) Major energy price variation in comparison with the maximum permitted.
0.18 0.3
0.25
0.2
0.15
0.1
0.05
0 Energy price variation (€/kWh) Energy price variation (€/kWh)
0.16 0.14 0.12 0.1 0.08 0.06 0.04 0.02 0
SC DM
Consumer type Reduction needs (kW)
MC LC IN 1 30 100 300 500 700 730
PSO NLP
Maximum permitted price variation
(a) (b)
PSO NLP
C 0.01 −0.1 100 82 1,426.60 1,527.10 1,366.70 0.0387
E M E R G E N C Y M A N A G E M E N T
I
n terms of the number of loads af-fected by DR, the PSO solution gives higher load participation for each imposed consumption reduction. PSO tends not to achieve the maximum load reduction for each consumer, spreading load reduction by more load types. For these reasons, the PSO approach leads to more interesting solutions, achieving the envisaged con-sumption needs involving a large num-ber of participants, with only a slight increase of the total cost.Acknowledgments
This work is supported by Fundo Económico para o Desenvolvimento Regional (FEDER) funds through the Fatores de Competitivi-dade (COMPETE) program and by na-tional funds through Fundação para a Ciência e a Tecnologia (FCT) under the projects FCOMP-01-0124-FEDER: PEst-OE/ EEI/UI0760/2011, PTDC/EEA-EEL/099832/ 2008, PTDC/SEN-ENR/099844/2008, and PTDC/SEN-ENR/122174/2010.
References
1. Z. Vale et al., “Mascem—Electricity Markets Simulation with Strategically Acting Players,” IEEE Intelligent Sys-tems, vol. 26, no. 2, 2011, pp. 9–17. 2. Y. Guan and M. Kezunovic, “Grid
Monitoring and Market Risk Man-agement,” IEEE Intelligent Systems, vol. 26, no. 2, 2011, pp. 18–21. 3. J. Ferreira et al., “A
Data-Mining-Based Methodology for Transmission
Expansion Planning,” IEEE Intelligent Systems, vol. 26, no. 2, 2011, pp. 28–37.
4. F. Rahimi and A. Ipakchi, “Over-view of Demand Response under the Smart Grid and Market Paradigms,”
Proc. Innovative Smart Grid Tech-nologies, IEEE, 2010; doi:10.1109/ ISGT.2010.5434754.
5. Z. Vale, H. Morais, and H. Khodr, “Intelligent Multi-Player Smart Grid Management Considering Distrib-uted Energy Resources and Demand Response,” Proc. IEEE Power and Energy Society General Meeting, IEEE, 2010, pp. 1, 7, 25–29; doi:10.1109/ PES.2010.5590170.
6. K.Y. Lee and M.A. El-Sharkawi, Mod-ern Heuristic Optimization Techniques: Theory and Applications to Power Systems, Wiley-Interscience, 2008. 7. C. Ramos and C. Liu, “Intelligent
Systems in Power Systems and Energy Markets,” IEEE Intelligent Systems, vol. 26, no. 2, 2011, pp. 5–8.
8. J. Kennedy and R.C. Eberhart, “Particle Swarm Optimization,” Proc. IEEE Int’l Conf. Neural Networks, vol. 4, IEEE, 1995, pp. 1942–1948.
9. E. Bonabeau, M. Dorigo, and G. Theraulaz, Swarm Intelligence: From Natural to Artificial Systems, Oxford Univ. Press, 1999.
10. M.R. Al-Rashidi, and M.E. El-Hawary, “A Survey of Particle Swarm Optimi-zation Applications in Electric Power
Systems,” IEEE Trans. Evolutionary Computation, vol. 13, no. 4, 2009, pp. 913–918.
11. D.S. Kirschen, “Demand-Side View of Electricity Markets,” IEEE Trans. Power Systems, vol. 18, no. 2, 2003, pp. 520–527.
12. P.R. Thimmapuram et al., “Modeling and Simulation of Price Elasticity of Demand Using an Agent-Based Model,”
Proc. Innovative Smart Grid Technolo-gies, IEEE, 2010.
13. L. Stuntz, Keeping the Lights On in a New World, tech. report, US DOE Elec-tricity Advisory Committee, Jan. 2009. 14. Z. Vale et al., “The Role of Demand
Response in Fuvture Power Systems,”
Proc. Transmission and Distribu-tion Conf. & ExposiDistribu-tion: Asia and Pacific, IEEE, 2009; doi:10.1109/ TD-ASIA.2009.5356902. 15. R.A. Arnold, Economics, 9th ed.,
South-Western College Pub, 2008. 16. M.H. Albadi and E.F. El-Saadany,
“A Summary of Demand Response in Electricity Markets,” Electric Power Systems Research, vol. 78, no. 11, 2008, pp. 1989–1996.
17. J. Bushnell, B. Hobbs, and F. Wolak, “When It Comes to Demand Response, Is FERC Its Own Worst Enemy?” The Electricity J., vol. 22, no. 8, 2009, pp. 9–18.
18. L.A. Greening, “Demand Response Resources: Who Is Responsible for Implementation in a Deregulated Figure 4. The DR program’s load participation. This shows both the number of loads that have participated and the loads that reached maximum load variation in terms of reduction need for the (a) 32 load and (b) 320 load scenarios.
35
Number of loads
350
Number of loads
1 30 100 300
Reduction need (kW)
500 700 730 1 30 100 300
Reduction need (kW)
500 700 730
(a) (b)
NLP - Number of affected loads
NLP - Number of loads that reached maximum load variation
PSO - Number of affected loads
Demand Response to the Next Level,”
IEEE Power and Energy, vol. 8, no. 3, 2010, pp. 60–65.
20. S. Chua-Liang and D. Kirschen, “Quan-tifying the Effect of Demand Response on Electricity Markets,” IEEE Trans. Power Systems, vol. 24, no. 3, 2009, pp. 1199–1207.
21. A. Engelbrecht, Computational Intelligence: An Introduction, John Wiley & Sons, 2007.
22. M. Baran and F. Wu, “Network Recon-figuration in Distribution Systems for Loss Reduction and Load Balancing,”
IEEE Trans. Power Delivery, vol. 4, no. 2, 1989, pp.1401–1407.
23. P. Faria, Z. Vale, and J. Ferreira, “DemSi—A Demand Response Simulator in the Context of Intensive
Use of Distributed Generation,” Proc. IEEE Int’l Conf. Systems, Man, and Cybernetics (SMC), IEEE, 2010, pp. 2025–2032.
Zita Vale is the director of the GECAD and a tenured coordinator professor in the Polytechnic of Porto’s School of Engineering. Her research interests include artificial intelligence applications to power system operation and control, electricity markets, and distributed generation. Vale has a PhD in electrical and computer engineering from the University of Porto, Portugal. Contact her at [email protected].
João Soares is a graduate student at the GECAD in the Polytechnic of Porto’s School of Engineering. His research interests include heuristic optimization in power and energy systems. Soares has a BSc in informatics from the Polytechnic of Porto. Contact him at [email protected].
Judite Ferreira is a professor and researcher at the GECAD in the Polytechnic of Porto’s School of Engineering. Her research interests include electricity markets operation. Ferreira has a PhD in electrical engineering from the University of Trás-os-Montes e Alto Douro. Contact her at [email protected].
Selected CS articles and columns are also available for free at http://ComputingNow.computer.org.
IEEE Software
seeks practical, readable articles that will appeal to experts andnonexperts alike. The magazine aims to
deliver reliable information to software
developers and managers to help them
stay on top of rapid technology change.
Submissions must be original and no more
than 4,700 words, including 200 words for
each table and fi gure.
Author guidelines:
www.computer.org/software/author.htm Further details: [email protected]
www.computer.org/software