Corresponding Author: Chin Kim Gan, Faculty ofElectrical Engineering, UniversitiTeknikal Malaysia Melaka, Hang Tuah Jaya, 76100 Durian Tunggal, Melaka.
Using Particle Swarm Optimization Algorithm in the Distribution System Planning
1
Meysam Shamshiri,
1Chin Kim Gan,
2Kamaruzaman Jusoff,
3Ihsan Jabbar Hasan,
1Mohd Ruddin
AbGhani and
4Mariana Yusoff
1
Faculty of Electrical Engineering, UniversitiTeknikal Malaysia Melaka (UTeM),Hang Tuah Jaya,
76100 Durian Tunggal, Melaka, Malaysia
2
Perdana School of Science, Technology & Innovation Policy (UTM Perdana School), 6th Floor,
Menara Razak, Universiti Teknologi Malaysia Kuala Lumpur, Jalan Semarak, 54100 Kuala Lumpur,
Malaysia
3Foundation of Technical Education, Al-mansour,Baghdad,Iraq
4Centre for Languages and Human Development, UniversitiTeknikal Malaysia Melaka (UTeM), Hang
Tuah Jaya, 76100 Durian Tunggal, Melaka, Malaysia
Abstract:Technology advancement, the drive to reduce environmental pollution and energy security concern, have led toan increase in the use of Distributed Generations (DGs). One of the important aspects of the power system is the optimal operation of distribution networks. Therefore, the objective of this paper is to determine the possiblesolution for optimal operation of distribution networks which takes into account the impact of DG. Since the optimal operation of distribution networks is an optimization problem with discrete and continuous variables, it can be introduced as an integer problem that can be formulated using themetaheuristic approach. This paper utilizes the Particle Swarm Optimization (PSO) algorithm to solve the distribution planning problem with DG. In addition, a case study on IEEE 34 bus system has been carried out to demonstrate the effectiveness of the PSO algorithm with regards to Genetic Algorithm (GA). Results indicate that PSO havebetter peformanceover the GA in terms of cost of lossesminimizationand convergence time.Future work should consider to minimize the overall network cost simultaneously that takes into account the DG investment cost, cost of losses and maintenance cost.
Key words: Distributed Generation, Distribution System Planning, Particle Swarm Optimization, Genetic Algorithm
INTRODUCTION
The electricity industry has faced major changes during the past decades. The desire to create a competitive environment has caused the separation of various entity such as generation, transmission and distribution. These developments and the other issues such as the climate change challenge, energy supply security and technology advancement havecaused the increase in the utilization of DG. Most of DGs can be directly connected to the distribution network which located close to the load centre. This issue offers a significant benefit to the system such as avoiding or deferring the need to install new transmission lines and reduce network power losses. Past research (Massoud Amin, S. and B.F. Wollenberg, 2005; Hobbs, B.F., 2001; Wilson, R.B., 1997) conducted under the Electric Power Research Institute (EPRI) have shown that more than 25% capacity of new installed DGs were installed until 2010.
With regards to the matterson DGs, thus there is a strong urge that the past system studies related to the system planning should be revisited.
One of the essentialareas that need to be further explore is the optimal management of distribution networks (Chiradeja, P., 2005; Wang, Z. and Q. Xu., 2011). Generally, the optimal operation of distribution networks has leadto an optimum use of resources within the prescribed network constraints (Danny Pudjianto, 2013; Chin Kim Gan, 2011). The optimization problem can be tacklein two conditions: firstly, the objective function has a minimum value;and secondly, the technical constraint of the problem should be met. The distribution networkprior to DG connection wasnot involved with the distributed energy resources, thus the problem formulation of optimal management will only include the active power resources control that aims at reducingnetwork losses (Ghadimi, A.A. and H. Rastegar, 2009; Wille-Haussmann, B., 2009).
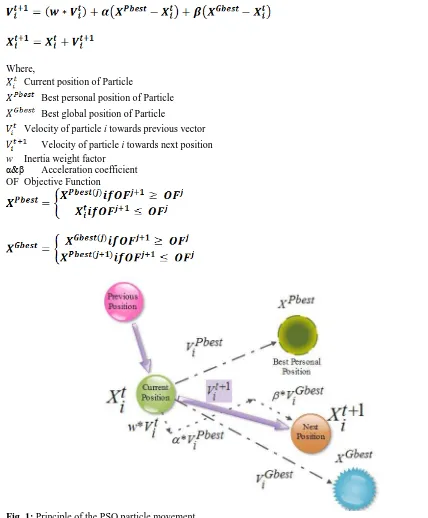
Initialy, at the PSO algorithm, some particlespositionare assumed in the intended search space as initial population. All points are based on Euclidean distance in a various categories.The instance, as illustrated inFigure 1, consists of three factors tracer, namely based on Previous Position, Personal Best Position and Global Best Position. The function of each particle in the search space is calculated and each category determines the value of particle depending on the target function which is minimized or maximized. Thus, the best member of each category is determined. On the other hand, with regard to previous information of each particle, the best point can be identified,which is already discovered. Therefore, the optimal point of each category and particle is determined. The first recognition in each category corresponds to the global optimum and the second recognition corresponds to the personal or local optimum point. According toFigure 1, supported with the precedent paragraph, the particle can be moved in the direction of the following vector equation (Del Valle, Y., 2008):
(1)
(2)
Where,
Current position of Particle
Best personal position of Particle Best global position of Particle
Velocity of particle i towards previous vector Velocity of particle i towards next position w Inertia weight factor
α&β Acceleration coefficient OF Objective Function
(3)
(4)
Fig. 1: Principle of the PSO particle movement.
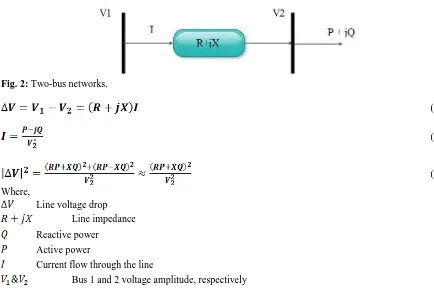
radial structure of these grids, the impact of DGs on distribution network voltage is much higher than the other power reactive resources. For this purpose, the following two-bus networksand voltage drop equation for the network are calculated (Moradi, M.H. and M. Abedini, 2010) (Figure 2).
Fig. 2: Two-bus networks.
Bus 1 and 2 voltage amplitude, respectively
As observed from the above equations, the voltage change affiliation to active power is not negligible because of the greater resistance value of distribution networks towards their reactance. Therefore, the optimization problem constraints are deemed necessary as these constraints are one of the penalty factors in the objective function.
The main target of distribution network planning is to minimize the objective function equation whereby the variables of this particular equation have a non-linear relation.Therefore, the objective function of the optimal operation problem is non-linear and discrete. In other words, the PSO algorithm is able to achieve the possible optimal global point with a sequence iteration and find the near optimal solution based on the related objective function.Pls re-write your objective in only 1 statement!!
Methods:
PSO Operation Procedure:
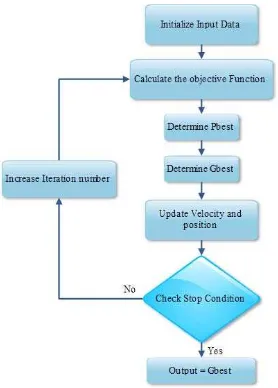
The PSO is a heuristic method based on creating an initial random solution as illustrated in Figure 3. There are six stages involved in the PSO flowchart, namely(a) Initialize Input data: The configuration of the distribution network and candidate DG sizing and locating are provided in this stage. The function model is produced by setting the random initial population and iteration number, random initial selection of position and velocity into the search space, (b) Calculate the objective function: The network solution program will be set up with the initial data whereby the objective function will calculate the summation of each particle, (c) Determine Pbest: The parameters of objective function values related to the positioning of each particle are compared with the corresponding value in previous positions. The lower objective function is then listed as Pbest for the current iteration as shown in the equation (3) (Ziari, I., 2009), (d) Determine Gbest: In this stage, the lowest objective function among the Pbests is related to all particles in the current iteration. It is then compared with the previous iteration and the lower one is recorded as the Gbest as shown in the equation (4) (Ziari, I., 2009), (e) Update velocity and position: The position and velocity of particles can be calculated for next iteration using both equations (1) and (2). It should be noted that α&β are acceleration coefficients that can be calculated as follows:
(9)
Where, is the personal learning coefficient, is global learning coefficient and are uniformly distributed random numbers and (f) Check stop condition: There are three different modes for finalization of the algorithm depending on the objective function for stopping the iteration loop as shown in Figure 4. The algorithm can be finalized 1) after achieving the satisfying cost and desired value of the objective function, or 2) after achieving the some stall iteration, which means after the specified time has elapsed or the number of iterations without any improvement in outcome, or 3) after the specified time has elapsed or number of state iterations. Hence, after calling each of the above cases, the algorithm will be finalized and the results will be printed in the output.
Fig. 3: The PSO algorithm flowchart.
Objective Function Formulation:
Fig. 4: Stop Conditions.
The following equation is represented power losses:
(10)
Where,
Real Power Losses
Active power from output bus i
Active power on demand bus i
Voltage from sending bus i
Volatge on receiving bus i
Admittance between sending and receiving at bus i Phase angle of sending bus i
Phase angle of receiving bus i Phase angle of
The following equation is represented to improve the voltage profile:
(11)
Where, is voltage profile of objective function and is rated voltage.Thus, from equations (10) and (11),they representthe objective function in Equation(12) which must be minimized.
(12)
Where, is violation coefficient, DP is the penalty factor that derived from problem constraints and Z is thecost function that should be minimized with PSO algorithm.
The problem constraints and limitation of optimal management distribution system planning are as follows: Bus voltage
Current feeders
RESULTS AND DISCUSSION
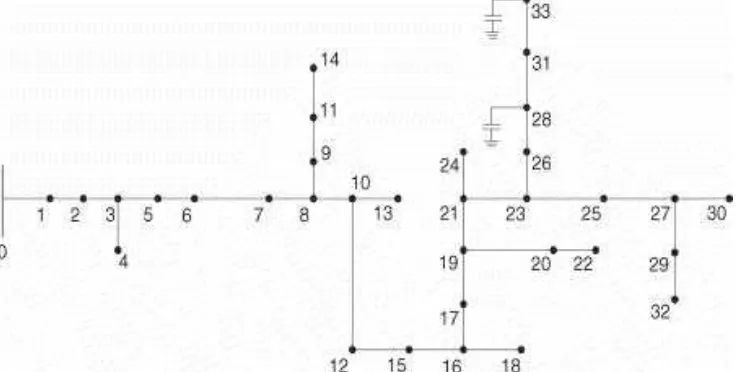
The distribution system planning is solved based on the results of the PSO algorithm and the GA application. The IEEE 34 busesthat has been used in this study isas shown in Figure 5 with three different types of DG installed at the respective buses. The number of buses connected with DG and the DG characteristicsare as listed in Table 1. The comparison between the results of PSO and GA after solving the objective function is shown in Table 2.
Fig. 5: IEEE 34 buses diagram.
Table 1: Distributed Generation features.
G1 G2 G3
Active power (kW) 100 400 600
Max reactive power (kVar) 80 320 480
Min reactive power (kVar) -60 -240 -360
Position in buses 5 15 33
Type of DG Micro-turbine with
CHP
Wind Turbine Gas Turbine with CHP
Table 2: Comparison between GA and PSO.
Solution Convergence time(Sec) Objective function
Best Worst Best Worst
GA 1200 1300 1026.46 1268.24
PSO 450 600 1020.43 1270.56
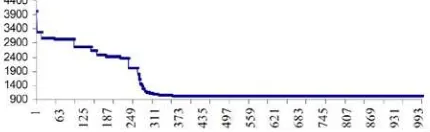
Figures 6 and 7 show the GA and PSO respectively from the Matlab program output after solving the optimization problems.Both figures indicate the convergence time after the number of iterations to reach to the satisfied cost function.
Fig.shows the GA algorithm is obtained to the best result after passing around 639 iterations but Fig. shows the best result is achieved after 373 iterations. The convergence time for each method is shown in Table 1: Distributed Generation features.
G1 G2 G3
Active power (kW) 100 400 600
Max reactive power (kVar) 80 320 480
Min reactive power (kVar) -60 -240 -360
Position in buses 5 15 33
Type of DG Micro-turbine with
CHP
Wind Turbine Gas Turbine with CHP
Fig. 6: Minimize the cost according to the number of iterations in GA.
Fig. 7: Minimize the cost according to the number of iterations in PSO.
Conclusion:
Technology advancement has helped to facililate the effective integration of DGs, which is commonly connected to the distribution networks. Moreover, this paper compares the performance of PSO and GA algorithm in terms of cost of losses minimization and convergence time.The presented study suggests that PSO solutionis less time intensive if compared to GA method for cost of losses minimization problem in multi-DG system. The future work should consider to minimize the overall network cost simultaneously that takes into account the DG investment cost, cost of losses and maintenance cost.
ACKNOWLEDGMENT
The authors would like to gratefully acknowledge the funding support provided by the Ministry of Higher Education Malaysia under the research grant NO.MTUN /2012/UTEM-FKE/7 M00015.
REFERENCES
Chin Kim Gan, Pierluigi Mancarella, Danny Pudjianto, Goran Strbac, 2011. Statistical appraisal of economic design strategies of LV distribution networks. Electric Power Systems Research, 81(7): 1363-1372.
Chiradeja, P., 2005. Benefit of Distributed Generation: A Line Loss Reduction Analysis, in Transmission and Distribution Conference and Exhibition,IEEE/PES, Asia and Pacific, pp:1-5.
Danny Pudjianto, Predrag Djapic, Marko Aunedi, Chin Kim Gan, GoranStrbac, Sikai Huang, David Infield, 2013. Smart control for minimizing distribution network reinforcement cost due to electrification. Energy Policy, 52: 76-84.
Del Valle, Y., G.K. Venayagamoorthy, S. Mohagheghi, J.C. Hernandez and R.G. Harley, 2008. Particle swarm optimization: basic concepts, variants and applications in power systems. IEEE Transactions on Evolutionary Computation, 12(2): 171-195.
Ghadimi, A.A. and H. Rastegar, 2009. Optimal control and management of distributed generation units in an islanded MicroGrid, in Integration of Wide-Scale Renewable Resources Into the Power Delivery System, CIGRE/IEEE PES, pp: 1-7.
Hobbs, B.F., M.H. Rothkopf, R.P. O'Neill and H.P. Chao, 2001. The next generation of electric power unit commitment models .Norwell, USA,Springer Press, 328 p.
Holland, J.H., 1992. Adaptation in natural and artificial systems: an introductory analysis with applications to biology, control, and artificial intelligence. University of Michigan, USA, MIT Press, 211 p.
Kennedy, J. and R.C. Eberhart, 1997. A discrete binary version of the particle swarm algorithm. Computational Cybernetics and Simulation
Massoud Amin, S. and B.F. Wollenberg, 2005. Toward a smart grid: power delivery for the 21st century. IEEEPower and Energy Magazine, 3(5): 34-41.
Moradi, M.H. and M. Abedini, 2010. A combination of genetic algorithm and particle swarm optimization for optimal DG location and sizing in distribution systems. IPEC, 2010 Conference Proceedings, pp: 858-862.
Niknam, T., A.M. Ranjbar, A.R. Shirani, B. Mozafari and A. Ostadi, 2005. Optimal operation of distribution system with regard to distributed generation: a comparison of evolutionary methods in Industry Applications Conference. 4thIAS Annual Meeting Conference Record of the 2005, pp: 2690-2697.
Wang, Z. and Q. Xu., 2011. On distribution system planning method for reliability and its application. 4th International Conference on IEEE Electric Utility Deregulation and Restructuring and Power Technologies, pp: 1727-1731.
Wille-Haussmann, B., C. Wittwer and S. Tenbohlen, 2009. Reduced models for operation management of distributed generation, in Electricity Distribution - Part 1. 20th International Conference and Exhibition on CIRED, pp: 1-4.
Wilson, R.B., 1997. Nonlinear Pricing: Published in association with the Electric Power Research Institute. Oxford University Press, New York, USA. 430 p.