http://dx.doi.org/10.17503/Agrivita-2014-36-2-p120-127
DIVERSITY OF ARTHROPODS ON COCOA PLANTATION IN THREE STRATA OF
SHADE TREE
Moh. Hibban Toana1*), Gatot Mudjiono2), S. Karindah2) and Abdul Latief Abadi2) 1) Faculty of Agriculture, Tadulako University
Kampus Bumi Kaktus Tondo Palu Indonesia 2) Faculty of Agriculture, University of Brawijaya
Jl. Veteran Malang 65145 East Java Indonesia
*) Corresponding author Phone: +62-82345074910 Email: [email protected]
Received: May 3, 2014 /Accepted: July 12, 2014
ABSTRACT
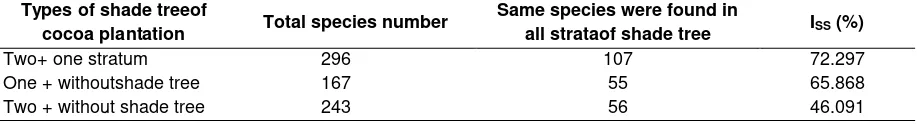
The Research was aimed to identify the diversity of arthropods in Cocoa plantation in three strata of shade tree. Research was conducted in Rahmat village, the sub-district of Palolo, District of Sigi, the Province of Central Sulawesi, Indonesia from December 2012 to June 2013.Berlese funnel, Pitfall, Malaise and Light trap were used to collect arthropod samples. There were five indices such as species richness (R), species evenness (E), species diversity (H`and D), and species similarity (Iss) to analyze the diversity of arthropods in cocoa plantations. The result showed that species richness (R) of arthropods under the two strata of shade tree, species evenness (E) and both of species diversity indices, Shannon (H`) and Simpson (D) was the highest, with value of 18.216, 0.839, 4.383, and 0.833 respectively. In addition, percentage of species similarity (Iss) was the highest under two strata of shade tree with value 72.297%.
Keywords: arthropods, cocoa, species diversity, two strata of shade tree
INTRODUCTION
Cocoa (Theobroma cocoa L.) is one of agricultural commodities that contribute to the Indonesian foreign exchange. Susanto (1994) reported that Cocoa as an export commodity provides raw material for certain agroindustry. Availability of areas in Indonesia can be the important factor to support Cocoa plantation and industry (Sutrisno and Winahyu, 1997).Cocoa is planted as major crop in South, South East, and Central Sulawesi, North Sumatera, East of Nusa
Tenggara, East Java, East Kalimantan, North Moluccas and Irian Jaya (Anonymous, 2012). Cocoa production ishampered by plant pests and the strataof shade tree. Major pest on cocoa is Cocoa Pod Borer Conopomorpha cramerella Snellen, Helopeltisspp, Zeuzera coffeae Nietnand Glenea spp. (Firdausil et al., 2008). However, in South East Sulawesi Cocoa Pod Borer (Conopomorpha cramerella Snellen (Lepidoptera: Gracillariidae) was reported as the major pest (Bradley, 1986). Wiryadiputra (1993) stated that C. cramerella resulted 75-80% yield loss of cocoa production. There were 3,445 ha of severe attack and 4,867 ha of moderate attack in Sigi District, caused by C. cramerella (Disbun Sulteng, 2012). As impacts of C. cramerella, production of cocoa bean decreased 615-833 kg/ha and this production was lower than national production (1,000 kg/ha) (Sulistyowati and Wiryadiputra, 2008).
In Rahmat village, cocoa was cultivated on spaces between forest trees and fruit trees (called two strata of shade tree) (01ᵒ11’ 55.7’’S, 120ᵒ 03’ 41.5’’E, 802-1237 m asl). In addition, they cultivated cocoa under Candlenut trees (called one stratumof shade tree) (01ᵒ 11’
35.8’’S, 120ᵒ03’ 43.3’’ E, 752-1237 masl) or no shade tree (closed to be monoculture) (01ᵒ11’
33.9’’S, 120ᵒ03’ 54.2’’ E, 742-1237 masl). Altieri and Nicholls (2004) mentioned that monoculture can cause agroecosystem susceptible to the pest attack. Cocoa cultivated by monoculture will also create susceptible agroecosystem.
different related to the difference of strata types of shade tree. Knops et al. (1999) mentioned that the vulnerability to invasions by plant species, and increasing of the spread of plant fungal diseases caused by experimental reduction of plant richness in grassland will also influence richness and structure of insect communities.
Insects greatly determines the biological diversity of fragmentation of habitat in the agricultural landscape (Kruess and Tscharntke, 1994). Structure of agricultural landscape can have strong impact on activities of natural enemies, such as parasites and predators. Positive relationship between parasitoid abundance and diversity and landscape vegetation complexity was clearly described in the simple and complex landscape, where in complex landscape, percentage of parasitism was significantly higher than that of the simple landscape (Marino and Landis, 1996). In addition, landscape factors are the key drivers of predator abundance in case of aphids suppression on Soybean (Woltz et al., 2012).
The closed relationship between agri-cultural landscape and insect diversity, the diversity of arthropods on cocoa plantation under the three types of shading was observed. It was assumed that there were differences in arthropod diversity among three intensities of shade tree on cocoa plantation.
MATERIALS AND METHODS
The diversity of arthropods was surveyed in three types of cocoa plantation at Rahmat village,sub-district of Palolo, District of Sigi, Province of Central Sulawesi, Indonesia from December 2012 to June 2013. These cocoa plantations have different types of shade tree. There were three sorts of shadetree, i.e.cocoa with two strataof shadetree, cocoa with one stratum of shade tree, and cocoa without shade tree. Sampling arthropods were conducted from December 2012 to June 2013.
Arthropods samples were collected by light trap, pitfall trap, malaise trap and Berlese funnel.
Light trap. Thirteen light traps were located ineach type of cocoa plantation. One light trap was put on the centre of four quadrants of cocoa trees. Light traps were turned on at
6.00 pm and insect samples were collected at 6.00 am. Arthropod samples were collected every two weeks for 6 months.
Pitfall Trap. Pitfall traps, which contained water and detergent, were put into the ground for 24 hours. The distance of each pitfall trap was 20 m. Arthropod samples were collected every two weeks for 6 months.
Malaise Trap. Malaise trap was located for 24 hours in the center of each type of cocoa plantation. Plastic bottles containing water and detergent were set up at the top of Malaise trap. The trap was set up once in two weeks for 6 months.
Berlese Funnel. Berlese funnel was used to extract arthropod samples from the soil samples. Soil samples were collected from 5 sample points (20 x 20 cm) diagonally within 1 m2 area of sampling. Five soil samples were mixed and putinto the Berlese funnel. Erlenmeyer contained water and detergent was placed under the Berlese funnel to collect arthropod from the soil samples. Arthropod sampling was takenonce in two weeks for 6 months.
All collected arthropod samples were identified based on their morphological characters and functions in the laboratory of plant pest, Faculty of Agriculture, Tadulako and Brawijaya University. Physical factors were recorded to describe the arthropod dynamic such as rainfall, temperature and relative humidity.
Variables were observed in this research i.e. number of species and their population. Based on the data of each variable, some ecological indices, such as Species Richness, Species Evenness Indices, Shannon-Wiener Indices (H`), Simpson index (D), and Sorensen Similarity index were calculated: 1. Species Richness, Margalef Index (Ludwig
and Reynolds,1988) ln(n)
1 S R
R, S, n, and ln are species richness index, number of species, population of each species, and logarithmic number respectively. 2. Species Evenness Indices, Pielou Indices
formulated as ln(S)
E, H` and S are species evenness indices, Shannon diversity indices, and number of species respectively.
3. Species diversity indices, Shannon-Wiener Indices (H`):
H`, ni and N are Shannon-Wiener index, population of i species and population total of all species respectively.
Table 1. Value and description of H’ (Anony -mous, 2014)
4. Simpson index (D) is described as below:
ni and N are population of each species and population of all species, respectively. Diversity will be lower if the value of D (Simpson index) is higher.
5. Sorensen Similarity index
Iss, A, and B are Similarity index, number of arthropod species in A and B types of shadetree and the number of the same arthropod species in both types of shade treeof cocoa plantation, respectively.
6. Index Hurlbert (1971):
E(Sn), N, Nn, and Ni are Estimated value of species numbers, the smallest population of species, total population of all species, and population of i species (Magurran, 1988; Scharer et al., 1991; Koellner et al., 2004; Chiarucci et al., 2008; Gotelli and Chao, 2013). Ecological Methodology
(Krebs, 2002) and Estimate S 910 Windows (Colwell, 2013) were used to analyze the data.
RESULTS AND DISCUSSION
Combining results from several traps, number of arthropod species and the same species found in all strata of shade tree were the highest in the cocoa plantationin two strata of shadetree, 186, and 34 species respectively.
Based on Table 2, the diversity of arthropods in three strata of shade tree of cocoa plantation showed the difference in the number arthropod species number and 20 species of the same species found in all strata types. The population of arthropod was the highest in the cocoa plantation with no shading (30,464 arthropods), and it was followed by one and two types of shading such as 28,270 and 25,736 arthropods, respectively.
Table 2. Species number, population of arthropod, and the same species were found in all types of shade tree of cocoa plantation
the diversity increases, the dominance of species will decrease.
There were differences of species richness R, species evenness E, and species diversity (Shannon H` and Simpson index D) in cocoa plantation under the three types of shade tree (Table 3). The result showed that species richness (R) of arthropods under the two strataof shadetree, species evenness (E) and both of species diversity indices Shannon (H`) and Simpson (D) werethe highestand followed by one stratumof shade treeand without shade tree. High diversity indices shown by the cocoa plantation under two strataof shade treewas closed to high diversity of vegetation. Two strataof shade treehaving high heterogeneity of vegetation seems to be key factor to create the highest value of all diversity indices. The species diversity indices especially Shannon index, one and two strata of shade tree were higher than 3.322. Both one and two strata of shade tree were high in diversity and productivity, stable or balanced in their ecosystem. Shade trees as non crops orvegetation surrounding cultivated area providedshelter, pollen and nectar as food supplement or alternative host and prey for natural enemies(Dryer and Landis, 1996; Dryer and Landis, 1997; Menalled et al., 2004), breeding site for natural enemies (Karindah et al., 2011) suitable microclimate (Plowright et al., 1993), and shading (Davis et al., 2001).
Difference in species richness, diversity and evenness of arthropod species in cocoa plantation under the three strata of shade tree occurs because the community structure of two strata of shade tree in cocoa plantations was more heterogeneous and had a more diverse structure ofland scape elements. It is compatible with the results of the research Marino and Landis (1996) emphasizing that species richness is influenced by landscape structure. In addition, Weibull et al. (2003) stated that generally on a plantation scale, species richness increased with landscape heterogeneity. The importance of species richness for its rich diversity Productivity and ecosystem services such as pollination, pest and disease control and seed dispersal (Mudjiono and Khairiah, 2014), increasing diversity through soil biological activity, nutrient cycling, increased arthropods (Altieri, 1999) could result from species richness. The percentage of species similarity in values were followed by both combinations such as two and without shade tree and one stratum and without shade tree.
Table 3. Diversity indices of arthropods in three strataof shade treeof cocoa plantation
Types of shade tree of cocoa plantation
Table 4. Percentage of Species Similarity in three strata of shade treeof cocoa plantations
Types of shade treeof
cocoa plantation Total species number
Same species were found in
all strataof shade tree ISS (%)
Two+ one stratum One + withoutshade tree Two + without shade tree
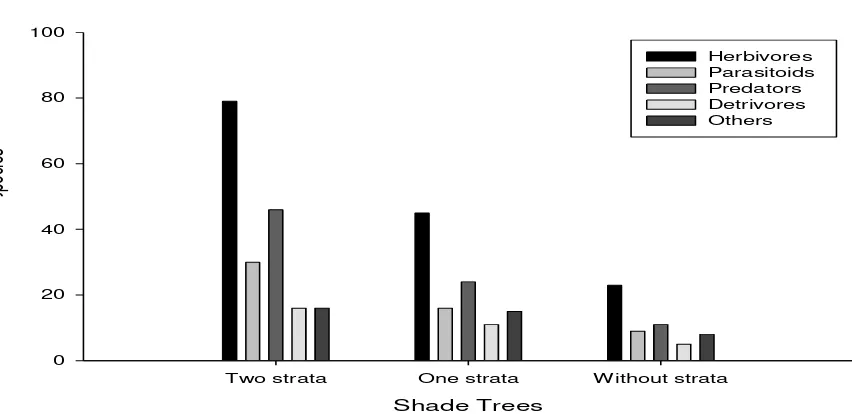
Figure 1. Population of each arthropod in all strata of shade tree of cocoa plantation based on its ecological function/roles
Figure 1, Population of arthropods in all strata of shade tree based on their ecological roles contained the population of herbivores, parasitoids, predators, detritivores and others. In two strata of shade tree of cocoa plantations, the population was the highest, followed by one stratum of shade tree and without shade tree of cocoa plantation.
High population of herbivores in cocoa plantation under two strata of shade tree caused low intensity of damage on cocoa, it was related to the population of parasitoids and predators. The population of both natural enemies was also high and could reduce the population of herbivores. Hymenoptera and Diptera as parasitoid group collected in cocoa plantation under two strata of shade tree were 29 and 1 species, respectively. Coleoptera, Hymenoptera, Diptera, Neuroptera, Pseudoscorpionida, Hemiptera, Dermaptera and Araneae were recorded as predator group with 9, 13, 16, 1, 1, 1, 2 and 5 species, respectively. Parasitoid and predator belong to natural enemies of plant pest (herbivore), they can protect plants from damage caused by insect herbivores (Rodriguez-Saona et al., 2012). Natural enemies are capable of improving their function by increasing the diversity within crops in agricultural systems (Rodriguez-Saona et al., 2012) and shade trees as non crop can be used to enhance their function by providing shelter, food and
microclimate (Dryer and Landis, 1996). Stability of ecosystem can be supported by composition of detritivores, parasitoid, predators and herbivores when there is no dominance by such species (Mudjiono et al., 2013). In case of Cocoa plantation under one stratum of shade tree, species number of herbivores was fewer than that of two strataof shade tree; it was caused by parasitoid and predator species in cocoa plantation under one stratum of shade treelower. In addition, detritivore contributed to maintain the predator as food especially above-ground predators (Wu et al., 2014).
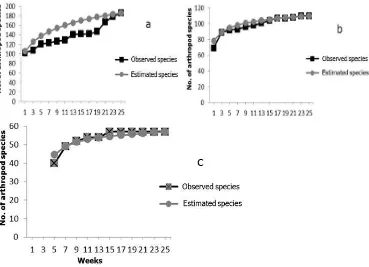
Figure 2, curves of growth rates of arthropod species number in cocoa plantation under three strata of shade tree, shows that there was similar tendency between each stratum of shade tree. But they showed differences between each other especially at the starting and the end of points. In Figure 2a, two strata of shade tree, the numbers of arthropod species at 1st and 25th week were 102 and 186 species, respectively. Figure 2b representing one stratum of shade tree, shows that the numbers of arthropod species at 1st and 25th week were 69 and 110 species. Last Figure 2c, without shade tree, shows that the number of arthropod species at 1st and 25th week were 40 and 57 species, respectively.
Shade Trees
Two strata One strata Without strata
No. of
spec
ies
0 20 40 60 80 100
Herbivores Parasitoids Predators Detrivores Others
No
o
f
Sp
e
c
ie
Figure 2. Curves of Growth rate of species number and estimated species in cocoa plantation under the three strataof shade tree(a) twostrataofshade tree; (b) one stratumof shade tree; and (c) without shade tree
CONCLUSIONS
From the survey it could be concluded that 1). In cocoa plantation under two strata of shade tree, Species Richness (R), Species Evenness (E), Shannon and Simpson index were the highest with value 18.216, 0.839, 4.383 and 0.833 respectively. Condition of this plantation was relatively stable, and the composition of arthropods can support the ecosystem balance. 2). In Cocoa plantation under one stratum of shade tree, species richness (R), species evenness (E), Shannon and Simpson index were lower than those of two strata of shade treewith value of 10.635, 0.714, 3.356 and 0.683. The composition of arthropods can support the ecosystem balance. 3). In Cocoa plantation without shade tree, species richness (R), species evenness (E), Shannon and Simpson index were the lowest with value of 5.424, 0.497, 2.011, and 0.450. The number of major pest occurred, and the composition of arthropods is incapable of supporting the ecosystem balance.
ACKNOWLEDGMENTS
This manuscript is a part of the first author’s dissertation for doctoral program at University of Brawijaya. Gratitude is expressed to Directorate General of Higher Education for funding this study through BPPDN.
REFERENCES
Altieri, M.A. 1999. The ecological role of bio-diversity in agroecosystems. Agriculture, Ecosystems and Enviroment 74: 19-31 Altieri, M.A. and C.I. Nicholls. 2004. Biodiversity
and pest management in agroeco-systems. Second edition. The Haworth Press. USA. p 3-45.
Anonymous, 2014. Species diversity measure-ment (in Indonesian). http://www. Fbio. unsoed.ac.id/files/AnalisisKeaneka ragam-an Ekosistem.ppt. Jragam-anuary, 10, 2014. Bradley, JD. 1986. Identity of the South-East
Asian cocoa moth, Conopomorpha cramerella (Snellen) (Lepidoptera: Gracillariidae), with descriptions of three allied new species. - Bulletin of Entomo-logical Research 76(1): 41–51.
Chiarucci, A.,G. Bacaro, D. Rocchini and L. Fattorini. 2008. Discovering and rediscovering the sample-based rarefraction formula in the ecological literature. Akademiai Kiado. Budapest. Community Ecology 9(1): 121-123. Colwell, R.K. 2013. Statistical estimation of
species richness and shared species from samples. New Version:EstimateS 9.1.0. Departemen Ekologi and Evolusi Biologi, University of Connecticut, USA http://viceroy.eeb.uconn.edu/estimates. December, 30, 2013
Davis, A.J., J.D. Hololway, H. Huijbregts, J. Krikken, A.H. Kirk-spriggs and S. Sutton, 2001. Dung Bettle as indicators of change in the forest Northen Borneo. Jurnal Apply Ecol. 38:593–616.
Disbun Sulteng, 2012. Statistical data, farming production and area. Farming Agency of Central Sulawesi. Palu. p. 27-35.
Dryer, L.E. and, Landis D.A. 1996. Effect of habitat, temprature and sugar availability on longevity of Eriborus terebrans (Hym: Ichneumonidae). Environ. Entomol. 25: 1192 –1201.
Dryer, L.E. and D.A. Landis. 1997. Influence of non-crop habitat on distribution of Eriborus terebrans (Hym:Ichneumonidae) in cornfields. Environ. Entomol. 26: 924 - 932.
Firdausil, A.B., Nasriati, A. Yani. 2008. Techno-logy in Cacao Cultivation (in Indonesian). Study and Development Centre in Agricultural Technology, Research and Development Centre. Bogor. p.1-26. Gotelli,N.J. and A. Chao. 2013. Measuring and
estimating species richness, species diversity, and biotic similarity from sampling data. In: Levin S.A. (ed.) Encyclopedia of Biodiversity. Second edition. 5: 195-211.
Karindah, S.,A. Purwaningsih,A. Agustin and L.P. Astuti. 2011. Preference of Anaxipha longipennis Serville (Orthop-tera:Gryllidae) to Certain Types of Weeds in Rice Fields as Spawning Site (in Indonesian). J. Entomol. Indon. 8(1):27-35
Koellner, T., A.M. Hersperger and T. Wohlgemuth. 2004. Rarefaction method for assessing plant species diversity on a regional scale. Ecography 27: 532-544. Krebs, C.J. 2002. Program for ecological
metodology. 2nd.ed.
Knops, J.M.H., D. Tilman, N.M. Haddad, S. Naeem, C.E. Mitchell, J. Haarstad, M.E. Ritchie, K.M. Howe, P.B. Reich, E. Siemann and J. Groth. 1999. Effects of plant species richness on invasion dynamics, disease outbreaks, insect abundances and diversity. Ecol Lett 2: 286–293.
Kruess A and T. Tschartntke. 2000. Spesies richness and parasitism in a fragmented landscape: experiments and field studies with insects on Vicia sepium. Oecologia 122:129-137.
Ludwig, J.A. and J.F. Reynolds.1988. Statistical ecology: A primer on methods and computing. John Wiley and Sons. USA. p. 83-103
Magurran, A.E. 1988. Ecological diversity and its measurement. Princeton University Press. New Jersey. p. 127-167.
Marino, PC. and D.A. Landis. 1996. Effect of landscape structure on parasitoid diversity and parasitism in agroecosystem. Ecolo-gical Application 6(1): 276-284.
Menalled, F.D., J.M. Alvarez and D.A. Landis. 2004. Molecular techniques and habitat manipulation approaches for parasitoid conservation in annual cropping systems in Ecological engineering for pest management: Advances in habitat manipulation for arthropods. Edited by Geoff M. Gurr, Steve D. Wratten and Miguel A. Altieri. CSIRO Publishing. p. 101-106
Mudjiono, G., H. Tarno and S.R. Prihadianto. 2013. The biodiversity of arthropods in orchid plantation with different altitude field. Department of Pest and Plant Disease Faculty of Agriculture University of Brawijaya. Malang p. 1-18.
Plowright, R.C., J.D. Thomson, L.P. Lefkovitch and C.M.S. Plowright. 1993. An experimental study of the effect of colony resource level manipulation on foraging for pollen by worker bumble bees. Canad. J. Zool. 71: 1393-1396. Price, P.W., 1997. Insect ecology. Third Edition.
John Wiley and Sons Inc. New York. Chichester, Weinkeim, Brisbane, Singa-pore, Toronto. p. 227-298
Rodriguez-Saona C., B.R. Blaauw and R. Isaacc. 2012. Manipulation of natural enemies in agroecosystems: Habitat and semiochemicals for sustainable insect pest control in integrated pest management and pest control – current and future tactics. Edited by Soloneski. In Tech. p. 89-126
Scharer, H.M, T.M. Lewinsohn and J.H. Lowton. 1991. Searching for weed biocontrol agents-when to move on?. NERC Centre for Population Biology, Imperial College at Silwood Park, Ascot, UK. Biocontrol Science and Technology I, 271-280
Sulistyowati, E and S. Wiryadiputra. 2008. Development of Integrated Management techniques for cacao borers (Conopo-morpha cramerella) (in Indonesian). Cacao Symposium Proceedings. Denpasar. p.125 - 144
Susanto, F.X. 1994. Cacao, yield cultivation and process (in Indonesian). Kanisius Yogyakarta. p. 112-126.
Sutrisno and Winahyu. 1997. Cacao cultivation and process (in Indonesian). Farming Research Centre, Jember.
Untung, K. 1993. Introduction to integrated pest management (in Indonesian). Second Edition. Gadjah Mada University Press. p.189-212.
Weibull, A.C.,O. Ostman and A. Granqvist. 2003. Species richness in agroecosystems: the effect of landscape, habitat and plantation management. Conservation and Biodiversity 12: 1335-1355.
Wiryadiputra, S. 1993. Study in biological aspects and methods in cacao borers management (in Indonesian). Newsletter of Coffee and Cacao Research Centre 15: 4-12.
Woltz, J.M., R. Isaacs and D.A. Landis. 2012. Landscape structure and habitat management differentially influence insect natural enemies in an agricultural landscape. Agriculture Ecosystems and Environment 152: 40–49.