CHAPTER III
RESEARCH METHODOLOGY
In this part, this researcher would like to discuss of the researcher type, research design, , population and sample, research instrument, data collection, data analysis, it is purposed to answer the problem of the study. This chapter consists of time and place of the study, research design, data collection procedure and data analysis procedures, instruments of the study, and instruments try out.
A. Research Type
The type of this study is descriptive study. The study uses the descriptive method because the problem of the study will answer by using descriptive method to describe the students’ ability in using mind mapping technique in writing
descriptive text. B. Research Design
The present researcher design of this study is quantitative descriptive research. It means that the researcher performs the data by treating the subjects which are investigated.
C. Population and Sample 1. Population
Population is defined as all members of any well defined class of people events, or objects. If someone wants to research all of the elements in research are, his/her research is called population research on census study.1
1Ibid.,
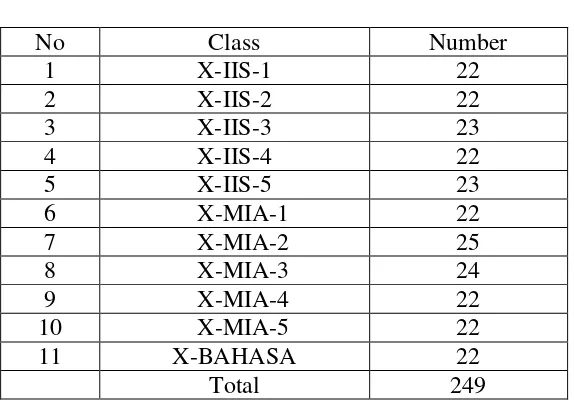
The populations of the researcher are all the students of the 10th year student of SMAN-3 Palangka Raya. Amount 249 Students in eleven class: X-IIS-1. X-IIS-2. X-IIS-3. X-IIS-4. X-IIS-5.X-MIA-X-IIS-1. X-MIA-2.X-MIA-3. X-MIA-4. X-MIA-5. and X- IBBU(Bahasa).
This is shows in the following table. Table 3.1 group of individuals who are naturally together or grouped by the school. In this study X- IBBU (Bahasa). The researcher takes 22 students as the sample of the study. Therefore, the study is called population research.
2
D.Research Instrument 1. Test
The test used to collect the data is in the form of writing test, especially descriptive text writing using mind mapping technique. The test consists of the instructions and chosen. In this sense, the students are assigned to choose one of topics that interest of the students and based on the mind mapping. They asked to develop the topic into a text containing about 100-150 words. The allocated time to do writing test is 60 minutes.
2. Observation
The construction is based on the objective of the study. The study is aimed at finding the using of mind mapping across the different level of students achievement in writing descriptive text at 10th year students at SMAN-3 Palangka Raya.
To gain the appropriate writing test for the aim of this study, the researcher does some steps; (a). Planning the writing test,(b). Preparing the writing test,(c).The test and analyzing the result.
3. Documentation
Documentation is searching the data. The purpose in using documentation in this research is to support the data that is gotten in the field so the data is admitted the data validity. Arikunto also gives statements that “Documentation to
other. The documentation is a technique in collecting data by using documents of
writing that is gotten and related to the data needed.”3 Those documents such as:
1. The students’ name as subject
2. The students’ worksheet
3. The result of the students’ score a. Planning the writing test
To produce a good writing test, the researcher makes plan on the test construction. In this sense, the objective of the test is determined, then, the researcher decides the appropriate type of test. The test type and test objectives are very close. The test objective cannot be achieved without having appropriate test type. Then, the researcher cares for the adequacy of thee content.
4.Research Instrument Reliability
Reliability is necessary characteristic of any good test for it to be valid at all. A test must be reliable as a measuring instrument. It is the degree of consistency with which it measure wherever it is measuring. 4To know whether the reliability of the test is very high, high, average, low, and very low, the present researcher refered to the following standar:
0.80 – 100 = Very high
Arikunto, Suharsimi, Prosedur Penelitian. Jakarta: Rineka Cipta. 2002, p.127
4
0.00 – 0.19 = Very low 5. Rater Reliability
Reliability refers to the consistency with which a test measured whatever it measured. 5In this study; reliability of the writing test mainly focuses on the rater reliability since the score are obtained from the judgment of two different raters. Here, the consistency can be achieved through rater training.
In rater reliability, there are inter rater. In this study the researcher use inter rater reliability, inter rater reliability indicates accuracy in compositions of different raters. In addition, there are some procedures to measure an estimate of test reliability: test retest, parallel, split half, Kuder-Richardsin (K-R 21), and rater reliability. In this case, the researcher will apply the coefficient correlation and interpretation of in rater reliability proposed by Whinkle et as show on table:
Table 3.2 correlation low positive or negative correlation
.30 to .49 or- .30 to-49 Low positive or negative correlation .00 to .29 or - .00 to-29 Little if any correlation
5
a. Test Reliability
Reliability is the accuracy of the tool in evaluating what is going to be evaluated. Reliability shows that the instrument can be used to collect the data if the instrument was valid.
To know whether the reliability of the test is very high, high, average, low, and very low, the present researcher refered to the following standard:
0.80 – 100 = Very high 0.60 – 0.79 = High 0.40 – 0.59 = Average 0.20 – 0.39 = low 0.00 – 0.19 = very low
6. Researcher Instrument Validity
Validity refers to the degree to which a test measures what is supposed to measure Suharsimi, says “that an instrument called valid if it is able to measure what should be measured.” The goal measurement is for getting illustrated clearly about the investigation variable she defines content validity as essentially the systematic examination of the test content to determine whether it covers a representative sample of the behavior to be measured. She also provides a set of useful guidelines for establish content validity.
1. Face Validity
The types of face validity, if the test items look right to other testers, teacher, indicators and test. The types of test items, which use in this research.
1). The test uses written test In essay test instruction. 2). The evaluation by essay test beside on scoring system. 3). Kind of essay test is writing descriptive text
4). The Language of items use English a. Content Validity
This kind of validity depends on a careful analysis of the language being tested being testes and of the particular course objective, the test should be constructed as to contain a representative sample of the course, the relationship between the test items and ours objective always being apparent.6
b. Construct Validity
It is capable of measuring certain specific characteristics in accordance with a theory of language behavior and learning. This type of validity assumes the existence of certain learning theories or constructs underlying the acquisition of abilities and skill.7 After the instrument finished check by the judgment experts, continued testing of construct validity. It is conducted by field test. In order to find the validity, product moment Correlation used as the formula to calculate from the try-out test result. The formula is as follows.
) )
J. B. Heaton, Writing English Language test, Longman, 1994, p. 154.
7Ibid
: Total Value of Score Y
: Multiplication Result between Score X and Score Y
: Number of Students
Furthermore, it will calculate using Test-t Calculation as follow:
t observe = √
√
Where:
t = The Value of t observe
r = The coefficient r observed
n = Number of students
The distribution of ttable at alpha 5% and the degree of freedom (n-2) with the
measurements of validity using the criteria below:8 txy>tt = Valid
rxy<tt = Invalid
To know the validity level of the instrument, the result of the test interpreted to the criteria below:
0.800-1. 000 = very high validity 0.600-0. 799 = High Validity 0.400-0. 599 = Fair Validity 0.200-0. 399 = poor validity
8
0.00-0.199. 1= Very poor Validity E. Data Collection
Data collection is to get accurate in this study, the research selects the instruments that appropriated for the problem statement, there are:
1. Documentation
Documentation method is used to look for the data concerning matters or the variable that are take in the form of the note, transcript, book, newspaper, magazine, inscription, notulen, lengger, agenda, etc. it refers to the archival data that help the writer to collect the needed data.
2. Test
Test is set of questions or exercises and other tools which are used to measure skill, intelligence, knowledge, and ability those are hard by individual or group.9 This method is used to get data about score of the pre-test and post-test that was given for both of groups.
A. Data Analysis
The data of this study are passing grade and under passing grade students writing score. Therefore the data are in quantitative data. The data are analyzed by means of inferential statistics. This statistical analysis is suitable to use to answer the research problem. In Order to analyze the data, the writer did some procedures:
1). Collecting the students written scores of first, second, and third test.
2). Arranging the obtained score into the distribution of frequency of score table
9Ibid
The percentages of correct answer grade: 81 – 100%
61 – 80% 41 – 60% 21 – 40% 0 – 20%
Excellent Good
Figure 3.1
Steps of Collecting, Data Analysis Procedure and Test of Descriptive Text.
Writing Class
Writing Descriptive Text
Test 1
Test 3 Test 2
Scoring
Discussion