CHAPTER III RESEARCH METHOD
In this part, the researcher describe about research methodology that used in
conducting the research. It purpose to answer the problem of the study. This chapter
consist of: Research design, variable, population and sample, data collecting
procedures, instruments of the study, and instrument try out.
A. Research Design
The study used counterbalanced design. Counterbalancing is usually thought of
as a method for controlling order effects in a repeated measures design.The study
used counterbalanced design. A counterbalanced design, another design that can be used with intact class groups. For example, the experimental class might use methods
A and B, respectively, for the first half of the experiment class receives treatments in
the order AB, and exchange method for the second half in the order BA. The
distinctive feature of this design is that all subjects will receive all experimental
treatments but in a different order. In effect, this design involves a series of
replications; so at the end of the experiment group will expose to each X.1
In a counterbalanced design to control for order effects, we use separate groups
of subjects, each group receiving treatments in a different order. If there are two
treatments, (say, A and B), Group 1 receives treatments in the order AB, and Group 2
1
Donald Ary, Lucy Cheser Jacobs, Chris Sorensen and Asghar Razavieh, Introduction to Research in Education (Eight Edition), United States: Wadsworth Cengage Learning, 2010, p. 647.
receives treatments in the order BA. If you create a group for each possible order,
then the variance due to order effects becomes a separate source of variance, making
for a more powerful design. 2
Table 3.1
The scheme of counter balanced procedure
Session Treatment
Session 1 Outline Non Outline
Session 2 Non Outline Outline
B. Variable of the study
According to Burhan Bugin : variable is the phenomenon that variation in type,
quality, quantity, standard pearl.
As the experimental study, there are two variables of the study, they are:
1. The independent variable of study (X) is outline technique that is used in
writing descriptive text
2. The dependent variable of the study (Y) is the students’ score in writing
descriptive text.
2
C. Population and Sample 1. Population
Population is the larger group to which a researcher wishes to
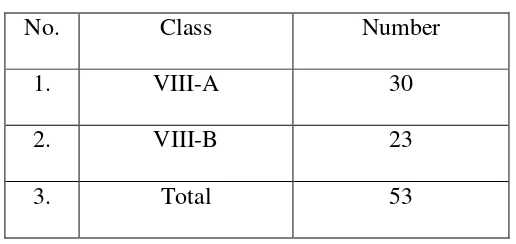
generalize.3The population of this research was all the students of the
Eightgrade MTs. An-Nur Palangka Raya. Amount 53 Students in two classes:
VIII A and VIII B
Table 3.2
Population of the study
No. Class Number
1. VIII-A 30
2. VIII-B 23
3. Total 53
2. Sample
Sample is subset of Individuals or case from within a population.4To
determine the students as experiment group the writer used cluster sampling.
After doing random class the writer will find a class for sampling research. The
class is already established, the subject cannot be randomized, it is called quase
experiment research.
3
John W. Creswell, Qualitative and Quantitative Approach, 1994, California: SAGE Publication, Inc, 1994, p. 64.
4
D. Research Instrumentation
This part explains the test, as a research instrument, used to collect the data. It
covers the types, test construction and test validity and reliability.
The data are very important in the study. The data are needed to prove and
support this study. By this collected data, the researcher could measure the
effectiveness of outlining strategy in prewriting technique on the students’ ability in
writing descriptive text at MTs AN-Nur Palangka Raya.
1. Test Type
A test is a set of stimuli presented to an individual in order to elicit responses
on the basis of which a numerical score can be assigned. This score, based on a
representative sample of the individual’s behavior, is an indicator of the extent to
which the subject has the characteristic being measured.5The data were needed to
prove and support this study. By this collected data, the researcher could measure the
effectiveness of outline on writing ability of the eightgrade students of MTs AN-Nur
Palangka Raya. The types of the test are in the form of writing test, especially writing
descriptive text by using outline technique and without using outline technique
Since the research design of this study is counterbalanced design, the writer gives
pretest and posttest to the students.
a. Pretest is a preliminary test that has purpose the measure the students’ score in
writing before having treatment.
5
b. Posttest is attest given after a lesson or a period of instruction to determine
what the students have learned. The purpose of posttest is to measure the
students’ score in writing after the manipulation has been done by the teacher.
According to Heaton "Test may be constructed primarily as devices to reinforce
learning and to motivate student, or primarily as a means of as seeing the student's
performance the language.6
The researcher collected the main data from pretest and posttest. From the two
tests, the researcher could find out the effectiveness of outline technique on writing
ability of eightgrade students of MTs AN-Nur Palangka Raya. A pretest gave before
treatment. By gave the pretest the researcher compared that scores to the posttest
scores which gave after the treatment. A posttest as the last test also gave to get the
quantitative data about their writing ability after the researcher taught descriptive text
with outline technique.
In this study, the writer applied inter-rater reliability; two raters employed to
score the students’ writing.
2. Test Construction
The test construction is based on the objectives of the study. The study is
aimed at finding out the effectiveness of using outline technique in writing
descriptive text. To measure the effectiveness of using outline technique in
writing descriptive text, the subjects are assigned to write descriptive text and will
be corrected by using outline technique. The results of the tests are to measure
6
using statistical analysis and the outcomes are comparing to see the effect of using
outline technique in writing descriptive text.
To obtain the appropriate writing test for the aims of the study, the
researcher does some types: (1) planning the writing descriptive text test, (2)
preparing the writing test, (3) trying out (pre testing) the test and analyzing the
results, and (4) carrying out the test.
a. Planning the writing descriptive text test
To produce a good writing test, the writer made a plan on the test
construction. In this sense, the objective of giving the test is determined. Then the
writer decided the appropriate type of test. The test types and test objective were
very close. The test objective could not be achieved without having appropriate
test types. Then, the writer cares for the adequacy of the content. The test content
should match with the test types and objective. Lastly, the time allocation for the
test administration was planned as well as the instruction tried out.
b. Preparing the writing descriptive text test
The writing test was used to elicit the data covering directions and instructions
of what the subjects have to do. To make the instruction clear and understood by
the students, the instructions were made simple. The instruction is accompany
with several alternative topics are the ones the students know and familiar and can
develop into compositions.
To construct the test directions, the writer taked into account to guidelines
question should be brief; (c) the instruction should be definite; (d) avoid questions
requiring yes or no answer; (e) average students should be able to write average
answer to questions; (f) the vocabulary used and the concepts expressed in the
topic should not be too difficult for the ordinary students to understand to
understand immediwalately; and (g) the instruction should provide an organizing
principle for composition.7
The students’ task was to write a descriptive text. The writing instruction was
design to measure the students’ writing ability. The students’ writing ability was
scored on the basis of the marking scheme that contains some features or
components of writing, such as content, organization, sentence structure and
grammar, usage and mechanics of the students’ writing. The proposed time
allocation to do writing is 80 minutes.
c. Test Try Out
In order to prove the test wassuitable to the students who were the sample of
this study, the writer would conducted a try out test. Then the writer choosed
students in different class to try out the test. Then the writer choosed student in
different class to try out the test. The try out the test will conduct to eightgraders
of MTs AN-Nurpalangka Raya. If the result was valid, it means the test item as
the instrumentation of this study is suitable to be given.
7
3. Test Instrumen Validity
Validity is a measurement which shows the grades of number of an
Instrument. A valid Instrument must have high validity, it means that an
Instrument which lacks validity is said to be Invalid instrument.
An instrument is called a valid one when it can measure something which is
wanted by covering the variable studied exactly. The method used in measuring
the validation of the instrument is called content validity. A test or a measurement
can be called a content test when it measures the special purpose which is equal
with the material or content given.
a. Face Validity
The types of face validity, if the test items look right to other testers, lecture,
indicators and test. The types of test items, which would use in this research, can
be suitable to the others at the same level of sevent grades students of MTs
AN-Nur Palangka Raya.
For face validity of the test items as follow:
1. The test used writing test.
2. The evaluation by essay test based on scoring system.
3. Kind of the essay test is descriptive text.
4. The language of items used English for writing test.
5. The written test was suitable with syllabus of English writing for second
2. Construct Validity
It is capable of measuring certain specific characteristics in accordance with a
theory of language behavior and learning. This type of validity assumes the
existence of certain learning theories or constructs underlying the acquisition of
abilities and skill.8 After the Instrument finished check by the judgment experts, continued testing of construct validity. It is conducted by field test. In order to
find the validity, product moment Correlation will use as the formula to calculate
from the try-out test result.To measure the validity of the instrument, the writer
used the formulation of Product Moment by Pearson as follows9:
xy
∑ XY : Multiplication Result between Score X and Score Y
N : Number of students
Furthermore, it was calculated using Test-t calculation below:
8Ibid , P. 154 9
tobserved
r = The coefficient of correlation of the result of robserved
n = Number of students
The distribution of ttable at alpha 5% and the degree of freedom (n-2) with
the measurement of validity using these criteria:
To know the validity level of the instrument, the result of the test was
interpreted to the criteria or the correlation index as follows: 0.800 – 1.000 = Very High Validity
Ridwan, Metode dan Teknik Menyusun Thesis, Bandung: Alfabeta, 2004, p.110. tobserved> ttable = Valid
1. If the value of tobserved is greater than ttable, it means thet the test item is valid and it can be used as the instrument of the study.
2. If the value of tobserved is lower than ttable , it menas that the test item is invalid and it cannot be used as the instrument of the study
c. Content Validity
Content validity demands the appropriateness between the ability to be
measured and the test being used to measure it.12The researcher used writing test
for students. The students in this study would write descriptive text from essay
test instruction, so the test would really measures the writing ability. The
instrument which is using test, the tasting of content validity is done by asking the
opinion of the judgment experts about the instrument is able to try out or not.
4. Research Instrument Reliability
Reliability is a necessary characteristic of any good test for it to be valid at all.
A test must first be reliable as a measuring instrument. It is the degree of
consistency with which it measures whatever it is measuring.13 Similarly, Sekaran
states that reliability is the extent of consistency and stability of the measuring
instrument. In this case, to score composition as fairly and consistently as
possible, the researcher uses inter rater method (test of reliability). Inter-rater
11Ibid , p. 112 12
M.Soenardi Djiwandono, Tes Bahasa dalam Pengajaran, Indeks, Jakarta. Cetakan pertama, 2008, p. 92.
13
reliability is the consistency of the judgment of several raters on how they see a
phenomenon or interpret the responses of the subjects.
In this case, the two raters employed the score students’ writing. The two
raters are the researcher and the English teachers who have lot of experience in
teaching English language in senior high school. One important thing in using the
inter rater method in rating process is focused with the training of the raters. It can
maximize the accuracy of the writing assessment. This makes the raters be
consistent in scoring and avoid subjectivity of the raters in scoring. For this
purpose, the training is done to get inter rater agreement in order to give reliable
scores to students’ writing product.
Relevant to this, Nunan states that the acceptance reliability on composition
score is possible to get through careful training of raters.14 Furthermore, Latief
argues that reliability on composition is affected by both raters and writers of the
text. Raters’ reliabilityrefers to the accuracy of the raters’ judgment. Meanwhile,
writers’ reliability refers to the accuracy of the writers’ performance.15
To obtained inter-rater reliability, the score of two raters were correlated using
SPPS program. Then the writer got the interpretation of coefficient correlation,
whether they belong to high, moderate, or positive weak negative inter rater
reliability category. The obtained coefficient should indicate that the students
14
David Nunan, Research Methods in Language Learning,Cambridge: Cambridge University Press,1992 , p. 56
15
writing product both using clustering technique and without clustering technique
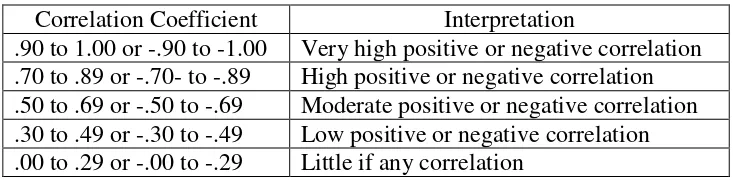
have achieved the acceptable level reliability. Calculation result of r was compared with rtable by 5% degree of significance with df=N-2. If r was higher than rtable so it meant reliable and if r was lower than rtable so it meant unreliable. In this case, the writer applied the coefficient correlation and interpretation of
inter-rater reliability proposed by Winkle et al as shown in table 3.3.16
Table 3.3
Inter-Rater Coefficient Correlation and Interpretation
Correlation Coefficient Interpretation
.90 to 1.00 or -.90 to -1.00 Very high positive or negative correlation .70 to .89 or -.70- to -.89 High positive or negative correlation .50 to .69 or -.50 to -.69 Moderate positive or negative correlation .30 to .49 or -.30 to -.49 Low positive or negative correlation .00 to .29 or -.00 to -.29 Little if any correlation
The writer used formula of Kuder and Richardson to measure the
reliability of the questionnaire test17:
Where:
r11 = coefficient alpha
16
Antony C. Winkle, and Jo Roy Mc Cuen, Writing the Research Paper, Orlando: Harcount Brace Jovanic Publisher, 1989, p.35.
17
Sugiyono. Metode Penelitian Administrasi. Bandung, Alfabeta, 2007, p.137
k = number of items
M = the mean score on the test for all the testers
Vt = the standard deviation of all the testers’ score
E. Data Collection
To measure the research problem:Does outline technique give effect on writing
ability of the eightgrade students at MTs AN-Nur Palangka Raya?
To collect the accurate data in this study, the writer selects the instruments that
appropriated for the problem statement:
1. Documentation
Documentation method is used to look for the data concerningmatters or the
variable that are taken in the form of the note, transcript,book, newspaper,
magazine, inscription, notulen, lengger, agenda, etc. itrefers to the archival data
that help the writer to collect the needed data. Inthis study, this method is used to
get the data that related to the object ofresearch such as students’ name list which
are included in the population.In this case, the data was gained by the help of the
English teacher
2. Test
Test is a set of questions or exercises and other tools which areused to
measure skill, intelligence, knowledge, and ability those are hadby individual or
group.18 This method is used to get data about score of the pre-test and post-test
that was given for both of groups.The test in this study is an essay test. In essay
18
test of writing, the students were given a free chance to think as much as possible.
They can freely express and organize their ideas in written form.
a) Pre- test
Before the teacher teached new material by using outline technique, the
teacher gave test to the students. Pre-test was given to the experiment group and
the control group. Thes test was given before the experiment applied.
b) Post- test
Post-test was given to the experiment class and the control class. The test
was given in order to know the improvement of students’ writing abilityin
writing report text. The post-test gave to the experiment group and control
group after receiving treatment. The experimental groups taught writing
descriptivetext using outline technique the control groups taught writing writing
descriptivetext without outline technique.
For collecting the data, the researcher used some steps in the procedure as
follows:
1. The researcher observed the class
2. The writer determined the class into experimental group and control group.
3. The writer given Pre-Test to experimental group and control group.
In the pretest. the writer was given test for both group; writing test (to
measure students writing ability). This test was given for both group to
4. The writer analyzed the result of pre test so that the data gained from the
test are valid and reliable.
5. The writer gave treatment to experimental group that taught by outline
technique and taught control group using free writing.
6. The writer gave a posttest to the experiment group and control group.
This posttest gave for two groups (Experimental and Control Group).
By using post test, the study was getting the score from both groups.
1. The writer gave score to the data from experiment and control group.
After post test is done by experimental and control group, the writer gave
scores combine with the pre test scores of both group.
2. The writer analyzed the data that have been obtained from pretest and
posttest.
3. The writer interpreted the analysis result.
The data that analyze should interpret. By interpreting the data analyze, it
answers the problem of study.
4. The writer concluded the activity of the study whether the outline technique
give effect to the students writing ability by using outline technique or not,
based on the obtained.
F. Data Analysis
The data of this is study students’ writing ability. Therefore, the data was in
quantitative data. The data was analyzed by means of inferential statistics. This
researcher applied t test to examine the students’ writing ability that tought using
outline technique in writing descriptive essay.
1. Techniques of Data Analysis
Before analyzing data using T Test, the writer fulfilled the requirements of
T Test. They are Normality test, homogeneity test and hypothesis test. a. Normality Test
It is used to know the normality of the data that is going to be analyzed
whether both groups have normal distribution or not.In this study to test the
normality the researcher applied SPSS 17 program level of significance =5%.
Calculation result of asymptotic significance is higher than α (5%) so the
distribution data was normal. In the contrary, if the result of an asymptotic
significance is lower than α (5%), it meant the data was not normal distribution.
b. Homogeneity Test
Homogeneity is used to know whether experimental group and control
group, that are decided, come from population that has relatively same variant
or not. To calculate homogeneity testing, the writer applied SPPS 17 program
used Levene’s testing with level of significance α (5%).
If calculation result was higher than 5% degree of significance so Ha was
accepted, it means both groups had homogeneous.
c. Testing Hypothesis
significance 5% t test could be applied to test a difference mean or more. The
steps are as follows:
1) Find out the grand mean (X) each group: 𝑋𝑡2 = 𝑋2−( 𝑋2 𝑁 )
2) Find out the sum of square among group:
SSt= ∑X2–
= each score squared, then summed
(∑Xt)2 = all the scores summed first, then this sum squared
4) The sum of squares within groups
SSw = SSt - SSb
5) Find out degree of freedom between group:
Dfb= G-1
6) Calculate the between-groups mean square (MSb) :
MSb = 𝑆𝑆𝑇
𝑑𝑓𝑏
Dfw= N-1
8) Calculate within group mean score (MSw) :
MSw = 𝑆𝑆𝑏
𝑑𝑓𝑤
9)Determining the level of significant of Fobserved by comparing the Fobserved
with the Ftable.
2.Data Analysis Procedures
To analyze the researcher did same ways in data analysis procedure, they
were as follows:
1. Collected the students’ written scores of Pre-test and post- test.
2. Arranged the obtained score into the distribution of frequency of score table.
3. Calculated mean, median, modus, standard deviation and standard error of
students’ score.
4. Measured the normality and homogeneity.
5. Analyzed the data by using t test to answer the problem of the study. In
addition, the SPPS program is applied.
6. Interpreted the result of analyzing data.
7. Make discussion to clarify the research finding.
8. Gave conclusion.
9. Summary
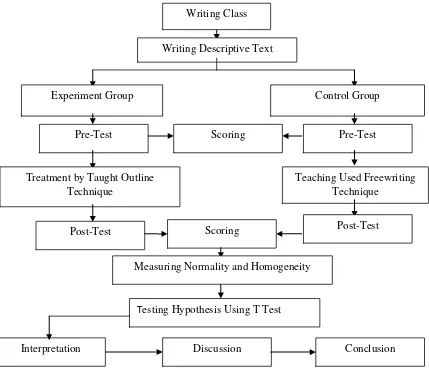
To sum up, the steps in collecting, analyzing, and hypothesis testing can
select the topic for descriptive text. The subjects were divided into two groups;
experimental group and control group. Experiment group was assigned to write
a descriptive text using outline technique and control group without outline
technique. Second step, the students writing both using outline technique or
without outline technique was scored by two raters. To analyze the data of
writing score, independent test was employed. T test is a statistical computation
used to test significant difference between within group and between groups.
Before testing the hypothesis, normality and homogeneity measured to fulfill
the assumptions. Third step, the researcher hypothesis would be test to answer
the research problem. Lastly, discussion on the results was made to clarify the
Figure 3.1 Steps of Collecting, Data Analysis Procedure and Testing Hypothesis
Writing Class
Writing Descriptive Text
Experiment Group Control Group
Pre-Test Scoring Pre-Test
Treatment by Taught Outline Technique
Teaching Used Freewriting Technique
Post-Test
Post-Test Scoring
Interpretation
Testing Hypothesis Using T Test Measuring Normality and Homogeneity