The microRNA body map: dissecting microRNA
function through integrative genomics
Pieter Mestdagh
1,*, Steve Lefever
1, Filip Pattyn
1, Dana Ridzon
2, Erik Fredlund
1,
Annelies Fieuw
1, Mate´ Ongenaert
1, Joe¨lle Vermeulen
1, Anne De Paepe
1, Linda Wong
2,
Frank Speleman
1, Caifu Chen
2and Jo Vandesompele
11
Center for Medical Genetics, Ghent University Hospital, Ghent, Belgium and 2Life Technologies, Foster City, CA, USA
Received April 28, 2011; Revised June 17, 2011; Accepted July 22, 2011
ABSTRACT
While a growing body of evidence implicates regu-latory miRNA modules in various aspects of human disease and development, insights into specific miRNA function remain limited. Here, we present an innovative approach to elucidate tissue-specific miRNA functions that goes beyond miRNA target pre-diction and expression correlation. This approach is based on a multi-level integration of corresponding miRNA and mRNA gene expression levels, miRNA target prediction, transcription factor target predic-tion and mechanistic models of gene network regu-lation. Predicted miRNA functions were either validated experimentally or compared to published data. The predicted miRNA functions are accessible in the miRNA bodymap, an interactive online compen-dium and mining tool of high-dimensional newly gene-rated and published miRNA expression profiles. The miRNA bodymap enables prioritization of can-didate miRNAs based on their expression pattern or functional annotation across tissue or disease sub-group. The miRNA bodymap project provides users with a single one-stop data-mining solution and has great potential to become a community resource.
INTRODUCTION
MicroRNAs (miRNAs) are small non-coding RNA mol-ecules that function as indispensible regulators of an increasing number of cellular processes (1–4). The exact role of an individual miRNA strictly depends on its spatiotemporal expression pattern and that of its targeted
genes. With >1000 mature human miRNA species re-ported thus far, miRNAs form one of the largest classes of gene regulators. While miRNA expression profiles have been established for various normal and diseased tissues, our understanding of specific miRNA function remains limited. To accommodate this, several experimental pro-cedures have been developed for high-throughput miRNA target identification such as RIP-chip (5) and HITS-CLIP (6). Unfortunately, these methods are technically challeng-ing and are typically performed for only one or few miRNAs, necessitating an up-front prioritization and se-lection of candidate miRNAs. Alternatively, computer-based miRNA target predictions can be used to gain insights into miRNA function by probing annotated gene sets for miRNA target enrichment (7,8). Of note, miRNA target prediction algorithms are prone to a high degree of false positives and completely ignore the tissue-or disease-specific nature of miRNA–target interactions.
Here, we present an innovative and sensitive method and accompanying resource to elucidate tissue-specific miRNA function by combining matching miRNA and mRNA expression data with miRNA target prediction and mechanistic models of gene network regulation. Inferred miRNA functions, based on different data sets, can be queried through the ‘miRNA bodymap’, a web tool available at www.mirnabodymap.org. To complement the functional predictions, we implemented an in-depth literature knowledge mining tool with result context high-lighting to retrieve experimentally validated miRNA func-tions. In addition, the miRNA bodymap contains high-quality RT–qPCR miRNA expression profiles for more than 750 human, mouse and rat samples, belonging to different tissue and disease types, which can be examined through a built-in miRNA expression analysis pipeline.
*To whom correspondence should be addressed. Tel: +32 9 3326979; Fax: +32 9 332 6549; Email: [email protected]
The authors wish it to be known that, in their opinion, the first two authors should be regarded as joint First Authors.
doi:10.1093/nar/gkr646
ßThe Author(s) 2011. Published by Oxford University Press.
This is an Open Access article distributed under the terms of the Creative Commons Attribution Non-Commercial License (http://creativecommons.org/licenses/ by-nc/3.0), which permits unrestricted non-commercial use, distribution, and reproduction in any medium, provided the original work is properly cited.
by guest on August 13, 2011
nar.oxfordjournals.org
MATERIALS AND METHODS
miRNA and mRNA expression data
RNA samples from 39 normal human tissues were ob-tained from Ambion and Biochain. Reverse transcription for 704 miRNAs, 18 small RNA controls and U6 was per-formed using stem–loop primers (Applied Biosystems) in single-plex reactions containing 45 ng of total RNA. qPCR reactions were performed in quadruplicate on a 7900 HT system (Applied Biosystems). Whole-genome stem–loop RT–qPCR miRNA expression data for over 700 additional samples were gathered from the literature. miRNA expression data were normalized according to the global mean normalization strategy (9). MiRNA expres-sion data can be obtained from the miRNA bodymap web tool (www.miRNAbodymap.org). Microarray mRNA ex-pression data were taken from GEO (GSE16558, GSE5846, GSE21713 and GSE1133).
Gene set enrichment analysis
For each individual data set, Spearman’s rank rho values were calculated for each mRNA–miRNA combination using normalized mRNA and miRNA expression values. mRNA–miRNA combinations with less than 10 pair-wise observations were excluded from the analysis. For each miRNA, mRNAs were ranked according to their correl-ation coefficient and ranked gene lists were used as input for GSEA. The following gene set collections were taken from the Molecular Signatures Database (MSigDB v3.0): chemical and genetic perturbations, gene ontology mo-lecular function and gene ontology biological process. Gene sets significantly enriched among the positive and negative correlating mRNAs were selected based on the GSEA FDR value (FDR<0.05). All analyses were per-formed using the R Bioconductor statistical programming platform (version 2.11).
Evaluation of miRNA target prediction databases
One-way ANOVA was used to analyze the impact of the miRNA target prediction algorithm on protein down-regulation. Two-by-two comparisons of individual predic-tion algorithms were performed by Tukey’s ‘honest significant difference’ method to identify significant differences.
miRNA and transcription factor target enrichment
For each miRNA, predicted targets were derived from the MIRDB database (10,11) and enrichment of these targets in the different gene sets was calculated using Fisher’s exact test. Fisher’s exact P-values were multiple testing corrected using the Benjamini–Hochberg algorithm. Gene sets that are enriched among the mRNAs that nega-tively correlate with an miRNA and that are enriched for targets of that miRNA were assigned to the multiple com-ponent targeting model. To determine the enrichment of transcription factor targets in the different gene sets, we used the transcription factor targets gene set collection from the MSigDB v3.0. Enrichments were calculated using Fisher’s exact test, andP-values were corrected for multiple testing using the Benjamini–Hochberg algorithm.
Gene sets that are enriched among the mRNAs that posi-tively correlate with an miRNA and that are enriched for targets of a transcription factor that is a predicted target of that miRNA (according to MIRDB) were assigned to the transcription factor targeting model.
30-UTR luciferase reporter assays
To evaluate miR-29a binding to the MYCN 30-UTR,
74-bp oligonucleotides spanning the predicted 30-UTR
miRNA binding site flanked by XhoI and NotI restriction sites were cloned into psicheck2 (Promega) as described previously (12). Oligonucleotides with a mutated binding site were used as control. DLD1Dicerhypo cells were seeded at a density of 10 000 cells per well in an opaque 96-well plate. Twenty-four hours after seeding, cells were co-transfected with a miR-29a pre-miR (Ambion) or nega-tive control pre-miR (Ambion) in combination with the 30-UTR construct using DharmaFECT Duo (Dharmacon).
Forty-eight hours after transfection, luciferase reporter
gene activity was measured using the Dual-Glo
Luciferase Assay System (Promega) and a FLUOstar OPTIMA microplate reader (BMG LABTECH).
pre-miR-29a transfection
SK-N-BE(2c) neurobblastoma cells were cultured in RPMI (Invitrogen) supplemented with 10% fetal calf serum and transfected with a miR-29a pre-miR (Ambion) or negative control pre-miR (Ambion) as described previously (13). Cells were harvested 48 h after transfection and RNA was isolated using the miRNeasy mini kit (Qiagen) ac-cording to the manufacturer’s instructions. Total RNA was reverse transcribed using the iScript cDNA synthesis kit (BioRad). MYCN mRNA expression was detected using quantitative PCR and SYBRGreen detection chem-istry (Roche) on a Lightcycler 480 (Roche). MYCN ex-pression data were normalized to the exex-pression of stable reference genes (Alu-sx, HPRT1, SDHA and UBC) using qbasePLUSsoftware (www.biogazelle.com).
RESULTS
Functional miRNA annotation
To determine tissue or disease-specific miRNA functions, matching miRNA and mRNA expression levels were ana-lyzed using rank correlation coefficients. Matching genome-wide mRNA and miRNA expression data were obtained from the literature or newly generated. In total, 244 human samples belonging to 4 different data sets (normal adult tissues, neuroblastoma tumors, myeloma tumors and NCI60 cancer cell lines) were included in the analysis. For each miRNA, mRNAs were ranked accord-ing to their correlation coefficient and functional gene sets, enriched among the positively or negatively correlated mRNAs, were identified using gene set enrichment analysis (GSEA) (14). We next integrated the GSEA results with miRNA target prediction, transcription factor target pre-diction and mechanistic models of gene network regula-tion. These models represent specific interaction schemes between an miRNA and a gene set (or pathway), and form
by guest on August 13, 2011
nar.oxfordjournals.org
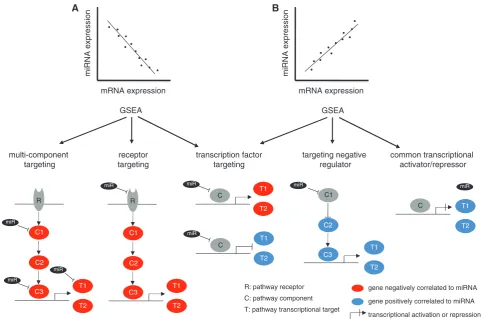
the basis of the mechanism underlying a particular miRNA—gene set association. We hypothesized that a sig-nificant miRNA—gene set association is more likely to be functional if there is mechanistic evidence that links the association between an miRNA and a gene set to one of five proposed models (Figure 1). According to these models, negative miRNA—gene set associations can occur if the gene set is enriched for targets of the miRNA (multi-component targeting), if the miRNA targets a key signal-ing molecule in the pathway represented by the gene set (component targeting) or if the miRNA negatively regu-lates a transcriptional activator that has its targets enriched in the gene set (transcription factor targeting) (Figure 1A). Similarly, positive miRNA–gene set associ-ations can occur if the miRNA negatively regulates a tran-scriptional repressor with its targets enriched in the gene set (transcription factor targeting), if the miRNA targets a negative regulator of a pathway or if the miRNA and the genes in the gene set share a common transcriptional activator or repressor (Figure 1B).
In order to integrate miRNA target predictions in the mechanistic models, we first made a rational selection of one single miRNA target prediction database. To this end,
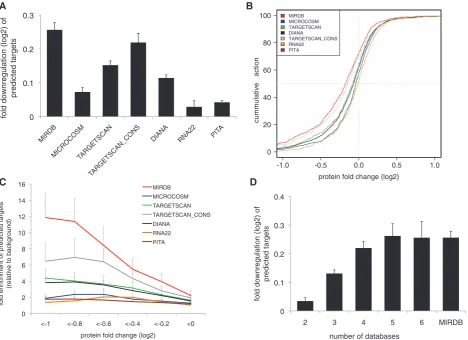
we used publically available mass spectrometry protein expression data from eight miRNA perturbation experi-ments (15,16) and evaluated seven widely used miRNA target databases for their ability to predict protein down-regulation. We found that the targets in the MIRDB database showed the highest fold downregulation in the experimental data sets (Figure 2A and B) suggesting that MIRDB predicts targets that are primarily downregulated upon overexpression of the miRNA. Fold downregula-tion observed for MIRDB targets was significantly higher compared to targets predicted by PITA, RNA22,
MICROCOSM, TARGETSCAN and DIANA (P<0.001).
Furthermore, MIRDB showed the lowest number of false positive predictions (Figure 2C). Combining individual databases did not give better results that those obtained by MIRDB alone (Figure 2D) suggesting that, according to our selection procedure, MIRDB predictions are best suited for accurate assessment of miRNA target enrich-ment in the studied gene sets. MIRDB predictions were then used to calculate miRNA target enrichments in the gene sets in order to identify those negative miRNA–gene set associations that adhere to the multi-component tar-geting model. To identify miRNA–gene set associations
miRNA
expression
mRNA expression
miRNA
expression
mRNA expression
R
C1
C2
C3
R
T1
T2
miR multi-component
targeting
receptor targeting
C1
C2
C3
T1
T2
C T1
T2
targeting negative regulator
common transcriptional activator/repressor B
A
transcription factor targeting
gene negatively correlated to miRNA R: pathway receptor
C: pathway component T: pathway transcriptional target
gene positively correlated to miRNA
transcriptional activation or repression C
miR
T1
T2
C miR
T1
T2 C1
C2
C3
miR
miR
miR
T1
T2
miR miR
GSEA GSEA
Figure 1. Mechanistic models of miRNA-directed gene expression regulation. Positive and negative miRNA–gene set associations, originating from positive and negative correlations between the miRNA and the genes in the gene set—can be explained by one of five proposed models of miRNA-directed gene regulation. The schematic models represent simplified pathways or signaling cascades with receptors (R), pathway components (C) and transcriptional targets (T). Coding genes negatively correlated to the miRNA are indicated in red, and genes positively correlated to the miRNA are indicated in blue. We define three models for negative miRNA–gene set associations, described as ‘multi-component targeting’, ‘com-ponent targeting’ and ‘transcription factor targeting’—and three models for positive miRNA–gene set associations, described as ‘transcription factor targeting’, ‘targeting of a negative regulator’ and ‘common transcriptional regulator’.
by guest on August 13, 2011
nar.oxfordjournals.org
that follow the mechanistic model of transcription factor targeting, we searched for gene sets that are enriched for transcription factor targets and used MIRDB to predict whether the transcription factor is a target of the miRNA.
Validation of predicted miRNA functions
To support the predicted miRNA functions and their as-signment to one of the proposed models of gene regula-tion, we first compared our findings to experimentally validated miRNA functions. For each of the five proposed models, representative examples were found in the litera-ture (Supplementary Figure S1), underscoring the rele-vance of the models and the power of the miRNA bodymap functional annotation pipeline. To further assess the accuracy of the pipeline, we compared functional
predictions for miRNAs from the miR-17–92 cluster to a set of experimentally derived miR-17–92 functions. To this end, we used a recently published protein expres-sion data set from a miR-17–92 perturbation experiment in neuroblastoma cells as our benchmark (13). Measured proteins (n= 3249) were ranked according to their fold change and GSEA revealed 94 gene sets enriched among the downregulated proteins. We then compared these ex-perimentally derived gene sets to gene sets predicted to be negatively associated with miR-17–92 in the neuroblast-oma tumor data set. In total, 78 out of 94 experimentally validated gene sets were predicted suggesting that the pre-dicted miRNA functions show a good concordance with experimentally derived functions. Another 201 gene sets were predicted that were not identified in the benchmark data set. Interestingly, the most significant gene sets [GSEA false discovery rate (FDR) = 0], according to the 0
protein fold change (log2)
cummulative
(relative to background)
protein fold change (log2) MIRDB
number of databases B
D C
A
Figure 2. Evaluation of miRNA target prediction algorithms. (A) Fold downregulation (log2) of predicted targets, according to seven different
prediction algorithms, in eight miRNA perturbation experiments. Each bar represents the mean fold change of protein expressionSEM. The highest downregulation was observed for targets predicted by MIRDB. Fold downregulation of targets predicted by MIRDB was significantly higher compared to DIANA, MICROCOSM, TARGETSCAN, RNA22 and PITA (P<0.001). (B) Cumulative distribution of protein fold change for predicted targets from seven different prediction algorithms. MIRDB predictions contain the highest fraction of downregulated proteins. For visualization purposes, the limits of theX-axis were set at 1 and 1. Distribution of protein fold changes for targets predicted by MIRDB was significantly different compared to DIANA, MICROCOSM, TARGETSCAN, RNA22 and PITA (Kolmogorov–Smirnov, P<0.001). (C) Fold
enrichment of predicted targets for different cutoffs of protein downregulation relative to the background (defined as those proteins with a log2
protein fold change>0). Within the group of proteins that are downregulated at least 2-fold (log2fold change less than 1), MIRDB predicts 12
times more targets than in the background set. (D) Fold downregulation (log2) of miRNA targets predicted by a combination of databases or by
MIRDB alone.
by guest on August 13, 2011
nar.oxfordjournals.org
annotation pipeline, were more frequently present in the benchmark data set as compared to the least significant gene sets suggesting that predicted gene sets can be further prioritized based on the GSEA FDR value, greatly en-hancing prediction specificity. Furthermore, the most sig-nificant gene sets (GSEA FDR = 0) were found to be largely independent of the sample size of the data set (Supplementary Figure S2).
In addition to functional miRNA annotation, the miRNA bodymap enables the detection of regulators of miRNA expression. Such regulators are identified by looking for positive associations between an miRNA and a gene set representing targets of a transcription factor (i.e. the miRNA and the genes in the gene set share a common transcriptional activator,Figure 1). To test this assumption, we searched for miRNAs that were positively correlated to a gene set containing MYC target genes (SCHUHMACHER_MYC_TARGETS_UP) in the neuro-blastoma data set and selected only the most significant as-sociations (GSEA FDR = 0). The selected miRNAs, 38 in total, were compared to a set of 18 MYC/MYCN-activated miRNAs, previously validated in neuroblastoma (17). In total, 16 out of 18 miRNAs were identified sug-gesting high concordance between predicted and validated interactions.
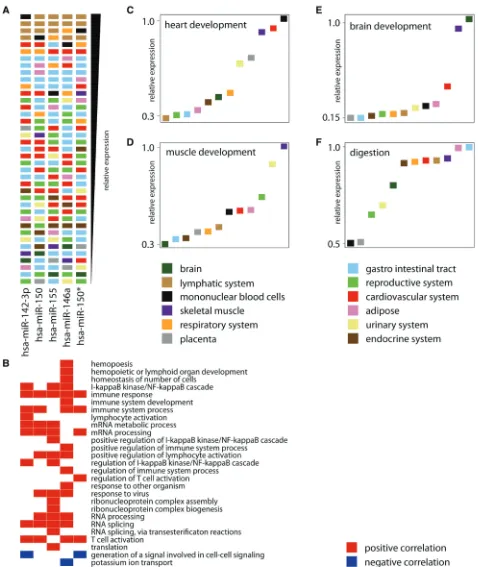
To further assess the validity of our approach, we evaluated inferred miRNA annotations for tissue-specific miRNAs and hypothesized that a tissue-specific miRNA should play a role in pathways relevant for that tissue. In the normal tissues data set, we searched for miRNAs that are highly expressed in tissues of the lymphatic system compared to all other tissues in that data set. The expres-sion of five lymphatic system-specific miRNAs (miR-142-3p, miR-150, miR-15, miR-146a and miR-150*) is visualized in a ranked expression map (Figure 3A). The most significant gene sets (GSEA FDR = 0, gene ontol-ogy biological process gene set collection) for each of these miRNAs are primarily annotated to processes such as immune response and immune cell activation (Figure 3B). Furthermore, we found miR-142-3p and miR-155 to be associated with the NF-kB pathway, a sig-naling cascade involved in immune response. Next, we selected tissue-specific gene sets, such as ‘heart develop-ment’, ‘brain developdevelop-ment’, muscle development and ‘digestion’ from the gene ontology biological process gene set collection and identified miRNAs that are pre-dicted to be positively associated with those gene sets in the normal tissues data set. miRNAs annotated to ‘brain development’ showed the highest expression in brain while miRNAs annotated to ‘heart development’ showed the highest expression in cardiovascular tissues, skeletal muscle and mononuclear blood cells (Figure 3C and D).
Similarly, miRNAs annotated to muscle
develop-ment showed the highest expression in skeletal muscle and miRNAs annotated to ‘digestion’ had the highest expression in tissues from the gastro-intestinal tract (Figure 3E and F). Together, these results support the relation between tissue-specific expression and function and lend further credibility to the predicted miRNA functions.
Identifying miRNA-directed transcription factor regulation
MiRNAs have been shown to act as key components in transcription factor signaling networks, either through co-operation with a transcription factor in the process of gene expression regulation (18) or through direct regulation of the transcription factor itself (19). Using the miRNA bodymap annotation pipeline, we searched for miRNAs regulating the MYCN transcription factor in neuroblast-oma. To identify miRNAs regulating MYCN, we searched for miRNAs that negatively correlate to a gene set containing MYC targets (SCHUHMACHER_MYC_ TARGETS_UP) with a GSEA FDR value = 0 and that are predicted to target MYCN according to MIRDB pre-dictions. We identified a single miRNA (miR-29a) that could meet these criteria. To evaluate whether miR-29a directly targets the MYCN 30-UTR, we established a
30-UTR luciferase reporter vector containing the predicted
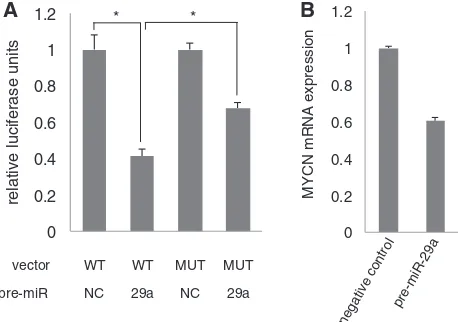
miR-29a binding site downstream of the luciferase gene and evaluated luciferase activity in the presence of a miR-29a pre-miR or negative control pre-miR. Luciferase activity significantly decreased in the presence of miR-29a compared to the negative control pre-miR (Student’s
t-test, P<0.01) (Figure 4A) suggesting that MYCN is a target of miR-29a. Mutation of the miR-29a binding site resulted in a partial but significant rescue of luciferase ac-tivity (Figure 4A). Furthermore, overexpression of miR-29a in MYCN amplified SK-N-BE(2c) cells resulted in a 40% decrease of MYCN expression levels (Figure 4B).
Analyzing custom gene sets using the miRNA bodymap functional annotation pipeline
Predicted miRNA functions available in the miRNA bodymap are based on three different gene set collections: gene ontology biological process, gene ontology molecular function and chemical and genetic perturbations. On top of that, the miRNA bodymap allows users to perform GSEA with custom gene sets obtained from the literature or derived from their own perturbation or profiling experi-ments. Based on the KEGG pathway database (20), we established a gene set representing the p53-signaling pathway and a gene set representing the B-cell receptor signaling pathway and searched for miRNA associations in the NCI60 data set and normal adult tissues data set, respectively. Five miRNAs were highly associated with in-creased p53 pathway activity (GSEA FDR = 0) including miR-34a, miR-373 and miR-141. All three miRNAs have previously been shown to function downstream of p53 (21–23). MiRNAs associated with B-cell receptor signal-ing were, among others, miR-150 (GSEA FDR = 0), miR-155 (GSEA FDR = 0) and different members of the miR-17–92 cluster (GSEA FDR = 0), all of which were shown to play important roles in B-cell development (24), B-cell receptor activation (25) or lymphoproliferative disease (26).
DISCUSSION
Elucidating tissue-specific miRNA functions has become one of the major challenges in miRNA research. While miRNA target prediction databases provide insights into
by guest on August 13, 2011
nar.oxfordjournals.org
Figure 3. Tissue-specific miRNA expression and function. (A) Ranked expression map for five lymphatic system-specific miRNAs (columns) in 39 normal tissues (rows). Each sample is represented by a square, color-coded according to different body organ systems and ranked according to the expression of the respective miRNAs. Samples with the highest expression are ranked on top. (B) Gene sets are from the Gene Ontology Biological Process gene set collection that are positively (red) and negatively (blue) associated with the lymphatic system-specific miRNAs. Only the most significant gene sets are shown. (C–F) Relative expression of miRNAs positively associated with the Gene Ontology Biological Process gene sets ‘heart development’, ‘brain development’, ‘digestion’ and ‘muscle development’ in the different body organ systems. Organ systems are ranked according to miRNA expression.
by guest on August 13, 2011
nar.oxfordjournals.org
putative miRNA target genes, they ignore the tissue- and context-specific nature of an miRNA–target interaction. To overcome this issue, we designed a functional miRNA annotation pipeline based on the integration of miRNA target prediction with matching miRNA and mRNA expression data. In addition, we introduced differ-ent interaction schemes represdiffer-enting the mechanistic relation between the miRNA and the genes within the pathway that is predicted to be regulated by the miRNA. We hereby hypothesized that the probability of obtaining a valid functional miRNA prediction increases when there is a mechanistic basis that supports it. This mechanistic basis can be a predicted interaction between the miRNA and a transcription factor within the pathway or an overrepresentation of miRNA targets in the pathway. MiRNA targets were predicted using the MIRDB algorithm that we identified to correlate best with protein expression data sets from miRNA perturb-ation experiments. Of note, this analysis is not compre-hensive but provides an indication which miRNA target prediction algorithm produces the least false positive pre-dictions. Ideally, high-throughput reporter assays should be performed for all (or a significant subset of) predicted miRNA targets in order to comprehensively assess the
accuracy of miRNA target prediction databases.
Functional miRNA predictions for four different data sets are available through the miRNA bodymap web tool and can be queried based on the underlying inter-action schemes. In addition, the miRNA bodymap web tool contains an miRNA expression analysis pipeline that enables identification of differentially expressed miRNAs between tissues or disease groups, tissue- or disease-specific miRNAs and stably expressed miRNAs for miRNA expression normalization. Combining tissue-or disease-specific miRNA expression patterns with func-tional miRNA predictions allows prioritization of
candidate miRNAs and hypothesis generation for
further research. The miRNA bodymap web tool enables researchers to upload additional data sets of matching mRNA and miRNA expression data to
populate the database with additional functional
miRNA predictions. In this way, miRNA functions that are predicted in multiple independent data sets can be further prioritized, making the miRNA bodymap a com-munity resource for functional miRNA research. A manual describing the entire functionality of the miRNA bodymap web tool is available on the website.
SUPPLEMENTARY DATA
Supplementary Data are available at NAR Online.
ACKNOWLEDGEMENTS
P.M., S.L., F.P., E.F., A.F., M.O. and J.V. performed the analysis and developped the web tool. P.M. and J.V. wrote the manuscript. D.R., L.W. and C.C. performed miRNA expresssion analysis. A.D.P., F.S. and J.V. supervised the study. This article represents research results of the Belgian program of Interuniversity Poles of Attraction, initiated by the Belgian State, Prime Minister’s Office, Science Policy Programming.
FUNDING
This work was supported by the Research Foundation-Flanders (G.0198.08, 31516610 and 31511809); the Children Cancer Fund, the Stichting Tegen Kanker and GOA (01G01910). PM is supported by the Ghent University Research Fund (BOF 01D31406 and the Belgian Program of Interuniversity Poles of Attraction, SL is supported by the Ghent University Research Fund (BOF/ZAP/094, FP is a postdoctoral fellow of the Research Foundation-Flanders (FWO). Funding for open access charge: Research Foundation-Flanders.
Conflict of interest statement. None declared.
REFERENCES
1. Bartel,D.P. (2009) MicroRNAs: target recognition and regulatory functions.Cell,136, 215–233.
2. Inui,M., Martello,G. and Piccolo,S. (2010) MicroRNA control of signal transduction.Nat. Rev. Mol. Cell. Biol.,11, 252–263. 3. Iorio,M.V. and Croce,C.M. (2009) MicroRNAs in cancer: small
molecules with a huge impact.J. Clin. Oncol.,27, 5848–5856. 4. Mendell,J.T. (2008) miRiad roles for the miR-17-92 cluster in
development and disease.Cell,133, 217–222.
5. Tan,L.P., Seinen,E., Duns,G., De Jong,D., Sibon,O.C.,
Poppema,S., Kroesen,B.J., Kok,K. and Van den Berg,A. (2009) A high throughput experimental approach to identify miRNA targets in human cells.Nucleic Acids Res.,37, e137.
6. Chi,S.W., Zang,J.B., Mele,A. and Darnell,R.B. (2009) Argonaute HITS-CLIP decodes microRNA-mRNA interaction maps.Nature,
460, 479–486.
7. Nam,S., Kim,B., Shin,S. and Lee,S. (2008) miRGator: an integrated system for functional annotation of microRNAs. Nucleic Acids Res.,36, D159–164.
0
Figure 4. The MYCN transcription factor is a direct target of miR-29a in neuroblastoma. (A) Relative luciferase activity of a MYCN 30-UTR
luciferase reporter vector containing the predicted miR-29a binding site. Co-transfection of vector and pre-miR-29a results in a significant decrease in luciferase activity compared to the negative control (*Student’s t-test, P<0.01). Mutation of the miR-29a binding site
results in a significant rescue of the luciferase signal (*Student’st-test, P<0.01). (B) MYCN expression in SK-N-BE(2c) cells transfected with
a pre-miR negative control or pre-miR-29a.
by guest on August 13, 2011
nar.oxfordjournals.org
8. Ulitsky,I., Laurent,L.C. and Shamir,R. (2010) Towards computational prediction of microRNA function and activity. Nucleic Acids Res.,38, e160.
9. Mestdagh,P., Van Vlierberghe,P., De Weer,A., Muth,D., Westermann,F., Speleman,F. and Vandesompele,J. (2009) A novel and universal method for microRNA RT-qPCR data
normalization.Genome. Biol.,10, R64.
10. Wang,X. (2008) miRDB: a microRNA target prediction and functional annotation database with a wiki interface.RNA,14, 1012–1017.
11. Wang,X. and El Naqa,I.M. (2008) Prediction of both conserved and nonconserved microRNA targets in animals.Bioinformatics,
24, 325–332.
12. Cloonan,N., Brown,M.K., Steptoe,A.L., Wani,S., Chan,W.L., Forrest,A.R., Kolle,G., Gabrielli,B. and Grimmond,S.M. (2008) The miR-17-5p microRNA is a key regulator of the G1/S phase cell cycle transition.Genome. Biol.,9, R127.
13. Mestdagh,P., Bostrom,A.K., Impens,F., Fredlund,E., Van Peer,G., De Antonellis,P., Von Stedingk,K., Ghesquiere,B., Schulte,S., Dews,M.et al. (2010) The miR-17-92 microRNA cluster regulates multiple components of the TGF-beta pathway in neuroblastoma.Mol. Cell.,40, 762–773.
14. Subramanian,A., Tamayo,P., Mootha,V.K., Mukherjee,S., Ebert,B.L., Gillette,M.A., Paulovich,A., Pomeroy,S.L., Golub,T.R., Lander,E.S.et al. (2005) Gene set enrichment analysis: a knowledge-based approach for interpreting
genome-wide expression profiles.Proc. Natl Acad. Sci. USA,102, 15545–15550.
15. Baek,D., Villen,J., Shin,C., Camargo,F.D., Gygi,S.P. and Bartel,D.P. (2008) The impact of microRNAs on protein output. Nature,455, 64–71.
16. Selbach,M., Schwanhausser,B., Thierfelder,N., Fang,Z., Khanin,R. and Rajewsky,N. (2008) Widespread changes in protein synthesis induced by microRNAs.Nature,455, 58–63.
17. Mestdagh,P., Fredlund,E., Pattyn,F., Schulte,J.H., Muth,D., Vermeulen,J., Kumps,C., Schlierf,S., De Preter,K., Van Roy,N. et al. (2010) MYCN/c-MYC-induced microRNAs repress coding gene networks associated with poor outcome in MYCN/ c-MYC-activated tumors.Oncogene,29, 1394–1404.
18. Su,N., Wang,Y., Qian,M. and Deng,M. (2010) combinatorial regulation of transcription factors and microRNAs. BMC Syst. Biol.,4, 150.
19. Yamakuchi,M., Lotterman,C.D., Bao,C., Hruban,R.H., Karim,B., Mendell,J.T., Huso,D. and Lowenstein,C.J. (2010) P53-induced microRNA-107 inhibits HIF-1 and tumor angiogenesis. Proc. Natl Acad. Sci. USA,107, 6334–6339.
20. Kanehisa,M., Goto,S., Furumichi,M., Tanabe,M. and Hirakawa,M. (2010) KEGG for representation and analysis of molecular networks involving diseases and drugs. Nucleic Acids Res.,38, D355–360.
21. Chang,C.J., Chao,C.H., Xia,W., Yang,J.Y., Xiong,Y., Li,C.W., Yu,W.H., Rehman,S.K., Hsu,J.L., Lee,H.H.et al. (2011) p53 regulates epithelial-mesenchymal transition and stem cell properties through modulating miRNAs.Nat. Cell. Biol.,13, 317–323.
22. He,L., He,X., Lim,L.P., De Stanchina,E., Xuan,Z., Liang,Y., Xue,W., Zender,L., Magnus,J., Ridzon,D.et al. (2007) A microRNA component of the p53 tumour suppressor network. Nature,447, 1130–1134.
23. Voorhoeve,P.M., Le Sage,C., Schrier,M., Gillis,A.J., Stoop,H., Nagel,R., Liu,Y.P., Van Duijse,J., Drost,J., Griekspoor,A.et al. (2006) A genetic screen implicates miRNA-372 and
miRNA-373 as oncogenes in testicular germ cell tumors.Cell,
124, 1169–1181.
24. Zhou,B., Wang,S., Mayr,C., Bartel,D.P. and Lodish,H.F. (2007) miR-150, a microRNA expressed in mature B and T cells, blocks early B cell development when expressed prematurely. Proc. Natl Acad. Sci. USA,104, 7080–7085.
25. Yin,Q., Wang,X., McBride,J., Fewell,C. and Flemington,E. (2008) B-cell receptor activation induces BIC/miR-155 expression through a conserved AP-1 element.J. Biol. Chem.,283, 2654–2662.
26. Xiao,C., Srinivasan,L., Calado,D.P., Patterson,H.C., Zhang,B., Wang,J., Henderson,J.M., Kutok,J.L. and Rajewsky,K. (2008) Lymphoproliferative disease and autoimmunity in mice with increased miR-17-92 expression in lymphocytes.Nat. Immunol.,9, 405–414.
by guest on August 13, 2011
nar.oxfordjournals.org