VOL. 2, NO. 3, pp. 103 – 109, September, 2012
Earthworm Population Density in Sugarcane Cropping System Applied
with Various Quality of Organic Matter
Nurhidayati1,3*, E. Arisoesilaningsih2, D. Suprayogo3, K. Hairiah3
1
Department of Agro-technology, Agriculture Faculty, Islamic University of Malang, Indonesia
2
Department of Biology, Faculty of Mathemathics and Natural Sciences, Brawijaya University, Malang, Indonesia
3
Department of Soil Science, Agriculture Faculty, Brawijaya University, Malang, Indonesia
ABSTRACT
Earthworms population in the soil are greatly impacted by agricultural management, yet little is known about how the quality and quantity of organic matter addition interact in sugarcane cropping system to earthworm population. This study describes the effect of various organic matter and application rates on earthworms in sugarcane cropping system. Earthworms were collected in April, July and December from 48 experimental plots under five kinds of organic matter application : (1) cattle manure, (2) filter cake of sugar mill, (3) sugarcane trash, (4) mixture of cattle manure+filter cake, and (5) mixture of cattle manure+sugarcane trash. There were three application rates of the organic matter (5, 10, and 15 ton ha-1). The treatments were arranged in factorial block randomize design with three replications and one treatment as a control (no organic input). Earthworms were collected using monolith sampling methods and hand-sorted from each plot, and measured its density (D) (indiv.m-2), biomass (B) (g m-2) and B/D ratio (g/indiv.). All the plots receiving organic matter input had higher earthworm density, biomass, and B/D ratio than the control. The highest earthworm population density was found in the plot receiving application of sugarcane trash (78 indiv.m-2) and the mixture of cattle manure+sugarcane trash (84 indiv.m-2). The increase in application rates of organic matter could increase the earthworm density and biomass. Earthworm population density also appeared to be strongly influenced by the quality of organic matter, such as the C-organic, N, C/N ratio, lignin, polyphenols, and cellulose content. Earthworm preferred low quality organic matter. It was caused by the higher energy of low quality organic matter than high quality organic matter. Our finding s suggest that the input of low quality organic matter with application rate as 10 ton ha-1 is important for maintaining earthworm population and soil health in sugarcane land.
Keywords: earthworms, organic matter quantity, quality, sugarcane cropping sy stem
INTRODUCTION
Earthworms are the major macrofauna in the soil community. The population of earthworms extremely vary in size ranging from only few individuals (sometimes totally absent) to more than 1000/m2. That depends on the physicochemical characteristic of the soil and the climatic [1, 2]. The change in soil characteristic can influence earthworm’s abundance. Thus, they can serve as indicators of several changes /factors associated with soil. In addition, earthworm plays an important role in soil pro-
*Corresponding address: Nurhidayati
Department of Agrotechnology, Agriculture Faculty, Islamic University of Malang , Jl. MT.Haryono 193, Malang, Indonesia 65144
Email: [email protected]
cesses, including aggregation, residue decomposition, nutrient mineralization, aeration, and water infiltration [1]. Many studies clearly show that the earthworms are the best indicators of heavy metals, toxic pollutants, and direct and indirect anthropogenic changes in soil [3, 4, 5].
C inputs, and soil texture [7, 8, 9]. Soil organic matter is fundamental to the long-term sustainability of agroecosystems and plays a critical role in global biogeochemical cycles [10, 11]. SOM is a key driver of soil aggregation and is, in turn, influenced by its distribution among different aggregate size fractions [12, 13]. SOM stored within aggregates often contribute to soil structure. This data suggested that the consideration of both direct impacts and less straight forward mechanisms are required for improved understanding of management impacts on SOM dynamics.
Fertilization, soil tillage, and the burning of harvest residues are common practices in the sugarcane cultivation in many parts of the world as well as in Indonesia. The long-term impacts of the conventional sugarcane cultivation system will be followed by a decline in soil health characterized by the rapid decline in soil organic matter content and soil biodiversity that can accelerate the decline in soil productivity [14-17]. Therefore, maintaining and increasing SOM content are vital for nutrient recycling, improving soil physical properties and maintaining healthy environment, especially for sugarcane which include a long duration, nutrient exhaustive crop.
The application of organic matter with nutrient resources, e.g., animal manures, crop residues, and green manures, to replenish organic matter and improve soil structure and fertility is increasingly favored [18- 20]. A growing number of experiments show that organic farming leads to higher soil quality and more biological activity in soil than the conventional one [21, 22]. However, the effects of various organic sources with different quality and their application rates on earthworm population density need detailed investigation. This study hypothesizes that the incorporation of various organic source with different quality provides different earthworm population density which, in turn, will improve soil fertility, growth and yield of the sugarcane crop. The objective of this field study is, thus, to describe the effect of various organic matter with different quality and application rates on earthworms in sugarcane cropping system.
MATERIALS AND METHODS
The Experimental Site and Climate The field experiment was conducted at Sempol village, Pagak Sub-district, Malang regency (08o16,837’ S and 112o30,453’ E, following properties: 26% clay, 48 % silt, and 26 % sand. It has well drained, flat, and bulk density of 1.24 Mg m−3. The soil is very low in organic
The treatments were arranged in factorial block randomized design. The first factor is organic matter source that consists of five kinds of organic matter with different quality, that is, cattle manure (B1), filter cake of sugar mill (B2), trash of sugarcane (B3), mixture of cattle manure+filter cake (B4), and mixture of cattle manure+sugarcane trash (B5). The second factor is the three application rates of the organic Analysis of the Organic Matter Quality
The used organic matter was composted during two weeks. Cattle manure was brought from the farmer’s cattle bed, while the filter cake was collected from the Kebon Agung sugar mill, Malang, East Java. Sugarcane trash was brought from the sugarcane land after harvesting and the dry trash was selected. The materials were analysis were presented in Table 1.
Earthworms Inoculation
into the planting hole in one week after organic matter application. Before the inoculation, among experimental plots was set plastic partition to avoid the movement of the earthworm. Each plot was inoculated by 125 individuals of earthworm with average weight per individual ranged from 0.2-0.4 g. After the inoculation of the earthworm Pontoscolex corethrurus, the soil surface was covered by sugarcane trash to avoid sunlight directly.
Crop Culture
The plots with 10 m×1 m size were prepared by hoeing for all treatments uniformly. The transplanted into the prepared plots on distance 40 cm inter-plants. During the sugarcane growth, there was no plant protection control applied. All the organic amendments were manually applied to field plots one month before planting. In addition to organic matters used for the treatments, this study also used the basic fertilizers, namely, N-P-K (15-15-15) fertilizer with a dose of 200 kg ha-1 and Ammonium sulfate with a dose of 800 kg ha-1. The fertilizers were applied one month after transplantation by respectively, according to a sampling procedure described by [23]. The earthworm samples were The earthworm measurement was conducted in April, July and December.
Statistical Analysis
The collected data was statistically analyzed by using analysis of variance (ANOVA) (F-Test) at level (P ≤ 0.05) and differences in each treatment were adjudged by Duncant test (P ≤ 0.05) and Dunnet test to compare with the control treatment using program Minitab Vers.
14.12. For statistical analysis of data (charts), Microsoft Excel was employed.
RESULT AND DISCUSSION
The interaction between the kind and the application rates of organic matter significantly (P<0.05) affected the population density, biomass and average weight per individual (B/D ratio) of earthworm, except for the April sampling. However, separately difference in application rate and quality of organic matter significantly (P<0.05) influenced the earthworm parameter. The higher the application rate is, the higher earthworm population density and biomass will be. Dunnet test showed that all treatments with the addition of organic matter on the rainy season sampling (April and December) were significantly different compared with the controls (P <0.05). The treatments with organic input had higher earthworm density and earthworm (Table 2). The population density and biomass of earthworm in April and December samplings showed a trend that increase in the application dose of organic matter can increase the population density of earthworm (Table 2; Figure 1). In April sampling, B/D ratio of some treatments were not significantly different compared to the control. However, the treatments with mixture CM+FC and CM+ST showed increase in the B/D ratio significantly (P <0.05) by 8% when compared with controls (without any addition of organic). In July and December sampling, increase in the B/D ratio for the treatments compared to the control were 200% and 78%, respectively (Table 2). The earthworm abundance in the soil was greatly impacted by the availability of food source in the soil and physicochemical characteristic of soil, such as soil moisture, soil temperature, nutrient, and soil pH [1, 2, 6].
matter compared to the control (without organic input) for the three samplings (April, July and December) were 106% (CM), 125% (FC), 139% (ST), 82% (mixture of CT+FC), and 168% (mixture of CM+ST). Then increase in the earthworm biomass are, respectively, 202% (CM), 307% (FC), 340% (ST), 262% (a mixture of CM+FC), 445% (a mixture of CM+ST) (Figure 1.). The difference in soil management with residue input affected the population density and biomass of the earthworms. At tomatoes land, the treatments with residue
management as cover crop and mulch compared to fallow land, the population density could vary from 18.5- 451.2 individual m-2, while the biomass varied between 1.3 - 142.3 g m-2 [24]. The residue left on the soil surface could increase the earthworm biomass and weight per individual of the earthworm by 2.9 times and 2.3 times from the fallow land. The results were also consistent with those reported by previous researchers that the organic matter input into the soil could affect the earthworm population density [7, 8, 25].
Table 1. The chemical composition of organic matter on dry weight basis
Organic matter
C-organic (%)
Total N (%)
C/N Lignin (%)
Ash (%)
Cellulose (%)
Polyphenol (%)
Gross Energy (Kcal/kg)
Cattle manure, CM (B1) 16.17 1.94 8.3 12.32 13.26 30.34 0.26 1010.63
Filter Cake, FC (B2) 20.15 1.98 10.2 19.88 20.46 40.22 1.14 1089.54
Sugarcane trash ,ST (B3) 28.14 0.81 34.7 13.3 10.22 40.09 2.01 3027.78
CM+FC (B4) 19.15 1.68 11.4 16.46 11.46 37.45 1.42 1120.14
CM+ST (B5) 20.43 1.32 15.5 12.03 8.22 33.25 1.12 1353.54
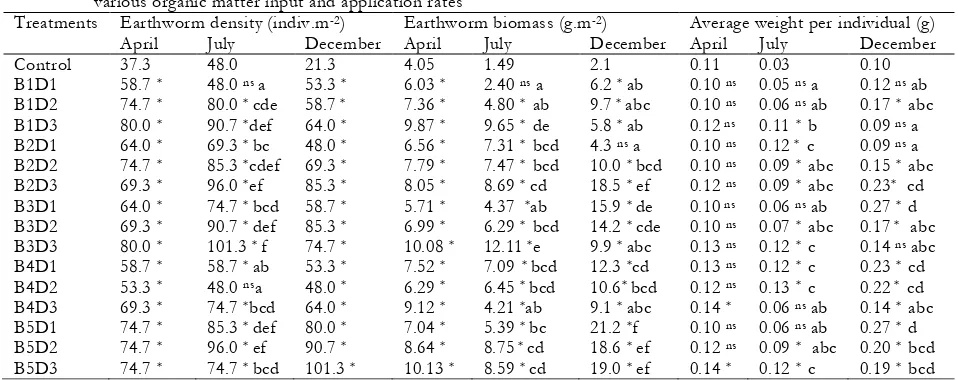
Table 2. Earthworm density, biomass, and weight per individual (B/D) in April, July and December sampling due to various organic matter input and application rates
Treatments Earthworm density (indiv.m-2) Earthworm biomass (g.m-2) Average weight per individual (g)
April July December April July December April July December
Control 37.3 48.0 21.3 4.05 1.49 2.1 0.11 0.03 0.10
B1D1 58.7 * 48.0 ns a 53.3 * 6.03 * 2.40 ns a 6.2 * ab 0.10 ns 0.05 ns a 0.12 ns ab
B1D2 74.7 * 80.0 * cde 58.7 * 7.36 * 4.80 * ab 9.7 * abc 0.10 ns 0.06 ns ab 0.17 * abc
B1D3 80.0 * 90.7 *def 64.0 * 9.87 * 9.65 * de 5.8 * ab 0.12 ns 0.11 * b 0.09 ns a
B2D1 64.0 * 69.3 * bc 48.0 * 6.56 * 7.31 * bcd 4.3 ns a 0.10 ns 0.12 * c 0.09 ns a
B2D2 74.7 * 85.3 *cdef 69.3 * 7.79 * 7.47 * bcd 10.0 * bcd 0.10 ns 0.09 * abc 0.15 * abc
B2D3 69.3 * 96.0 *ef 85.3 * 8.05 * 8.69 * cd 18.5 * ef 0.12 ns 0.09 * abc 0.23* cd
B3D1 64.0 * 74.7 * bcd 58.7 * 5.71 * 4.37 *ab 15.9 * de 0.10 ns 0.06 ns ab 0.27 * d
B3D2 69.3 * 90.7 * def 85.3 * 6.99 * 6.29 * bcd 14.2 * cde 0.10 ns 0.07 * abc 0.17 * abc
B3D3 80.0 * 101.3 * f 74.7 * 10.08 * 12.11 *e 9.9 * abc 0.13 ns 0.12 * c 0.14 ns abc
B4D1 58.7 * 58.7 * ab 53.3 * 7.52 * 7.09 * bcd 12.3 *cd 0.13 ns 0.12 * c 0.23 * cd
B4D2 53.3 * 48.0 nsa 48.0 * 6.29 * 6.45 * bcd 10.6* bcd 0.12 ns 0.13 * c 0.22 * cd
B4D3 69.3 * 74.7 *bcd 64.0 * 9.12 * 4.21 *ab 9.1 * abc 0.14 * 0.06 ns ab 0.14 * abc
B5D1 74.7 * 85.3 * def 80.0 * 7.04 * 5.39 * bc 21.2 *f 0.10 ns 0.06 ns ab 0.27 * d
B5D2 74.7 * 96.0 * ef 90.7 * 8.64 * 8.75 * cd 18.6 * ef 0.12 ns 0.09 * abc 0.20 * bcd
B5D3 74.7 * 74.7 * bcd 101.3 * 10.13 * 8.59 * cd 19.0 * ef 0.14 * 0.12 * c 0.19 * bcd
Notes : *) Significantly different with control on Dunnet test (P<0.05); ns) not significantly different with control on Dunnet test (P<0.05); The numbers followed by a different letter on the same column are significantly different on Duncant test (P<0.05)
Difference in the quality of the organic matter (P <0.05) significantly affected the average weight per individual of the earthworm in December sampling. The mixture of cattle manure + filter cake and the mixture of cattle manure + sugarcane trash had higher average weight per individual of the earthworms compared to the other two kinds of organic matter. The average weight per individual of the earthworm in December sampling was higher than in April and July sampling (Table 2). The overall increase in the average weight per individual of the earthworm on the treatments
with organic matter were 55% (CM), 95% (FC), 92% (ST), 121% (a mixture of CM +FC), and 108% (a mixture of CM+ST), respectively.
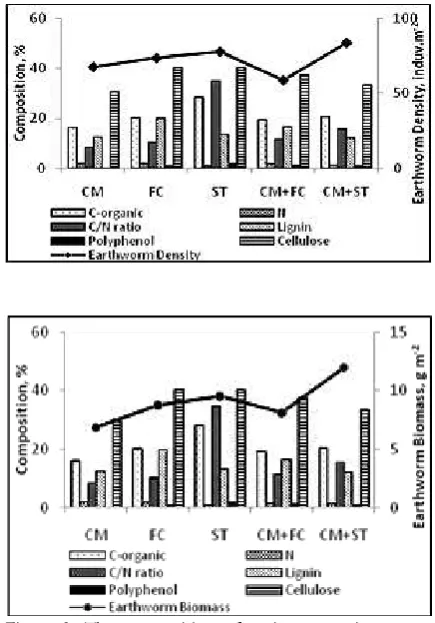
C/N ratio by 15-35%, lignin content by 12.03-13.3 %, polyphenol content 1.12-2.0 %, cellulose content by 33-40%, gross energy by 1353.54-3027.78 Kcal/kg, while the lowest population density and biomass of earthworms in the treatment with organic matter quality were organic C by N content by 1.94, C/N ratio by 8.3, lignin by 12.03 %, polyphenols by 0.26, and cellulose content by 30.34 %, and gross energy by 1010.63 kcal/kg.
Figure 1. Earthworm density and biomass in April, July, and December sampling due to the various organic matter input compared with control. The different letter on the same soil sampling is different significantly (P<0.05). CM= cattle manure ; FC= Filter cake of sugar mill; ST= Sugarcane trash
Differences in the quality of organic matter added to the soil affected the population density, biomass and average weight per individual of the earthworm. In this study, organic matter addition with C/N ratio between 11.4 - 34.7 (mixture of CM+FC, CM+ST and sugarcane trash alone) were the kinds of organic matter that were preferred by the earthworms Pontoscolex corethrurus. The quality of organic matter as measured by the C/N ratio greatly determined the palatability of organic matter to be consumed by the earthworms. In the range of C/N ratio of 12-39, the consumption rate of the earthworms to residues was positively correlated with C/N ratio. The residue with a C/N ratio of 12.31 was preferred more than the cover crop residue with C/N ratio of ~ 8 [26]. The residue of herbaceous
species with the same level of palatability on the C/N ratio of 11.4 - 15 was more widely consumed by the earthworms [27, 28]. In addition to the difference in the quality of organic matter, the rate application of organic matter also had significant impact on the population density, biomass and weight per individual of the earthworm in which the greater the application rate of organic materials was, the higher the population density, biomass and weight per individual of earthworm would be. Thus, the growth and biomass of the earthworms, including Pontoscolex corethrurus, were influenced by the quality and quantity of available food in the soil [29, 30].
Figure 2. The composition of various organic matter in relation to earthworm density and biomass.
CONCLUSION
The different quality and application rate of organic matter applied into the soil of sugarcane cropping cause changes of earthworm density, biomass and average weight per individual. The application of low quality organic matter, such as sugarcane trash and mixture of cattle manure+ sugarcane trash with application rate by 10 ton ha-1, shows positive impact on the soil quality because of the increase in the earthworm community in the soil of sugarcane plantation. Our findings suggest that the input of low quality organic matter with high C/N ratio, cellulose and gross energy, but with low lignin and polyphenol content are important for maintaining the earthworm population and soil health in sugarcane land.
ACKNOWLEDGEMENTS
The authors would like to thank the Directorate of Higher Education, Ministry of National Education, Indonesia, for their financial support by Postgraduate scholarship. The authors also extend their gratitude to the land owner who has given permission to conduct a research on his sugarcane and to the Soil Science Department of Brawijaya University that has allowed the authors to use its facilities for the sake of this study.
REFERENCES ecosystems (Review Article). Applied and Environmental Soil Science. Article I D414356. 16 pages.
3. Hinton JJ & MM Veiga (2002) Earthworms as
bioindicators of mercury pollution from mining and other industrial activities. Geochemistry:
Exploration Environment Analysis. 2(3):269–
274.
4. Mahmoud HM (2008) Earthworm (Lumbricus
terrestris) as indicator of heavy metals in soils.
Online Journal of Veterinary Research. 11:23–37.
5. Iwai CB, P Yupin & BN Noller (2008)
Earthworm: potential bioindicator for
monitoring diffuse pollution by agrochemical
residues in Thailand. KKU Research Journal.
139:1081–1088.
6. Suthar S (2009) Earthworm communities as
bioindicator of arable land management
practices: a case study in semi arid region of
India. Ecological Indicators. 9(3):588–594.
7. Kladivko EJ, NM Akhouri & G Weesies (1997)
Earthworm populations and species distributions under no-till and conventional tillage in Indiana
and Illinois. Soil Biol Biochem. 29:613–615.
8. Chan KY (2001) An over view of some tillage
impacts on earthworm population abundance and diversity implications for functioning in soils,
Soil Tillage Res. 57:179–191.
9. Marhan S & S Scheu (2005) The influence of
mineral and organic fertilizers on the growth of the endogeic earthworm Octolasion tyrtaeum (Savigny). Pedobiologia. 49:345-352.
sequestration. In: Lal R, H Eswaran, JM Kimble, BA Stewart (Eds.) Global Climate Change and Tropical Ecosystems. Press Boca Raton FL.
Chapter 16:317–329.
13. Six J, ET Elliott, K Paustian & JW Doran (1998)
Aggregation and soil organic matter accumulation in cultivated and native grassland soils. Soil Sci
Soc Am J. 62:1367–1377.
14. Wood AW (1985) Soil degradation and
management under intensive sugarcane
cultivation in north Queensland. Soil Use
sugarcane production on soil quality: a synthesis of orld literature. Proc S Afr Sug Tech Ass. sugarcane yield in North Lampung: Measurement and Estimation of Wanulcas simulation. Agrivita, 25:30-40.
18. Guisquiani PL, M Paghai, G Gighoth, D
Businelli & A Benetti (1995) Urban waste compost: Effects on physical, chemical and biochemical soil properties. J Environ Qual.
24:175–182.
19. Parham JA, SP Deng, WR Raun & GV Johnson
(2002) Long-term cattle manure application in soil: Effect on soil phosphorus levels, microbial biomass C and dehydrogenase and phosphatase
activities. Biol Fertil Soils. 35:328–337
20. Saviozzi A, P Bufalino, R Levi-Minzi & R
Riffaldi (2002) Biochemical activities in a degraded soil restored by two amendments: a
21. Drinkwater LE, DK Letournea, F Workneh, AHC van Bruggen & C Shennan (1995) Fundamental differences between conventional and organic tomato agroecosystems in California.
Ecol Appl. 5:1098–1112.
22. Droogers P & J Bouma (1996) Biodynamic
versus conventional farming effects on soil structure expressed by simulated potential
productivity. Soil Sci Soc Am J. 60:1552–1558.
23. Huising. EJ, R Coe, JE Cares, JN Louzada, R
Zanetti, FMS Moreira, FX Susilo, S Konate, M van Noordwijk & SP Huang (2008) Sampling Strategy and Design to Evaluate Below-ground Biodiversity. In A Handbook of Tropical Soil Biology. FMS Moreira, EJ Huising and DE Bignell (eds). Earthscan publishing for a sustainable future. London. Sterling. V.A.:17-41.
24. Fonte SJ, T Winsome & J Six (2009) Earthworm
populations in relation to soil organic matter dynamics and management in California tomato
cropping systems. Applied soil ecology. 41:206 –
214.
25. Fraser PM, PH Williams & RJ Haynes (1996)
Earthworm species. population size and biomass under different cropping systems across the Canterbury Plains. New Zealand. Applied soil
ecology. 3:49–57.
26. Schönholzer F, L Kohli, D Hahn, O Daniel, C
Goez & J Zeyer (1998) Effects of decomposition
of leaves on bacterial biomass and on palatability to Lumbricus terrestris L. Soil Biol Biochem.
30:1805–1813.
27. Neilson R & B Boag (2003) Feeding preferences
of some earthworm species common to upland
pastures in Scotland. Pedobiologia. 47:1–8.
28. Valckx J, AC Pina, G Govers, M Hermy & B
Muys (2011) Food and habitat preferences of the earthworm Lumbricus terrestris L. for cover
crops. Pedobiologia. 54S:S139–S144.
29. Garcıa JA & C Fragoso (2002) Growth, reproduction and activity of earthworm in degraded and amended tropical open mined soils:
laboratory assays. Appl Soil Ecol. 20:43–56.
30. Garcıa JA & C Fragoso (2003) Influence of different food substrates on growth and reproduction of two tropical earthworms (Pontoscolex corethrurus and Amynthas corticis).