i
S t a t i s t i k A s u r a n s i G e m p a B u m i I n d o n e s i a a s a t J u n e 2 0 1 1
Sesuai dengan tujuan pendiriannya, MAIPARK
memberikan pelayanan bagi industri asuransi
Indonesia dalam hal pengetahuan dan statistik
mengenai risiko bencana. Inovasi terus kami
lakukan untuk menyempurnakan laporan statistik
ini, sehingga menjadi lebih akurat, rinci dan
komprehensif. Berikut kami sajikan Laporan
Statistik Asuransi Gempa Bumi Indonesia per Juni
2011 yang mencakup :
o
Inovasi terhadap sistem dan proses
pengolahan data statistik.
o
Peta Kejadian Gempa Bumi Indonesia.
o
Peta
Exposure
Gempa Bumi Indonesia.
o
Penggolongan tersendiri atas risiko multi
lokasi, dalam laporan profile risiko dan
klaim.
o
Analisa asuransi gempa terkait kondisi
makro ekonomi.
o
Current Seismic Analysis
.
o
Laporan dengan dua bahasa (Bahasa
Indonesia – Bahasa Inggris).
o
Panel navigasi yang akan memudahkan
dalam menelusuri laporan statistik ini.
o
Tabel, peta dan grafik yang kreatif.
Dengan semangat ”Go Green”, laporan tersebut
disajikan dalam bentuk soft copy dan tidak lagi
diproduksi dalam bentuk hard copy.
Usaha yang kami lakukan dalam menyempurnakan
laporan statistik ini tidak akan berarti apa - apa
tanpa dukungan dari seluruh perusahaan asuransi.
Data yang lengkap dan akurat akan sangat
menentukan kualitas dari hasil statistik ini.
In line with the objective of its establishment,
MAIPARK provide services for the insurance
industry
of Indonesia in
terms
of science and statistics on disaster risk. We keep
on doing to make this statistics report to be
more accurate, detailed and comprehensive. Herew
ith we present Indonesian Earthquake of As at
June 2011 which include:
o
Innovation
of
the
system and statistical data processing.
o
Map of
Indonesian
Earthquake
Occurrence.
o
Map of Indonesian Earthquake Exposure.
o
Separate classification of multi-location
risks in and Loss report.
o
Analysis of earthquake insurance related
to macro economic conditions.
o
Current .
o
Bilingual reports (Indonesian - English).
o
Navigation Panel to ease to trace
the statistical report.
o
Creative tables, maps and graphs.
With the spirit of "Go Green” the report is
presented in soft copy rather than hard copy.
Our efforts to continously improve this statistic
report are nothing without all insurance companies’
support. Complete and accurate data will
greatly determine the quality of these statistical
results.
ii
S t a t i s t i k A s u r a n s i G e m p a B u m i I n d o n e s i a a s a t J u n e 2 0 1 1
Kami berharap laporan statistik ini dapat
memberikan manfaat tidak hanya bagi perusahaan
asuransi yang menangani asuransi gempa bumi,
namun juga berguna bagi industri Asuransi Umum
di Indonesia.
We hope that this statistic report is useful for
both insurance companies having earthquake
business and general insurance industry in
Indonesia.
Salam Inovasi MAIPARK !!
iii
S t a t i s t i k A s u r a n s i G e m p a B u m i I n d o n e s i a a s a t J u n e 2 0 1 1
Daftar Isi
Kata Pengantar
... i
Daftar Isi
... iii
Informasi Statistik
... vi
Ikhtisar Kegiatan Asuransi Gempa Bumi
Indonesia per Juni 2011
...
A. Pendahuluan ... 1
B. Struktur Pasar ... 1
C. Pertumbuhan Premi Bruto ... 2
D. Jumlah Risiko ... 5
E. Kontribusi Asuransi Gempa Bumi
Indonesia ... 8
F. Pertumbuhan Klaim Terjadi ... 15
Exposure Asuransi Gempa Bumi Indonesia
...
Tabel 2.1. Exposure Per Cresta Zone ... 21
Tabel 2.2. Exposure Per Okupasi ... 23
Tabel 2.3. Exposure Per Interest ... 25
Tabel 2.4. Exposure Per Provinsi ... 27
Gross Premium Asuransi Gempa Bumi
Indonesia
...
Tabel 3.1. Gross Premium Per Cresta Zone
... 28
Tabel 3.2. Gross Premium Per Okupasi ... 30
Tabel 3.3. Gross Premium Per Provinsi ... 32
Jumlah Risiko Asuransi Gempa Bumi Indonesia
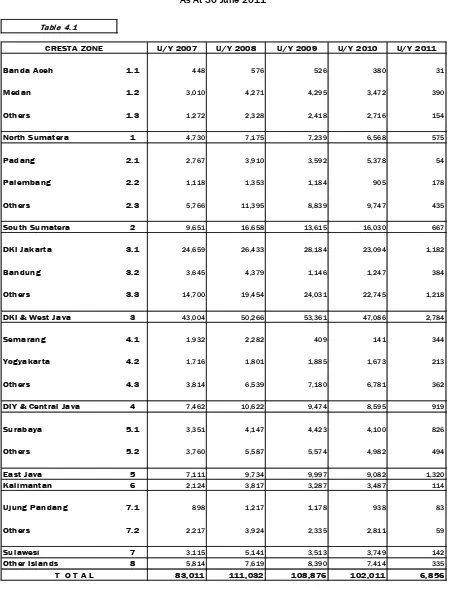
Tabel 4.1. Jumlah Risiko Per Cresta Zone . 33
Tabel 4.2. Jumlah Risiko Per Okupasi ... 35
Klaim Asuransi Gempa Bumi Indonesia
...
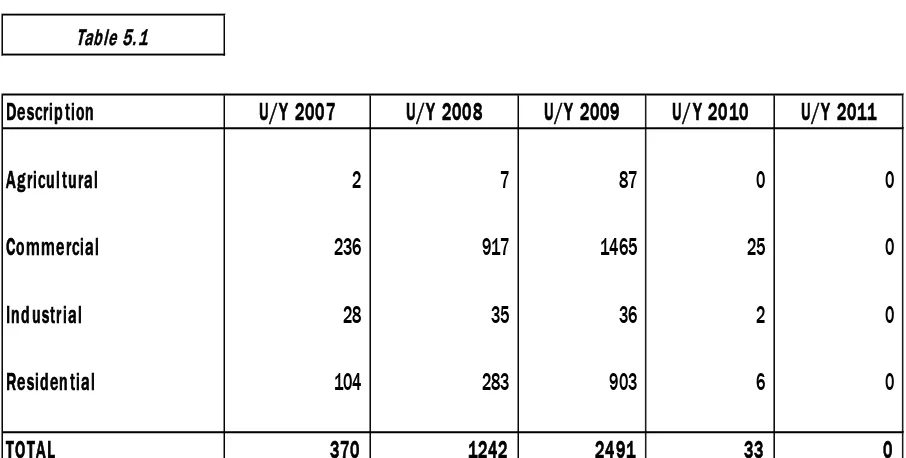
Tabel 5.1. Klaim Frekwensi Per Okupasi ... 37
Tabel 5.2. Klaim Frekwensi Per Cresta Zone
... 39
Tabel 5.3. Jumlah Klaim Per Okupasi ... 41
Tabel 5.4. Jumlah Klaim Per Cresta Zone .. 43
Profil Risiko dan Klaim
...
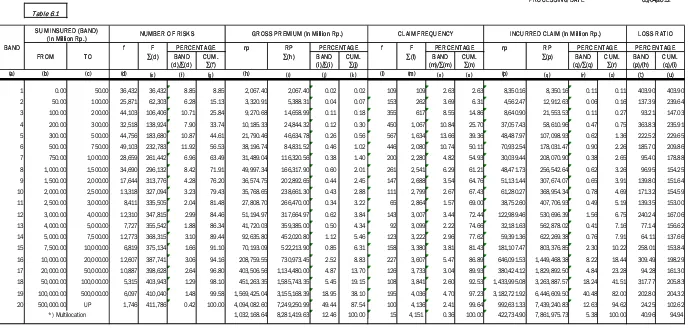
Tabel 6.1. Semua Tahun Underwriting,
Semua Okupasi, Semua Cresta Zone ... 45
Contents
Foreword ... i
Contents ... iii
Statistical Information ... vi
Summary of Indonesia Earthquake Insurance As
at June 2011 ...
Indonesia Earthquake Insurance Exposure
...
Table 2.1.Exposure By Cresta Zone
... 21
Table 2.2.Exposure By Occupation
... 23
Table 2.3.Exposure By Interest
... 25
Table 2.4.Exposure By Province
... 27
Indonesian Earthquake Insurance Gross
Premium
...
Table 3.1.Gross Premium By Cresta Zone
28
Table 3.2.Gross Premium By Occupation
.. 30
Table 3.3.Gross Premium By Province
... 32
Indonesian Earthquake Insurance Number of
Risk
...
Table 4.1.Number of Risk By Cresta Zone
33
Table 4.2.Number of Risk By Occupation
.. 35
Indonesian Earthquake Insurance Claim ...
Table 5.1. Claim Frequency By Occupation
... 37
Table 5.2. Claim Frequency By Cresta Zone
... 39
Table 5.3. Claim Amount By Occupation
... 41
Table 5.4. Claim Amount By Cresta Zone
.. 43
iv
S t a t i s t i k A s u r a n s i G e m p a B u m i I n d o n e s i a a s a t J u n e 2 0 1 1
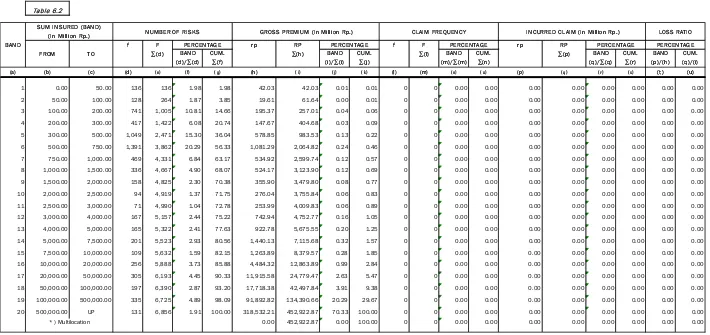
Tabel 6.2. Tahun Underwriting 2011, Semua
Okupasi, Semua Cresta Zone ... 46
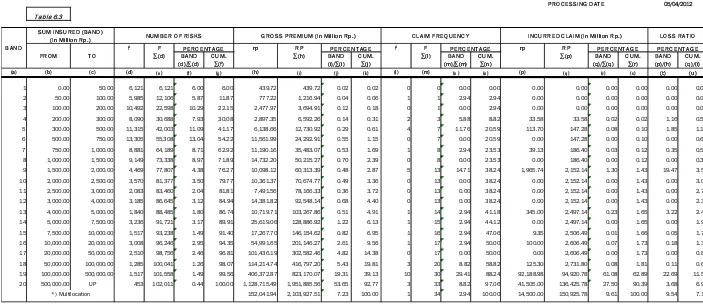
Tabel 6.3. Tahun Underwriting 2010, Semua
Okupasi, Semua Cresta Zone ... 47
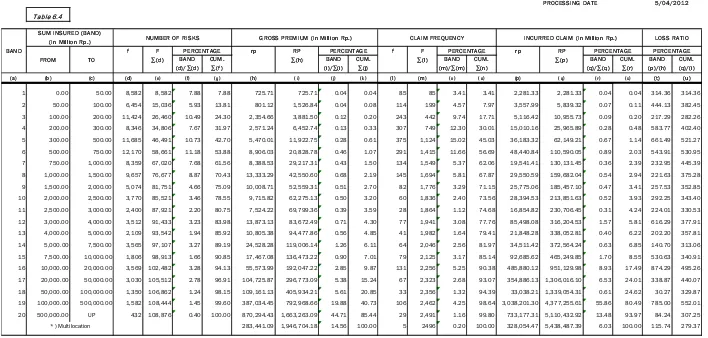
Tabel 6.4. Tahun Underwriting 2009, Semua
Okupasi, Semua Cresta Zone ... 48
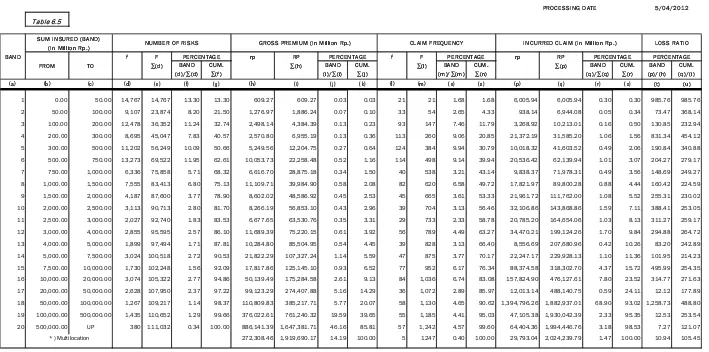
Tabel 6.5. Tahun Underwriting 2008, Semua
Okupasi, Semua Cresta Zone ... 49
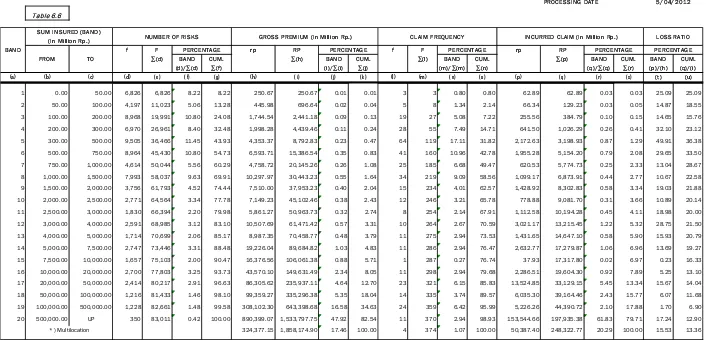
Tabel 6.6. Tahun Underwriting 2007, Semua
Okupasi, Semua Cresta Zone ... 50
Profil Risiko dan Klaim Tahun Underwriting
2011
...
Okupasi Agricultural By Cresta Zone ... 51
Okupasi Commercial By Cresta Zone ... 52
Okupasi Industrial By Cresta Zone ... 53
Okupasi Residential By Cresta Zone ... 54
Profil Risiko dan Klaim Tahun Underwriting
2010
...
Okupasi Agricultural By Cresta Zone ... 55
Okupasi Commercial By Cresta Zone ... 56
Okupasi Industrial By Cresta Zone ... 57
Okupasi Residential By Cresta Zone ... 58
Profil Risiko dan Klaim Tahun Underwriting
2009
...
Okupasi Agricultural By Cresta Zone ... 59
Okupasi Commercial By Cresta Zone ... 60
Okupasi Industrial By Cresta Zone ... 61
Okupasi Residential By Cresta Zone ... 62
Profil Risiko dan Klaim Tahun Underwriting
2008
...
Okupasi Agricultural By Cresta Zone ... 63
Okupasi Commercial By Cresta Zone ... 64
Okupasi Industrial By Cresta Zone ... 65
Okupasi Residential By Cresta Zone ... 66
Profil Risiko dan Klaim Tahun Underwriting
2007
...
Okupasi Agricultural By Cresta Zone ... 67
Okupasi Commercial By Cresta Zone ... 68
Okupasi Industrial By Cresta Zone ... 69
Okupasi Residential By Cresta Zone ... 70
Table 6.2. Underwriting Year 2011, All
Occupation, All Cresta Zone
... 46
Table 6.3. Underwriting Year 2010, All
Occupation, All Cresta Zone
... 47
Table 6.4. Underwriting Year 2009, All
Occupation, All Cresta Zone
... 48
Table 6.5. Underwriting Year 2008, All
Occupation, All Cresta Zone
... 49
Table 6.6. Underwriting Year 2007, All
Occupation, All Cresta Zone
... 50
Risk and Loss Profile Underwriting Year 2011
...
Agricultural Occupation By Cresta Zone
.. 51
Commercial Occupation By Cresta Zone
. 52
Industrial Occupation By Cresta Zone
... 53
Residential Occupation By Cresta Zone
... 54
Risk and Loss Profile Underwriting Year 2010
..
Agricultural Occupation By Cresta Zone
55
Commercial Occupation By Cresta Zone
56
Industrial Occupation By Cresta Zone
... 57
Residential Occupation By Cresta Zone
... 58
Risk and Loss Profile Underwriting Year 2009
...
Agricultural Occupation By Cresta Zone
. 59
Commercial Occupation By Cresta Zone
. 60
Industrial Occupation By Cresta Zone
... 61
Residential By Cresta Zone
... 62
Risk and Loss Profile Underwriting Year 2008
..
Agricultural Occupation By Cresta Zone
. 63
Commercial Occupation By Cresta Zone
. 64
Industrial Occupation By Cresta Zone
... 65
Residential Occupation By Cresta Zone
... 66
Risk and Loss Profile Underwriting Year 2007
..
Agricultural Occupation By Cresta Zone
67
Commercial Occupation By Cresta Zone
. 68
Industrial Occupation By Cresta Zone
... 69
v
S t a t i s t i k A s u r a n s i G e m p a B u m i I n d o n e s i a a s a t J u n e 2 0 1 1
Daftar Istilah ...
Lampiran
1.
Tarif Asuransi Gempa Bumi Indonesia
2.
Skala First Loss ...
3.
Tabel Jangka Waktu Pertanggungan
kurang dari satu tahun ...
4.
Tabel Indemnitas ...
Glossaries
...
Attachments
1.
Indonesian Earthquake Insurance Tariff
...
2.
First Loss Scale
...
3.
Short Period Table less than one year
period
...
vi
S t a t i s t i k A s u r a n s i G e m p a B u m i I n d o n e s i a a s a t J u n e 2 0 1 1
1.
Statistik dibuat berdasarkan Underwriting
Year yang tercatat sampai dengan posisi
30 Juni 2011.
2.
Sesi Limit
2.1.
Limit Sesi didasarkan atas setiap
risiko.
2.2.
Yang dimaksud dengan setiap
risiko (
anyone risk
) adalah
akumulasi (
aggregate
) jumlah
harga pertanggungan seluruh
risiko pada lokasi yang sama untuk
masing-masing perusahaan
asuransi. Definisi setiap risiko atau
setiap lokasi ditentukan oleh
perusahaan asuransi atau penerbit
polis sesuai dengan interpretasi
perusahaan asuransi dalam
underwriting
polis kebakaran.
2.3. Besarnya Limit Sesi atas setiap
risiko (
any one risk
) untuk
gabungan kerugian fisik dan
gangguan usaha adalah sebagai
berikut :
2.3.1.
Untuk daerah Jawa Barat,
Banten dan DKI : 5%
asuransi atau penerbit
polis.
2.3.2 Untuk daerah Indonesia
lainnya 25% (dua puluh
lima ratus ribu Dollar
1.
Statistics
are
prepared
on Underwriting Year basis, recorded as
at June 30 2011.
2.
Cession Limit
2.1.
Cession Limit is based on any one
risk.
2.2.
Anyone risk is the accumulation
of (aggregate) total sum insured of
all risks
at
the same
location for each insurance compan
y. The definition of anyone risk or
any location is specified by the
insurer or policy issuer in
accordance with the interpretation
of insurance companies in
underwriting fire policy.
2.3.
Cession Limit of any one risk for the
combined material and business
interruption damage are as follows:
2.3.1
For West Java, Banten and
DKI : 5% (five percent) of the
total sum insured, a maximum
of USD 2,500,000.00 (two
million five hundred thousand
U.S. Dollars) for any one risk,
each insurance company or
policy issuer
2.3.2
Other area within Indonesia
are 25% (twenty five percent)
of total sum insured,
maximum of USD
2,500,000.00 (two million five
hundred thousand U.S.
Dollars) for any one risk, each
insurance company or policy
issuer.
vii
S t a t i s t i k A s u r a n s i G e m p a B u m i I n d o n e s i a a s a t J u n e 2 0 1 1
Amerika) atas setiap risiko
setiap perusahaan
asuransi atau penerbit
polis.
2.4
Dalam hal penutupan secara
First
Loss Basis / Sub-limit
, jumlah yang
disesikan sebagaimana diatur
dalam butir 2.3. diatas, dikalikan
persentase
First Loss Basis /
Sub-limit Basis
.
2.5
Bilamana risiko ditutup secara
ko-asuransi, jumlah maksimum sesi
dari semua Anggota ko-asuransi
adalah sesuai dengan ketentuan
yang diatur dalam 2.3. diatas. Sesi
masing-masing perusahaan adalah
proporsional sebanding sahamnya
dalam ko-asuransi.
Dalam hal terdapat penutupan lain
selain polis ko-asuransi tersebut
ketentuan yang diatur pada butir
2.3.
3.
Tarif Premi
3.1. Penutupan dengan menggunakan
Full Value Basis mengaplikasikan
Tarif Premi Standar Gempa Bumi
Indonesia (lampiran 1)
3.2. Penutupan dengan First Loss /
Sub Limit Basis mengaplikasikan
standar First Loss Scale (lampiran
2)
3.3. Perhitungan premi untuk
penutupan kurang dari 12 (dua
belas) bulan diberlakukan skala
premi jangka pendek (lampiran 3)
3.4. Untuk perhitungan premi Business
Interruption diberlakukan Indemnity
Period Scale (lampiran 4)
2.4
In term of first loss basis / sub limit
policies, the amount cession are
stipulated in item 2.3 above, then
multiplied by the percentage of
First Loss Basis / Sub-limit Basis.
2.5
For coinsurance policies,
maximum cession from all
members of coinsurance is
stipulated in item 2.3 above. Each
ceding company cedes
proportionally depending on its
share.
In the even there are other policies
on the same risk beside that
coinsurance policy, insurer still can
cede such risks subject to the
maximum limit set out in item 2.3
3.
Premium Tariff
3.1.
For the coverage of Full Value
Basis, Indonesian earthquake rate
standard is applied (attachment 1).
3.2.
The coverage First Loss / Sub
Limit Basis uses standard First
Loss Scale (attachment 2).
3.3.
Premium calculation for short
period coverage is based on Short
Period Scale (attachment 3).
3.4.
Premium calculation for business
viii
S t a t i s t i k A s u r a n s i G e m p a B u m i I n d o n e s i a a s a t J u n e 2 0 1 1
4.
Obyek Pertanggungan
4.1.
Obyek pertanggungan yang dapat
disesikan adalah obyek
4.2 Penutupan sebagaimana
dimaksud pada butir 4.1. adalah
yang ditutup secara langsung
bulannya untuk semua risiko yang
ditutup pada bulan yang bersangkutan
dan sudah harus diterima
selambat-lambatnya pada akhir bulan berikutnya.
6.
Untuk kasus “Multi Location Risk” yang
mengalami kesulitan dalam memberikan
detail harga pertanggungan perlokasi
maka dengan persetujuan AAUI
pensesian risiko dan perhitungan premi
dilakukan pada zona-zona tertentu.
7.
Untuk menggambarkan premi dan harga
pertanggungan yang sebenarnya dalam
penutupan asuransi gempa bumi
berdasarkan ko-asuransi, diharapkan
agar seluruh anggota ko-asuransi
mensesikan risiko gempa bumi tersebut.
4.
Insured Objects
4.1.
Insured objects that can be ceded
are insured objects in fire policy.
such as :
4.1.1.
Material damage :
•
Buildings
•
Foundations
•
Excavation and the like
•
Stocks
4.2.
Insured objects referred in item 4.1
are objects from direct business
insurance, including coinsurance.
Indirect businesses cannot be
ceded.
5.
Bordereaux Report.
Bordereaux reports is submitted on a
monthly basis for all risk underwritten in
the month concerned and should be
received by the end of the following
month.
6.
In the case of Multi Location Risks with
no details of sum insured provided per
location, the risk cession and its premium
calculation specified zones after
approved by AAUI.
7.
In order to get overall pictures of each
1
S t a t i s t i k A s u r a n s i G e m p a B u m i I n d o n e s i a a s a t J u n e 2 0 1 1
A.
Pendahuluan.
Berdasarkan laporan Badan Pusat Statistik
tentang Pertumbuhan Ekonomi Indonesia
Triwulan II-2011, pertumbuhan ekonomi
Indonesia yang diukur berdasarkan kenaikan
Pendapatan Domestik Bruto (PDB) pada
semester I-2011 meningkat 6,5% dibandingkan
semester I-2010. Besaran PDB atas dasar
harga berlaku pada triwulan II-2011 mencapai
Rp. 1.811,1 Triliun. Ada tiga sektor yang
mendominasi tingkat pertumbuhan tertinggi
(perbandingan triwulanan dari tahun lalu) yaitu
sektor Perdagangan, Hotel dan Restoran
sebesar 4,8 %, Sektor Konstruksi sebesar 4,2
% dan Sektor Listrik, Gas dan Air Bersih
sebesar 4,0%. Tampak bahwa sektor yang
menduduki 2 (dua) peringkat teratas
mencerminkan pertumbuhan di Sektor Riil
secara keseluruhan, yang tentunya diharapkan
akan berdampak positif terhadap pertumbuhan
di bidang asuransi.
B. Struktur Pasar
Berdasarkan data yang berhasil kami
kumpulkan Per 30 Juni 2011, terdapat 84
perusahaan asuransi umum dan perusahaan
reasuransi umum yang memiliki izin beroperasi
di Indonesia. Dari 84 perusahaan tersebut, 18
perusahaan adalah perusahaan asuransi
patungan, 4 perusahaan adalah perusahaan
A.
Introduction
Based on the quarter II- 2011’s report on
Indonesian economic growth issued by Statistic
Central Agency, Indonesia’s economic growth
being measured by the increase of GDP at
semester I-2011 have increased by 6.5%
compared to the same period last year. The
GDP amount based on the current prices
reached Rp. 1,811.1 trillions. There are three
sectors dominating the highest increment
(quarter-to-quarter), i.e. Trade, Hotel and
Restaurant Sector at 4.8%. It is followed by
Construction sector at 4.2% and the last
Electricity, Gas and Water sector at 4.0%.
Especially for the first two highest sectors, it
may reflect the growth of Real Sector overall. It
is hoped that this will give positive impacts
towards the growth on insurance sector.
B. Market Structure
Based on the current that we collected per
30 June 2011, there are 84 general insurers
and general reinsurers in Indonesia having
operating licenses in Indonesia. Out of those 84
companies, 18 are joint-venture insurance
2
S t a t i s t i k A s u r a n s i G e m p a B u m i I n d o n e s i a a s a t J u n e 2 0 1 1
reasuransi dan 62 sisanya merupakan
perusahaan asuransi swasta nasional.
Sebagai perusahaan asuransi umum
satu-satunya di Indonesia yang mengkhususkan diri
pada risiko-risiko khusus seperti gempa bumi,
MAIPARK terus menerus melakukan perbaikan
dan pengembangan seperti dalam sistem
pengolahan data dan pembuatan laporan
statistik yang terdiri dari pensesian wajib dan
pensesian tidak wajib. Diharapkan dengan
semakin meningkatnya kualitas laporan statistik
maka industri asuransi dapat menarik manfaat
akan keberadaan MAIPARK melalui
output
yang dihasilkan, seperti laporan geologi terkait
usaha asuransi, suku premi asuransi gempa
bumi maupun laporan statistik ini sendiri.
C. Pertumbuhan Premi Bruto
Per 30 Juni 2011, pendapatan premi bruto
untuk tahun underwriting 2007 adalah sebesar
Rp. 1.858,2 miliar. Premi bruto untuk tahun
underwriting 2008 tercatat Rp 1.919,7 miliar,
sedangkan untuk tahun underwriting 2009
adalah Rp. 1.946,7 miliar. Dan untuk tahun
underwriting 2010 dan 2011 pendapatan
asuransi gempa bumi adalah Rp. 2.103,9 miliar
dan Rp. 452,9 miliar. Dikarenakan pencatatan
ini dilakukan pada pertengahan tahun maka
angka-angka yang tersaji di atas masih kecil,
terutama untuk tahun underwriting yang masih
muda seperti tahun underwriting 2010 dan
tahun underwriting 2011. Namun demikian,
companies and the remaining 62 are national
private insurance companies.
As the only one general insurance focusing
on special risks such as earthquake, MAIPARK
keeps on developing and enhancing the
existing system, including the process of
making statistic report comprising of
compulsory and non-compulsory cessions. It is
hoped that the development on the quality of
statistic report, the industry could take benefits
from the existence of MAIPARK through its
outputs, ranging from geological reports related
to insurance business, earthquake insurance
rates and also the statistic report itself.
C. Gross Premium Growth
Per 30 June 2011, the gross premium
income of underwriting year 2007 was Rp.
1,858.2 billion. At the same period in the first
semester 2011, the gross premium income for
underwriting year 2008 was Rp 1,919.7 billion.
For underwriting year 2009, it was Rp 1,946.7
billion. Finally, for underwriting year 2010 and
2011, they are Rp. 2,103.9 billion and Rp.
452.9 billion. Since these have not developed
yet in the first year, those figures were still little,
and would certainly increase until the end of
2011, especially for the figures of underwriting
3
S t a t i s t i k A s u r a n s i G e m p a B u m i I n d o n e s i a a s a t J u n e 2 0 1 1
angka tersebut dipastikan bergerak naik hingga
pencatatan di akhir tahun 2011.
Dari catatan statistik selama tahun
underwriting 2007 – tahun underwriting 2011,
okupasi industrial selalu memiliki rasio
pendapatan premi bruto terbesar dibanding 3
(tiga) okupasi lainnya, yaitu selalu di atas 55%.
Kemudian diikuti oleh okupasi komersial,
okupasi residensial dan okupasi agrikultural.
Hal ini logis dilihat dari perkembangan
bisnis keempat okupasi tersebut. Okupasi
Industrial yang didominasi oleh pabrik,
manufaktur dan sejenisnya memiliki nilai
pertanggungan yang pada umumnya besar
sehingga pendapatan premi yang diperoleh
juga besar. Sebagai contoh adalah pada tahun
underwriting 2007, Unit Pengolahan IV Cilacap
Pertamina sebagai pemasok 34% kebutuhan
BBM nasional atau 60% kebutuhan BBM di
pulau Jawa, memiliki pertanggungan tertinggi
yaitu sebesar Rp. 46,4 Triliun. Mengingat
laporan statistik ini memuat informasi selama 5
tahun terakhir (UY 2007 – UY 2011), maka
data tersebut masih tercatat dalam laporan.
Okupasi komersial yang didominasi gedung
bertingkat, gedung perkantoran, ruko (rumah
toko) dan rukan (rumah kantor) walaupun
memiliki tarip premi yang sama dengan okupasi
industrial, namun memiliki nilai pertanggungan
yang relatif kecil dibanding okupasi industrial
sehingga total premi yang diperoleh pun lebih
kecil dari okupasi lndustrial.
On our statistic report from underwriting year
2007 to underwriting year 2011, Industrial
occupation is always the biggest contribution
comparing to the remaining three occupations.
It always has percentage higher than 55%.
Then, it is followed by commercial occupation,
residential occupation and agricultural
occupation.
Having seen the development of those four
occupations, this is logical. Industrial
occupation which is dominated by business
such as factories, manufacturers etc usually
have big sum insured resulting big premium.
For example, in Underwriting Year 2007,
Refinery Unit IV Cilacap Pertamina as the main
provider of 34% Fuel Oil for national needs or
60% Fuel Oil in Java Island has the biggest
sum insured at Rp
.
46.4 trillion. Since this
statistic report contains the latest 5 year
information (UY 2007 – UY 2011), therefore
such data still appears in this report.
Commercial occupation being dominated
by high-rise buildings, office buildings,
shop-houses and office-shop-houses, having the same
premium rate with industrial occupation, have
relatively smaller sum insured compared to
industrial occupation. In total, the premium will
consequently be smaller than industrial
4
S t a t i s t i k A s u r a n s i G e m p a B u m i I n d o n e s i a a s a t J u n e 2 0 1 1
Meskipun okupasi residensial dan okupasi
agrikultur tidak memberikan kontribusi sebesar
okupasi industrial dan okupasi komersial
namun kedua okupasi tersebut mengalami
pertumbuhan premi bruto yang cukup tinggi.
Dengan mengasumsikan tidak ada
pertumbuhan premi yang berarti pada tahun
underwriting 2007 dan 2008 maka dapat
dikatakan premi bruto okupasi residensial pada
tahun underwriting 2008 meningkat sebesar
40,7% dibanding tahun sebelumnya dan premi
bruto okupasi agrikultur pada tahun
underwriting 2008 meningkat sebesar 74,3%
dari tahun sebelumnya
.
Tabel 1.1 di bawah ini menyajikan rincian
premi bruto berdasarkan jenis okupasi dari
tahun underwriting 2007 sampai semester
pertama tahun underwriting 2011.
Although residential occupation and agricultural
occupation do not give premium contribution as
much as industrial occupation and commercial
occupation, they have enough premium
increase growth. By assuming there are no
meaningful premium increase growth on
underwriting year 2007 and underwriting year
2008, we can say the gross premium of
residential occupation in underwriting year
2008 increased 40.7% comparing to the same
period last year. Also, the gross premium of
agricultural occupation in underwriting year
2008 increase 74.3% from last year.
The table 1.1 below presents the details of
gross premium based on the occupation type
from underwriting year 2007 to the first
semester underwriting year 2011.
Tabel 1.1. Tabel premi bruto masing-masing okupasi pada tahun underwriting 2007 – 2011 per 30 Juni 2011
Table 1.1. Table of gross premium of each occupation underwriting year 2007 – 2011 as at 30 June 2011
Per / As at 30 June 2011 Dalam Jutaan Rupiah
In Million Rupiah
Tahun
Underwriting
2007
9,949.0
0.54%
394,454.9
21.22% 1,300,315.7
69.98%
153,455.3
8.26% 1,858,174.9
2008
17,346.4
0.90%
456,031.0
23.76% 1,230,379.6
64.09%
215,933.2
11.25% 1,919,690.2
2009
16,613.9
0.85%
456,221.1
23.44% 1,195,083.2
61.39%
278,786.0
14.32% 1,946,704.2
2010
20,851.8
0.99%
373,764.3
17.77% 1,432,168.0
68.07%
277,143.4
13.17% 2,103,927.5
2011
1,943.9
0.44%
68,591.3
15.14%
258,501.1
57.07%
123,886.5
27.35%
452,922.9
Premi Bruto dan Rasio Berdasarkan Okupasi
Gross Premium and Ratio By Occupation
Okupasi
5
S t a t i s t i k A s u r a n s i G e m p a B u m i I n d o n e s i a a s a t J u n e 2 0 1 1
D. Jumlah Risiko
Tabel 1.2 dibawah ini menyajikan jumlah
risiko pada masing-masing tahun underwriting
yang tercatat sampai dengan 30 Juni tahun
2011, yaitu dari tahun underwriting 2007 hingga
tahun underwriting 2011. Tabel ini tidak
termasuk risiko multilokasi dimana kami
mengelompokkannya dalam satu kelompok
khusus dikarenakan kurang rincinya data yang
kami terima sehingga kurang tepat jika kami
memasukkan risiko yang tidak terindentifkasi
tersebut ke dalam jenis okupasi tertentu.
Kenyataan ini juga memberi pesan kepada
industri asuransi kerugian untuk mensesikan
data-data tersebut secara lebih akurat dan
lengkap untuk menyempurnakan laporan
statistik kami.
D. Number of Risk
Table 1.2 below shows number of risks on
each underwriting year recorded until 30 June
2011, ranging from underwriting year 2007 to
underwriting year 2011. This table does not
include multi-location risks - a special group
comprising of the inaccurate risk details. Due
to inaccurate risks details, it is not correct to put
this multi-location group into one of those four
occupation categories. This fact gives a
message to general insurance industry to cede
the earthquake cession more complete and
more accurate to make this statistic report more
perfect.
.
Tabel 1.2. Jumlah risiko masing-masing okupasi pada tahun underwriting 2007 - 2011 per 30 Juni 2011
Table 1.2. Number of risk of each occupation underwriting year 2007 – 2011 as at 30 June 2011
Chart 1.1. Diagram batang menunjukan jumlah risiko tiap okupasi pada tahun underwriting 2007 - 2011 per 30 Juni 2011
Chart 1.1. Bar chart showing number of risk each occupation underwriting year 2007 – 2011 as at 30 June 2011
Per / As at 30 June 2011
Agricultural 412 0.50% 599 0.54% 348 0.32% 265 0.26% 64 0.93%
Commercial 39,310 47.36% 64,507 58.10% 55,866 51.31% 47,881 46.94% 5,083 74.14%
Industrial 11,704 14.10% 9,682 8.72% 11,526 10.59% 10,553 10.34% 933 13.61%
Residential 31,585 38.05% 36,244 32.64% 41,136 37.78% 43,312 42.46% 776 11.32%
TOTAL 83,011 111,032 108,876 102,011 6,856
Jumlah Risiko Berdasarkan Okupasi Number of Risk By Occupation
Okupasi Tahun Underwriting / Underwriting Year
6
S t a t i s t i k A s u r a n s i G e m p a B u m i I n d o n e s i a a s a t J u n e 2 0 1 1
Berbeda dengan kontribusi premi bruto
terbesar yang ada pada okupasi industrial,
maka jumlah risiko terbesar untuk setiap tahun
underwriting, dalam hal ini dari tahun
underwriting 2007 sampai tahun underwriting
2011, ada pada okupasi komersial. Kemudian
diikuti oleh okupasi residensial, okupasi
industrial dan terakhir okupasi agrikultural.
Besarnya jumlah risiko pada okupasi
komersial adalah selain banyaknya gedung
bertingkat tinggi, bank dan perusahaan yang
memiliki cabang di beberapa wilayah Indonesia
juga karena rumah toko (
shop houses
) masuk
dalam kategori okupasi komersial. Rumah toko
memiliki kisaran nilai pertanggungan sekitar
Rp. 500 juta hingga Rp. 1 mililar atau lebih.
Dari segi nilai pertanggungan, rumah toko tidak
berbeda jauh dengan nilai pertanggungan pada
rumah biasa, namun dari segi kuantitas
banyaknya rumah toko (
shop houses
) secara
langsung menyumbang kontribusi jumlah risiko
yang besar pada okupasi komersial. Begitupun
pada okupasi residensial, jumlah risiko yang
tercatat cukup besar namun masih dibawah
jumlah risiko komersial. Sementara itu, okupasi
industrial sebagai penyumbang kontribusi
premi bruto tertinggi hanya menempati urutan
ketiga dalam jumlah risiko. Hal ini dikarenakan
lokasi dari okupasi industrial yang hanya
berada pada titik-titik tertentu dan tidak
tersebar di berbagai wilayah Indonesia,
contohnya, Unit Pengolahan Pertamina.
Terakhir, okupasi agrikultural memiliki jumlah
risiko yang paling rendah dibandingkan okupasi
Different from industrial occupation that has
given biggest premium contribution so far, the
commercial occupation contributes the highest
number of risks from underwriting year 2007 to
underwriting year 2011. Then, it is followed with
residential occupation, industrial occupation
and the last agricultural occupation.
In addition to the high number of high-rise
buildings, banks and companies having
branches in other area in Indonesia, the
shop-houses also contribute to the number of risks
on commercial occupation. Shop-houses have
sum insured range from Rp 500 million to Rp 1
trillion or more. From the sum insured side,
shop-houses are not far much different than
ordinary dwelling-houses. However; from the
quantity side, the large quantity of shop-houses
directly contribute to the number of commercial
occupation. Also, the residential occupation has
large number of risks but still below the number
of risks of commercial occupation. Meanwhile,
industrial occupation as the biggest premium
contributor only ranks third in terms of number
of risks. The reason is the industrial occupation
only locates on specific locations and not
located widespread all over Indonesia such as
Refinery Unit Pertamina. Lastly, agricultural
occupation has the least number of risks
compared to other occupations because
agricultural occupation is rarely insured with
7
S t a t i s t i k A s u r a n s i G e m p a B u m i I n d o n e s i a a s a t J u n e 2 0 1 1
lainnya karena sedikitnya okupasi ini yang
memiliki penutupan asuransi gempa bumi.
Sebagai sentuhan terakhir analisa pada
jumlah risiko, idealnya jumlah risiko terbesar
ada pada okupasi residensial yang diwakili
rumah tinggal. Namun kenyataannya okupasi
ini menempati peringkat kedua. Hal ini
diakibatkan selain sedikitnya rumah tinggal
yang memiliki asuransi gempa bumi, juga
jikapun terdapat rumah yang memiliki
asuransi gempa bumi, maka pertanggungan
gempa bumi tersebut berada pada paket
asuransi rumah tinggal (
house owners
insurance package
) yang tidak dimasukkan
dalam risiko asuransi gempa bumi yang
disesikan ke MAIPARK.
As the final touch on the analyze of number
of risks, ideally the number of risk lies on
residential occupation being represented by
dwelling houses. On the contrary, this
occupation ranks number two. The possible
reasons are there are little number of dwelling
houses having earthquake risks covers and if
they have, they have homeowners’ insurance
package which are not included in earthquake
8
S t a t i s t i k A s u r a n s i G e m p a B u m i I n d o n e s i a a s a t J u n e 2 0 1 1
E. Kontribusi Asuransi Gempa Bumi
Berdasarkan data dari Badan Pusat
Statistik dan Biro Perasuransian Indonesia
Bapepam LK tahun 2010, pertumbuhan
ekonomi Indonesia juga tercermin dalam
pertumbuhan industri asuransi, baik itu
asuransi jiwa maupun asuransi kerugian.
Dalam laporan yang dikeluarkan oleh Biro
Perasuransian Indonesia - Bapepam LK, yaitu
dalam buku Perasuransian Indonesia 2010,
tercatat penerimaan premi bruto asuransi di
tahun 2010 meningkat sebesar 17,5 % dari
tahun sebelumnya, yaitu dari Rp 106,4 triliun
menjadi Rp.125,1 triliun. Sedangkan
insurance
density
tahun 2010 tercatat sebesar
Rp.526.584 untuk jumlah penduduk Indonesia
sebanyak 237,6 juta jiwa di tahun 2010. Ini
berarti rata-rata penduduk Indonesia
menghabiskan Rp. 526.584 untuk membayar
premi asuransi. Sedangkan kontribusi premi
bruto sektor asuransi terhadap Produk
Domestik Bruto sebesar 1,95% pada tahun
yang sama. Hal ini berarti terjadi peningkatan
dari rasio tahun sebelumnya, yaitu sebesar
1,90%. Tabel 1.3 dibawah ini menjelaskan hal
tersebut dari tahun 2006 hingga tahun 2010.
.
E. Earthquake Insurance Contribution
Based on the data from Central Agency Of
Statistic and Indonesian Insurance Bureau –
Capital Market Investment Agency year 2010,
Indonesian economic development is reflected
on the insurance industry growth, either life
insurance or general insurance.
In the Insurance Directory 2010 report
issued by Indonesian Insurance Bureau of
Capital Market Investment Agency, the gross
premium income of 2010 increased 17.5 %
from Rp. 106.4 trillions to become Rp. 125.1
trillions. The insurance density in 2010
recorded Rp. 526,584 for Indonesia population
that reached 237.6 millions people. It also
means, each Indonesian resident spent Rp.
526,584 to buy insurance product. On the other
hand, gross premium income contribution
toward Gross Premium Products reached
1.95% in the same year. This ratio increases
from the last year’s ratio at 1.90%. Table 1.3
below shows such increment from year 2006 to
9
S t a t i s t i k A s u r a n s i G e m p a B u m i I n d o n e s i a a s a t J u n e 2 0 1 1
Dengan memperhatikan penyebaran
asuransi gempa bumi berdasarkan provinsi
maka selama tahun underwriting 2007 – tahun
underwriting 2010, rata-rata rasio premi bruto
tertinggi berada pada provinsi DKI Jakarta
(20,75%), Jawa Barat (18,93%), Jawa Timur
(14,35%) dan Banten (11,03%). DKI Jakarta
memiliki kontribusi premi asuransi gempa bumi
tertinggi selama tahun underwriting tersebut
karena selain sebagai pusat pemerintahan dan
pusat bisnis yang bernilai ekonomi tinggi,
masyarakat yang tinggal di ibukota negara
Indonesia ini relatif lebih memiliki kemampuan
finansial serta edukasi yang cukup baik tentang
asuransi.
Namun demikian jika dilihat dari kontribusi
asuransi gempa bumi terhadap pendapatan
domestik regional bruto atau penetrasi asuransi
per provinsi ternyata rata-rata rasio penetrasi
asuransi gempa bumi tertinggi selama tahun
By looking at the spread of earthquake
insurance by province during underwriting year
2007 – underwriting year 2010, the highest
average growth on gross premium is in DKI
Jakarta (20.75%), Jawa Barat (18.93%), Jawa
Timur (14.35%) dan Banten (11.03%). DKI
Jakarta gives the highest earthquake premium
contribution during those underwriting years
since DKI Jakarta is the capital city and the
central business having the highest economic
values. The people living in this capital city
relatively have good financial and insurance
educational background.
However, if we look at the earthquake
insurance premium contribution towards
regional GDP or insurance penetration per
province, the highest earthquake insurance
penetration ratio during underwriting year 2007
– underwriting year 2010 is in Banten Province
Tabel 1.3 Tabel Premi Bruto dan Produk Domestik Bruto 2006 - 2010Table 1.3 Gross Premiums and Gross Domestic Products 2006 – 2010 Table
Dalam Milyar Rupiah
1) Premi Bruto (termasuk Premi Program Jaminan Hari Tua (JHT)) = Premi Pos Langsung + Premi Reasuransi diterima dari Luar Negeri
Gross Premium (include Premium of Pension Benefits (JHT)) = Direct Premium + Reinsurance Premium Inward from Abroad
2) Sumber : Biro Pusat Statistik (BPS) berdasarkan Harga yang Berlaku
Source : Central Of Statistic Bureau (BPS) using Current Market Prices
10
S t a t i s t i k A s u r a n s i G e m p a B u m i I n d o n e s i a a s a t J u n e 2 0 1 1
underwiting 2007 – tahun underwriting 2010
terletak pada provinsi Banten yaitu sebesar
0,15% kemudian diikuti oleh Gorontalo sebesar
0,12%, Provinsi DKI Jakarta sebesar 0,06%
dan Provinsi Jawa Barat sebesar 0,06%.
Alasan mengapa penetrasi asuransi gempa
bumi tertinggi ada pada Provinsi Banten karena
selain memiliki rata-rata rasio premi bruto yang
cukup tinggi yaitu 11,03% , produk domestik
regional bruto Provinsi Banten relatif lebih kecil
dibandingkan DKI Jakarta dan Jawa Barat.
Industri baja, listrik, kimia dan pupuk
memberikan kontribusi terhadap pendapatan
premi bruto di provinsi ini. Yang cukup menarik
adalah provinsi Gorontalo sebagai peringkat
tertinggi kedua rata-rata rasio penetrasi
asuransi gempa bumi. Walaupun secara
rata-rata rasio premi bruto masih kecil, namun
jumlah premi bruto Provinsi Gorontalo di tahun
2009 mencapai Rp. 16.025,2 juta meningkat
2.649 % dari tahun sebelumnya Rp. 582,9 juta.
Begitupun di tahun 2010, premi bruto di
Provinsi ini tercatat sebesar Rp. 17.409,67 juta.
Kehadiran sektor perkebunan dan pupuk
memberikan kontribusi yang sangat besar
terhadap pendapatan premi bruto asuransi
gempa bumi pada provinsi ini. Selain itu,
produk domestik regional bruto Provinsi
Gorontalo relatif lebih kecil dibandingkan DKI
Jakarta serta Jawa Barat, sehingga penetrasi
asuransi gempa bumi provinsi ini menjadi
tinggi.
at 0.15% then Gorontalo Province at 0.12%,
DKI Province at 0.06% and West Java Province
at 0.06%.
The reason why the highest earthquake
insurance penetration ratio lies on Banten
Province is because Banten Province has an
average significant gross premium growth ratio
at 11.03% and the regional GDP of Banten is
relatively small compared to DKI Jakarta and
West Java. Steel manufacturer, Electricity,
Chemistry and Fertilizer gives contribution
towards gross premium income for this
province. The most interesting thing is
Gorontalo province ranks the second highest
earthquake insurance gross premium.
Although the average gross premium ratio is
still small, the gross premium income of
Gorontalo Province reached Rp. 16,025.2
million in 2009. It increased 2,649% from the
previous year at Rp. 582.9 million. In 2010, the
gross premium of this province recorded Rp
17,409.67 million. The existence of plantation
sector and fertilizer gives significant
contribution towards gross premium income for
this province. Moreover, the GDP of Gorontalo
is relatively small comparing to DKI Jakarta and
West Java and it makes the insurance
penetration ratio for this province becomes
11
S t a t i s t i k A s u r a n s i G e m p a B u m i I n d o n e s i a a s a t J u n e 2 0 1 1
Sebagai catatan, sesuai dengan yang
dilaporkan Badan Pusat Statistik (BPS) maka
tabel Produk Domestik Regional Bruto yang
ditampilkan hanya sampai tahun 2010,
sehingga pembahasan dan analisa untuk
penetrasi asuransi gempa bumi tahun 2011
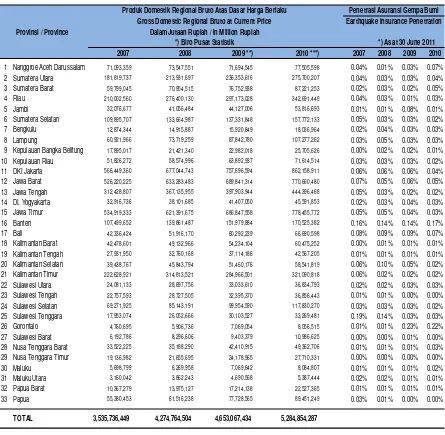
akan dilakukan pada laporan semester
berikutnya.
Tabel 1.4 dibawah ini menyajikan
kontribusi pendapatan premi asuransi gempa
bumi yang dibagi berdasarkan provinsi, catatan
per tanggal 30 Juni 2011.
As a supplementary note, the GDP
Regional shown is only for the period until 2010
as being reported by Statistic Central Agency.
Therefore the presentation and analyze for
earthquake insurance penetration for 2011 will
be presented in the report next semester.
This following table 1.4 shows earthquake
insurance contribution by province, as at June
30, 2011.
Tabel 1.4 Premi Bruto Asuransi Gempa Bumi Berdasarkan Provinsi 2007 – 2011 Table 1.4 Earthquake Gross Premiums by Province 2007 - 2011
Dalam Jutaan Rupiah In Million Rupiah
2007 % 2008 % 2009 % 2010 % 2011 %
1. Nanggroe Aceh Darussalam 28,766.10 1.5% 6,056.94 0.3% 18,823.43 1.0% 56,476.14 2.7% 57.54 0.0%
2. Sumatera Utara 67,024.43 3.6% 62,159.08 3.2% 79,619.17 4.1% 117,390.13 5.6% 22,169.14 4.9%
3. Sumatera Barat 10,460.74 0.6% 20,362.62 1.1% 17,576.09 0.9% 41,270.02 2.0% 6,231.51 1.4%
4. Riau 73,686.77 4.0% 94,150.39 4.9% 44,559.52 2.3% 94,625.28 4.5% 6,612.75 1.5%
5. Jambi 4,161.64 0.2% 5,079.95 0.3% 33,240.67 1.7% 3,987.52 0.2% 253.06 0.1%
6. Sumatera Selatan 51,863.11 2.8% 34,390.65 1.8% 37,785.54 1.9% 31,430.67 1.5% 3,449.55 0.8%
7. Bengkulu 2,371.38 0.1% 6,065.30 0.3% 5,566.64 0.3% 5,524.20 0.3% 808.52 0.2%
8. Lampung 20,307.59 1.1% 35,398.58 1.8% 30,693.42 1.6% 30,699.54 1.5% 9,203.48 2.0%
9. Kepulauan Bangka Belitung 473.82 0.0% 3,308.46 0.2% 4,248.69 0.2% 3,203.27 0.2% 224.64 0.0%
10. Kepulauan Riau 16,466.74 0.9% 17,790.88 0.9% 17,165.29 0.9% 16,270.10 0.8% 3,383.94 0.7%
11. DKI Jakarta 366,667.61 19.7% 422,229.71 22.0% 446,256.16 22.9% 386,149.84 18.4% 110,453.44 24.4%
12. Jawa Barat 342,953.86 18.5% 335,091.75 17.5% 385,968.35 19.8% 418,980.57 19.9% 78,725.68 17.4%
13. Jawa Tengah 146,422.95 7.9% 127,092.83 6.6% 94,932.96 4.9% 107,000.11 5.1% 13,473.78 3.0%
14. DI. Yogyakarta 6,742.19 0.4% 12,570.39 0.7% 15,006.08 0.8% 15,166.51 0.7% 8,912.75 2.0%
15. Jawa Timur 260,796.85 14.0% 304,918.63 15.9% 284,784.55 14.6% 270,954.83 12.9% 74,078.14 16.4%
16. Banten 173,734.44 9.3% 193,894.47 10.1% 215,414.22 11.1% 286,165.13 13.6% 61,656.54 13.6%
17. Bali 33,147.17 1.8% 47,348.44 2.5% 53,148.99 2.7% 49,406.59 2.3% 10,008.56 2.2%
18. Kalimantan Barat 1,812.98 0.1% 3,243.69 0.2% 4,204.39 0.2% 3,403.95 0.2% 311.06 0.1%
19. Kalimantan Tengah 2,776.69 0.1% 3,603.39 0.2% 5,420.12 0.3% 4,796.22 0.2% 2,550.85 0.6%
20. Kalimantan Selatan 25,172.71 1.4% 45,826.94 2.4% 24,331.56 1.2% 11,580.16 0.6% 4,103.62 0.9%
21. Kalimantan Timur 134,804.71 7.3% 57,297.32 3.0% 53,905.95 2.8% 69,792.99 3.3% 6,187.39 1.4%
22. Sulawesi Utara 5,212.40 0.3% 5,963.57 0.3% 10,929.62 0.6% 10,691.00 0.5% 3,831.76 0.8%
23. Sulawesi Tengah 1,572.83 0.1% 1,838.98 0.1% 1,536.27 0.1% 1,619.98 0.1% 50.96 0.0%
24. Sulawesi Selatan 23,375.82 1.3% 24,170.27 1.3% 25,690.99 1.3% 17,730.37 0.8% 2,286.95 0.5%
25. Sulawesi Tenggara 34,445.67 1.9% 36,382.59 1.9% 8,814.04 0.5% 9,645.87 0.5% 18.98 0.0%
26. Gorontalo 574.73 0.0% 582.96 0.0% 16,025.17 0.8% 17,409.67 0.8% 23,065.15 5.1%
27. Sulawesi Barat 86.01 0.0% 117.89 0.0% 651.12 0.0% 507.72 0.0% 0.00 0.0%
28. Nusa Tenggara Barat 3,813.83 0.2% 2,905.63 0.2% 2,712.02 0.1% 13,726.21 0.7% 310.01 0.1%
29. Nusa Tenggara Timur 530.99 0.0% 738.08 0.0% 899.32 0.0% 1,146.29 0.1% 170.03 0.0%
30. Maluku 534.01 0.0% 513.23 0.0% 877.95 0.0% 1,562.24 0.1% 166.12 0.0%
31. Maluku Utara 706.34 0.0% 733.66 0.0% 579.35 0.0% 529.01 0.0% 3.83 0.0%
32. Papua Barat 1,168.85 0.1% 1,387.40 0.1% 1,615.79 0.1% 1,844.02 0.1% 4.84 0.0%
33. Papua 15,538.94 0.8% 6,475.53 0.3% 3,720.75 0.2% 3,241.36 0.2% 158.29 0.0%
TOTAL 1,858,174.90 100.0% 1,919,690.17 100.0% 1,946,704.18 100.0% 2,103,927.51 100.0% 452,922.87 100.0%
Provinsi / Province
PREMI BRUTO ASURANSI GEMPA BUMI
Premi Bruto Asuransi Gempa Bumi Berdasarkan Provinsi 2007 - 2011
Earthquake Gross Premium By Province 2007 - 2011
EARTHQUAKE INSURANCE GROSS PREMIUM *) As at 30 June 2011
12
S t a t i s t i k A s u r a n s i G e m p a B u m i I n d o n e s i a a s a t J u n e 2 0 1 1
Tabel 1.5 dibawah ini menyajikan penetrasi
asuransi gempa bumi per provinsi dan peta 1.1
menunjukkan distribusi eksposur asuransi
gempa bumi di Indonesia untuk tahun
underwriting 2011 berdasarkan provinsi,
catatan per tanggal 30 Juni 2011
This following table 1.5 shows earthquake
insurance penetration per province, and map
1.1 shows Indonesia earthquake exposure
distribution per province for underwriting year
2011 as at June 30, 2011
.
Tabel 1.5 / Table 1.5