Metagenomic analysis of buffalo rumen
microbiome: Effect of roughage diet on
Dormancy and Sporulation genes
K.M. Singh
a,1, B. Reddy
a, A.K. Patel
a, H. Panchasara
b, N. Parmar
a, A.B. Patel
a,
T.M. Shah
a, V.D. Bhatt
a, C.G. Joshi
a,⁎
aDepartment of Animal Biotechnology, College of Veterinary Science & Animal Husbandry, Anand Agricultural University, Anand 388 001, Gujarat, India
bLivestock Research Station, Sardar Krushinagar Agricultural University, India
a r t i c l e
i n f o
a b s t r a c t
Article history:
Received 5 September 2013 Revised 6 January 2014 Accepted 16 January 2014 Available online xxxx
Buffalo rumen microbiome experiences a variety of diet stress and represents reservoir of Dormancy and Sporulation genes. However, the information on genomic responses to such conditions is very limited. The Ion Torrent PGM next generation sequencing technology was used to characterize general microbial diversity and the repertoire of microbial genes present, including genes associated with Dormancy and Sporulation
in Mehsani buffalo rumen metagenome. The researchfindings revealed
the abundance of bacteria at the domain level and presence of Dormancy and Sporulation genes which were predominantly associated with the Clostridia and Bacilli taxa belonging to the phyla Firmicutes. Genes associated with Sporulation cluster and Sporulation orphans were increased from 50% to 100% roughage treatment, thereby promoting sporulation all along the treatments. The spore germination is observed to be the highest in the 75% roughage treatment both in the liquid and solid rumen fraction samples with respect to the decrease in the values of the genes associated with spore core dehydration, thereby facilitating spore core hydration which is necessary for spore germination.
© 2014 The Authors. Published by Elsevier B.V. This is an open access article under the CC BY-NC-ND license (http://creativecommons.org/licenses/by-nc-nd/3.0/). Keywords:
Mehsani buffalo Metagenome Ion Torrent PGM Dormancy Sporulation
Meta Gene 2 (2014) 252–268
⁎ Corresponding author. Tel./fax: +91 2692 261201. E-mail address:[email protected](C.G. Joshi).
1Present address: Xcelris Genomics, Xcelris Labs Ltd, Ahmedabad, Gujarat, India.
2214-5400/© 2014 The Authors. Published by Elsevier B.V. This is an open access article under the CC BY-NC-ND license (http://creativecommons.org/licenses/by-nc-nd/3.0/).
1. Introduction
The rumen is characterized by high microbial population density, high diversity and complexity of interactions. Bacteria predominate in the rumen, along with a variety of anaerobic protozoa, archaea and fungi (Hespell et al., 1997) and the associated occurrence of bacteriophage. The rumen can be assumed as a kind of anaerobic fermentation tank, in which rumen microorganisms interact with each other (Moto, 2008). Microbes survive in the rumen under different constraints which may be either natural or feed associated, as some of the feeds contain a significant amount of anti-nutritional factors, which sometimes limit the growth of some of these natural microbial inhabitants (Sahu et al., 2004). Many workers have reported influences of multiple factors on the composition of rumen microbiota and thus affecting the population of certain bacterial groups (Fonty et al., 1987; Romero-Pérez et al., 2011).
Bacteria have the ability to adapt to different growth conditions and to survive in various environments. They also have the capacity to enter into dormant states. Some bacteria form spores when exposed to stresses such as starvation and oxygen deprivation (Bhupender et al., 2010). Endospores are dormant, non-reproductive and enzymatically inert forms of bacterial vegetative cells (Cano and M.K.B., 2012). Endospore-producing bacteria are also conventionally termed as “sporulating bacteria” (Cano and M.K.B., 2012).
The spores serve to protect the bacterium from harmful environmental conditions by reducing into a desiccated, cryptobiotic and highly defensive state, which provides resistance to many environmental conditions that would otherwise harm and kill the vegetative form of the bacterium. These environmental conditions include extreme temperatures, radiation, extreme pH levels, extreme pressures and harmful chemical agents (Cano and M.K.B., 2012). Breaking of the dormant state of bacterial spores is the initiating event in germination. Glucose, certain amino acids, nucleosides, and even salts are among the many agents which induce initiation, however the mechanism is not understood (Woese et al., 1968). Uncultured bacteria are predicted to be a significant reservoir of novel small-molecule biosynthetic machinery (Brady et al., 1998; Rondon et al., 2000). Functional metagenomics is one of the approaches by which one can access the biosynthetic potential contained within the genomes of uncultured bacteria (Brady et al., 1998). Despite of importance of the rumen microbial population to host health and productivity, knowledge about Dormancy and Sporulation and Cell wall and Capsule genes of bacteria remains relatively rudimentary. Massive parallel sequencing (MPS) of metagenome DNA without targeted amplification, termed metagenomics, avoids these issues while enabling a substantial increase in the volume of data produced. In addition, the cost of MPS is falling rapidly. Untargeted MPS involves extracting whole DNA or RNA from the community or tissue of interest (Hess et al., 2011).
The metagenomics RAST (MG-RAST) server is a fully automated open source system for processing metagenome sequence. A public accessibility of this system has been provided for all researchers to analyse their metagenome. MG-RAST is available over the web to all researchers, and access is not limited to specific groups or data types. The MG-RAST server is an open source system based on the SEED framework for comparative genomics (Tyson et al., 2004; Huse, 2007). This approach highlights subsystems that are unique to a metagenome, a comparative genome, or the subsystems common to both. With the identification of Dormancy and Sporulation associated bacterial genes in the buffalo rumen, the role of the microbiota as a reservoir of dormant state in bacterial spores' genes needs to be explored. The objective of the present study was to make a comparative analysis at the functional level with respect to the SEED subsystem Dormancy and Sporulation, Cell wall and Capsule and Fatty acids, lipids and Isoprenoids ofBubalus bubalisrumen metagenome sample.
2. Materials and methods
2.1. Sample collection
from the rumen of the buffalo, in the last week of treatment at 2 and ½ h after morning feeding using a flexible stomach tube. Approximately 500 ml of the rumenfluid collected wasfiltered through muslin cloth and thefiltrate was aliquoted into the 2 ml cryo-vials. The solid fraction was also aliquoted into 2 ml cryo-vials. These vials were then immediately frozen into liquid nitrogen.
2.2. DNA extraction
DNA extraction was carried out from 200 ml of the green and dry liquid rumen samples as well as 200 mg of the green and dry solid rumen samples using the commercially available QIAamp DNA stool mini kit (Qiagen, USA). Metagenome was quantified by using the Nanodrop Spectrophotometer.
2.3. Shotgun sequencing
The Ion Xpress™Fragment Library Kit (Life Technologies, Carlsbad, CA) was used to construct a library for shotgun sequencing on the Ion Personal Genome Machine (PGM, Ion Torrent/Life Technologies). The DNA was subjected to enzymatic fragmentation and library was constructed using the Ion Fragment Library Kit protocol. Adaptors were ligated to the repaired fragment ends followed by size selection. The library was PCR amplified using forward and reverse primers. The quality and the quantity of each of the libraries were assessed with the 2100 Bioanalyzer (DNA High Sensitivity Chip, Agilent Technologies, Sunnyvale, CA). Templates were then prepared and enriched on the Ion Sphere Particles™(ISPs) using the Ion Xpress™Template Kit (Life Technologies) and subjected to sequencing using the Ion Express Template 200 kit (Life Technologies, USA). Signal processing and base calling were performed with Torrent Analysis Suite version 3.4.1.
2.4. Data analysis
The sequence data were uploaded onto the publically available server MG RAST (Meta Genome Rapid Annotation using Subsystem Technology, v3.3). The taxonomic domain groups were assigned using MG RAST against M5NR database, which is an integration of many sequence databases into a single and searchable database. A single similarity search at this server will allow retrieving similarities to several databases, including NCBI-nr, KEGG, and SEED. Global gene expressions were annotated with the SEED Subsystems in MG RAST with the datasets having a cut-off of e-valueb1e−5, % identity cut-off of 60% and
minimum alignment cut-off of 15 bp to get the metabolic pathway information.
2.5. GO Slim analysis
The Gene Ontology analysis was performed using GO Slim. GO Slims are cut down versions of gene ontologies containing a subset of the terms in the whole GO. The reads corresponding to the 50%, 75% and 100% green and dry roughage treatments were analysed with the Interpro database and the hit values generated were used in the GO Slim analysis which gave a broad overview of the ontology content without the detail of specificfine grained terms.
2.6. Statistical analysis
Standard errors for the datasets were calculated using the SPSS Statistics software v17 and One-way ANOSIM through the PAST tool was performed to check for the statistical significance of differences between results obtained for the different feed treatments. The ANOSIM test statistic,R, is a measure of the magnitude of dissimilarity within whereRvalues near 0 that indicate dissimilarities between sample points within one group are equivalent to the dissimilarities found between different groups. Statistical significances in the form ofPvalues were calculated for each pair-wiseRvalue (Clarke, 1993).
3. Result
Next generation sequencing has lead to the characterization and identification of the functional capacity of the rumen microbial communities. The summary of metagenome data is presented inTable 1. In the present study, metagenomic sequences were used to characterize genetic diversity and functional Table 1
The output of the sequencing runs of the rumen samples on Ion Torrent PGM (In the table the output for the Liquid and Solid samples for each treatment is in terms of the average of four samples each for liquid and solid groups).
Roughage treatment Data in (Mbp) Mean read length (bp) Post QC sequence count Total number of reads
50% (M1) Liquid 549.4 146 18,04,783 18,91,804
Solid 736.0 149 26,30,228 29,13,490
75% (M2) Liquid 438.0 161 18,77,607 21,25,995
Solid 689.9 149 31,99,080 32,32,711
100% (M3) Liquid 800.7 180 32,27,832 35,57,735
Solid 701.0 170 36,34,016 40,16,804
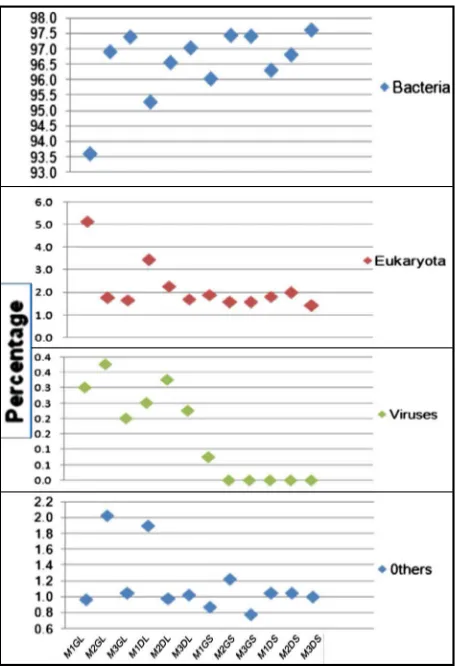
Fig. 1.The taxonomic domain information of the DNA datasets. Total DNA sequences were assigned to bacteria, eukaryota, viruses,
capability of the rumen microbiota of the buffalo. Analysis of community composition in rumenfluid confirmed enrichment for prokaryotic populations with high numbers.
3.1. Taxonomic assignment
After beingfiltered by MG-RAST based on length and number of ambiguous bases, the datasets were used for the taxonomic analysis. Using M5NR database, the domain-level breakdown of our samples was predominated by bacteria followed by eukaryotes, archaea and viruses (Fig. 1), accounting for a minimum of 89.60% in M1 Green liquid to a maximum of 97.6% in M3 Dry solid, while eukaryote comprised approximately 1.40% to 9.10% of total sequences in the DNA from the samples. Viruses accounted for 0.2% to 0.3% in the DNA sequences from most of the samples.
3.2. Predicted gene functions
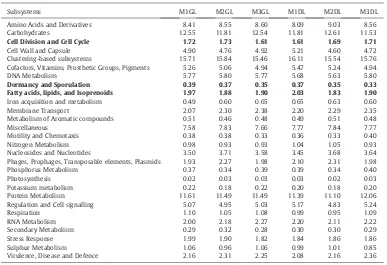
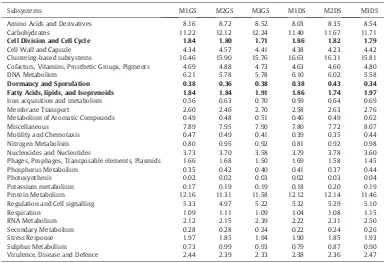
Analysis of the MGRAST results indicated the presence of functionally characterized protein encoding genes (PEGs) (Tables 2 and 3). The highest proportion of gene fragments assigned to known functions was associated with clustering based subsystems ranging from 15.46% to 16.63%, followed by genes associated with carbohydrate metabolism (11.22% to 12.61%) and then protein metabolism (11.10% to 12.16%). The genes associated with Dormancy and sporulation, Cell wall and Capsule and Fatty acids, lipids and Isoprenoids ranged between 0.33% and 0.43%, 4.23% and 5.21% and 1.74% and 2.03% respectively (Fig. 2A and B). One-way ANOSIM analysis showed significant difference in the gene functions of M3 liquid samples with that of M1 and M2 liquid samples, with no difference between M1 and M2 liquid samples
Table 2
Functional genes present in the buffalo rumen liquid samples (Values are in percentage).
Subsystems M1GL M2GL M3GL M1DL M2DL M3DL
Amino Acids and Derivatives 8.41 8.55 8.60 8.09 9.03 8.56
Carbohydrates 12.55 11.81 12.54 11.81 12.61 11.53
Cell Division and Cell Cycle 1.72 1.73 1.61 1.61 1.69 1.71
Cell Wall and Capsule 4.90 4.76 4.92 5.21 4.60 4.72
Clustering-based subsystems 15.71 15.84 15.46 16.11 15.54 15.76
Cofactors, Vitamins, Prosthetic Groups, Pigments 5.26 5.06 4.94 5.47 5.24 4.94
DNA Metabolism 5.77 5.80 5.77 5.68 5.63 5.80
Dormancy and Sporulation 0.39 0.37 0.35 0.37 0.35 0.33
Fatty acids, lipids, and Isoprenoids 1.97 1.88 1.90 2.03 1.83 1.90
Iron acquisition and metabolism 0.49 0.60 0.65 0.65 0.63 0.60
Membrane Transport 2.07 2.30 2.38 2.20 2.29 2.35
Metabolism of Aromatic compounds 0.51 0.46 0.48 0.49 0.51 0.48
Miscellaneous 7.58 7.83 7.66 7.77 7.84 7.77
Motility and Chemotaxis 0.38 0.38 0.33 0.36 0.33 0.40
Nitrogen Metabolism 0.98 0.93 0.93 1.04 1.05 0.93
Nucleosides and Nucleotides 3.50 3.71 3.58 3.45 3.68 3.64
Phages, Prophages, Transposable elements, Plasmids 1.93 2.27 1.98 2.10 2.31 1.98
Phosphorus Metabolism 0.37 0.34 0.39 0.39 0.34 0.40
Photosynthesis 0.02 0.03 0.03 0.03 0.02 0.03
Potassium metabolism 0.22 0.18 0.22 0.20 0.18 0.20
Protein Metabolism 11.61 11.49 11.49 11.39 11.10 12.06
Regulation and Cell signalling 5.07 4.95 5.03 5.17 4.83 5.24
Respiration 1.10 1.05 1.08 0.99 0.95 1.09
RNA Metabolism 2.00 2.18 2.27 2.20 2.11 2.22
Secondary Metabolism 0.29 0.32 0.28 0.30 0.30 0.29
Stress Response 1.99 1.90 1.82 1.84 1.86 1.86
Sulphur Metabolism 1.06 0.96 1.06 0.99 1.01 0.85
Virulence, Disease and Defence 2.16 2.31 2.25 2.08 2.16 2.36
(Table 4), whereas for the Solid samples only M1 Dry solid showed difference with M2 Green and Dry solid and M3 Green and Dry solid samples (Table 5).
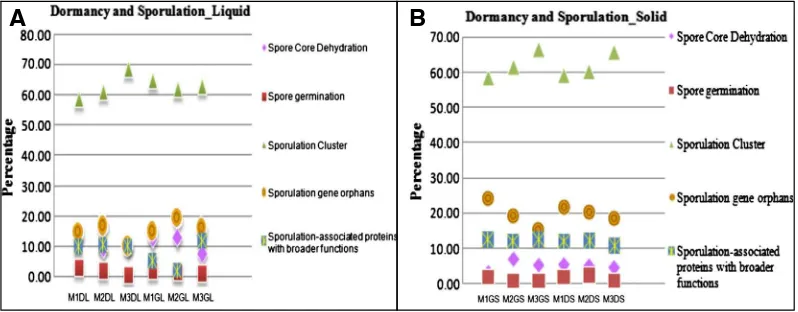
3.3. Dormancy and Sporulation
There are multiple classes of Dormancy and sporulation, Cell wall and Capsule and Fatty acids, lipids and Isoprenoids within each functional group. In this study, we used the MG-RAST classification of Dormancy and Sporulation to categorize functional genes. Among the Dormancy and Sporulation genes, sporulation cluster genes were predominant both in liquid (58.97% to 68.98%) and solid (58.46% to 66.51%) samples, which are involved in promoting sporulation to form dormant spores which can survive under stressful conditions (Fig. 3A and B). About 10.12% to 19.20% (liquid samples) and 15.32% to 24.39% (solid samples) of Dormancy and Sporulation genes fell in the category of sporulation gene orphans, which were involved in sporulation; transcription and transcription regulation. Sporulation associated proteins involved in cell cycle; cell-division; septation and sporulation were in the range of 2.04% to 12.08% for liquid samples and 10.57% to 12.44% for solid samples. 7.66% to 13.09% (liquid samples) and 3.07% to 6.88% (solid samples) of genes were associated with spore core dehydration, which is responsible for the maturation of the spore and its dormancy. Also the genes involved in spore germination ranged from 0.43% to 3.23% and 0.44% to 2.42% in liquid and solid samples, respectively (Fig. 3A and B). The statistical analysis using One-Way ANOSIM also revealed significant differences between all the three treatments both for the solid and liquid samples (Tables 4 and 5).
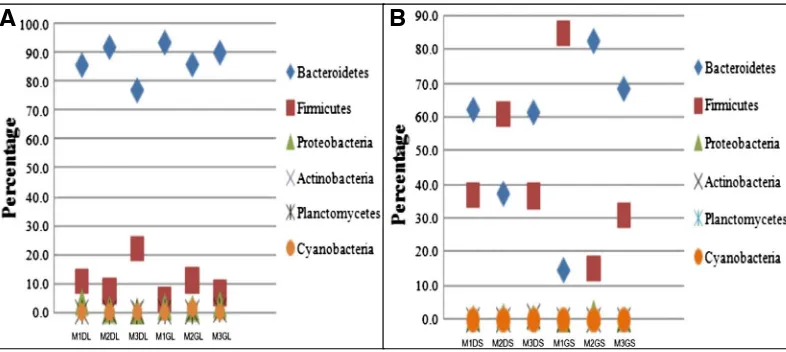
In order tofind out which bacterial community contributed to the SEED Subsystem Level 2 category of Dormancy and Sporulation sequence alignment using BLAT integrated in the MG RAST database was carried out which made it possible to look closer at which organisms were associated with the genes assigned to each of the subcategory. Our results revealed that the predominant phylum was of Bacteroidetes followed by Firmicutes and then Proteobacteria in the liquid samples, whereas in the solid Table 3
Functional genes present in the buffalo rumen solid samples (Values are in percentage).
Subsystems M1GS M2GS M3GS M1DS M2DS M3DS
Amino Acids and Derivatives 8.16 8.72 8.52 8.03 8.35 8.54
Carbohydrates 11.22 12.12 12.24 11.40 11.67 11.71
Cell Division and Cell Cycle 1.84 1.80 1.71 1.86 1.82 1.79
Cell Wall and Capsule 4.34 4.57 4.41 4.38 4.23 4.42
Clustering-based subsystems 16.46 15.90 15.76 16.63 16.31 15.81
Cofactors, Vitamins, Prosthetic Groups, Pigments 4.69 4.88 4.73 4.63 4.60 4.80
DNA Metabolism 6.21 5.78 5.78 6.10 6.02 5.58
Dormancy and Sporulation 0.38 0.36 0.38 0.38 0.43 0.34
Fatty Acids, lipids, and Isoprenoids 1.84 1.84 1.91 1.86 1.74 1.97
Iron acquisition and metabolism 0.56 0.63 0.70 0.59 0.64 0.69
Membrane Transport 2.60 2.46 2.70 2.58 2.63 2.76
Metabolism of Aromatic Compounds 0.49 0.48 0.51 0.46 0.49 0.62
Miscellaneous 7.89 7.95 7.90 7.80 7.72 8.07
Motility and Chemotaxis 0.47 0.49 0.41 0.39 0.35 0.44
Nitrogen Metabolism 0.80 0.95 0.92 0.81 0.92 0.98
Nucleosides and Nucleotides 3.73 3.70 3.58 3.79 3.78 3.60
Phages, Prophages, Transposable elements, Plasmids 1.66 1.68 1.50 1.69 1.58 1.45
Phosphorus Metabolism 0.35 0.42 0.40 0.41 0.37 0.44
Photosynthesis 0.02 0.02 0.03 0.02 0.03 0.04
Potassium metabolism 0.17 0.19 0.19 0.18 0.20 0.19
Protein Metabolism 12.16 11.31 11.58 12.12 12.14 11.46
Regulation and Cell signalling 5.33 4.97 5.22 5.32 5.29 5.10
Respiration 1.09 1.11 1.09 1.04 1.08 1.15
RNA Metabolism 2.12 2.15 2.39 2.22 2.31 2.50
Secondary Metabolism 0.28 0.28 0.24 0.22 0.24 0.26
Stress Response 1.97 1.85 1.94 1.90 1.85 1.93
Sulphur Metabolism 0.73 0.99 0.93 0.79 0.87 0.90
A
B
Fig. 2.(A) Chart showing the comparative picture in terms of percentage values for the liquid samples along with their standard errors of mean and (B) chart showing the comparative picture in
terms of percentage values for the solid samples along with their calculated standard errors of mean assigned to the three SEED Subsystem Level 1 categories: Cell Wall and Capsule, Dormancy and Sporulation and Fatty acids, lipids and Isoprenoids.
258
K.M.
Singh
et
al.
/
Meta
Gene
2
(2014)
252
–
rumen samples the proportion of Firmicutes was more than that in liquid samples (Fig. 4A and B). Clostridia were the predominant taxa contributing to the expression of the genes responsible for spore germination, and sporulation, and sigma factors were associated with sporulation and these mainly comprised of the species likeClostridiumandBacillussp.
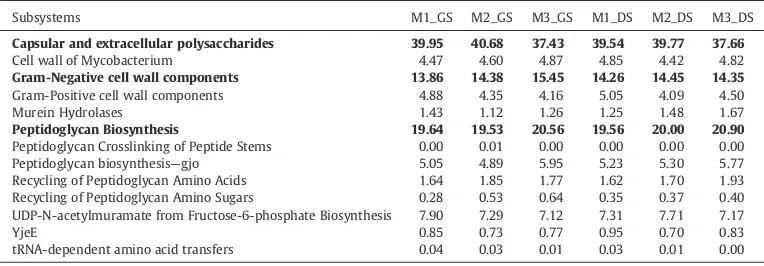
3.4. Gene assignments to Cell Wall and Capsule
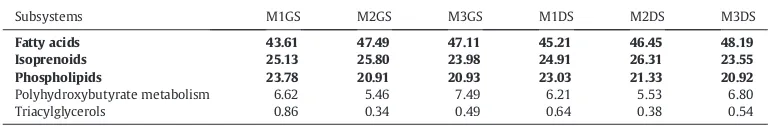
In the category of Cell Wall and Capsule; Capsular and extracellular polysaccharides, Gram-Negative cell wall components and Peptidoglycan Biosynthesis were predominant in all samples. The Cell wall of Mycobacterium, Gram-Positive cell wall components, Murein Hydrolases, Peptidoglycan Crosslinking of Peptide Stems, YjeE, Recycling of Peptidoglycan Amino Sugars, UDP-N-acetylmuramate from Fructose-6-phosphate Biosynthesis and tRNA-dependent amino acid transfers are very less abundant (Tables 6 and 7). Metabolic potential of Fatty acids, lipids and Isoprenoids was present in all samples with high abundance. However, Polyhydroxybutyrate metabolism and Triacylglycerols related functions including abundances were very less (Tables 8 and 9). The statistically significant difference for the SEED Subsystem Level 2 categories of Cell Wall and Capsule, Fatty acids, lipids and Isoprenoids and Dormancy and Sporulation is given inTables 10–15.
3.5. Go Slim analysis
The Gene ontology analysis was performed using GO Slim to identify various functional classes of genes in the buffalo rumen metagenome sample. The GO Slim term associated with Sporulation showed notable variation in the function of the genes across treatments for both the liquid and solid samples with the highest gene function in the 100% roughage treatment and the lowest in the 75% roughage treatment (Fig. 5A and B).
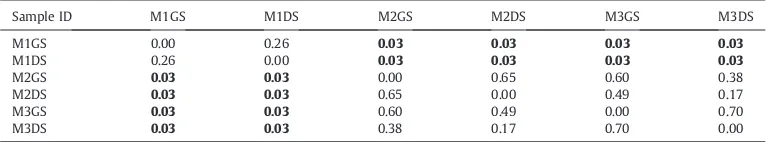
Table 5
Output of the One-way ANOSIM carried out using PAST tool to check the statistically significant difference for the solid samples at the SEED Subsystem Level 1 for the mentioned three categories Cell Wall and Capsule, Dormancy and Sporulation and Fatty acids, lipids and Isoprenoids. (Values in bold denote significant difference between the respective groups).
SAMPLE ID M1GS M1DS M2GS M2DS M3GS M3DS
M1GS 0.00 0.11 0.23 0.65 0.29 0.54
M1DS 0.11 0.00 0.03 0.03 0.03 0.06
M2GS 0.23 0.03 0.00 0.20 0.86 0.52
M2DS 0.65 0.03 0.20 0.00 0.20 0.25
M3GS 0.29 0.03 0.86 0.20 0.00 0.83
M3DS 0.54 0.06 0.52 0.25 0.83 0.00
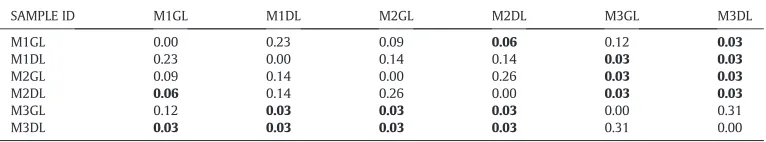
Table 4
Output of the One-way ANOSIM carried out using PAST tool to check the statistically significant difference for the liquid samples at the SEED Subsystem Level 1 for the three categories Cell Wall and Capsule, Dormancy and Sporulation and Fatty acids, lipids and Isoprenoids. (Values in bold denote significant difference between the respective groups).
SAMPLE ID M1GL M1DL M2GL M2DL M3GL M3DL
M1GL 0.00 0.23 0.09 0.06 0.12 0.03
M1DL 0.23 0.00 0.14 0.14 0.03 0.03
M2GL 0.09 0.14 0.00 0.26 0.03 0.03
M2DL 0.06 0.14 0.26 0.00 0.03 0.03
M3GL 0.12 0.03 0.03 0.03 0.00 0.31
A
B
Fig. 3.(A) Percentage values calculated for the liquid samples and (B) percentage values calculated for the solid samples using minimum cut off value of 60% based on the reads corresponding to
the SEED Subsystem Level 2 subcategory of Dormancy and Sporulation.
260
K.M.
Singh
et
al.
/
Meta
Gene
2
(2014)
252
–
Fig. 4.(A) The phylum level distribution of the organisms in the liquid rumen samples and (B) the phylum level distribution of the organisms in the solid rumen samples for the SEED Subsystem Level 2 category of Dormancy and Sporulation using BLAT using minimum identity cut off of 80%.
261
K.M.
Singh
et
al.
/
Meta
Gene
2
(2014)
252
–
4. Discussion
This study demonstrates that untargeted sequencing can be used to detect genes relayed to dormancy and sporulation, Cell wall and Capsule from buffalo rumen metagenomes. The method described for deriving rumen microbiome profiles allows comparison of samples based on the whole population. Using Table 6
Percentage values calculated using minimum cut off value of 60% based on the reads corresponding to each SEED Subsystem Level 2 subcategory of Cell Wall and Capsule for the liquid samples.
Subsystems M1_GL M2_GL M3_GL M1_DL M2_DL M3_DL
Capsular and extracellular polysaccharides 38.12 39.12 40.06 38.92 40.18 38.72
Cell wall of Mycobacterium 5.71 5.22 4.96 5.57 5.40 5.75
Gram-Negative cell wall components 17.02 16.26 16.29 15.70 14.81 16.38
Gram-Positive cell wall components 4.62 4.77 4.39 4.22 4.66 4.14
Murein Hydrolases 1.33 1.12 1.09 1.14 1.11 1.18
Peptidoglycan Biosynthesis 17.64 18.12 17.96 19.72 17.37 18.49
Peptidoglycan Crosslinking of Peptide Stems 0.04 0.00 0.01 0.00 0.00 0.00
Peptidoglycan biosynthesis—gjo 5.09 4.92 5.10 5.25 5.16 5.08
Recycling of Peptidoglycan Amino Acids 2.53 1.86 2.13 1.86 2.02 2.01 Recycling of Peptidoglycan Amino Sugars 0.49 0.65 0.51 0.46 0.95 0.54 UDP-N-acetylmuramate from Fructose-6-phosphate Biosynthesis 6.49 6.92 6.43 6.11 7.59 6.82
YjeE 0.92 1.05 1.04 1.04 0.74 0.89
tRNA-dependent amino acid transfers 0.00 0.00 0.01 0.00 0.00 0.01
Table 7
Percentage values calculated using minimum cut off value of 60% based on the reads corresponding to each SEED Subsystem Level 2 subcategory of Cell Wall and Capsule for the solid samples.
Subsystems M1_GS M2_GS M3_GS M1_DS M2_DS M3_DS
Capsular and extracellular polysaccharides 39.95 40.68 37.43 39.54 39.77 37.66
Cell wall of Mycobacterium 4.47 4.60 4.87 4.85 4.42 4.82
Gram-Negative cell wall components 13.86 14.38 15.45 14.26 14.45 14.35
Gram-Positive cell wall components 4.88 4.35 4.16 5.05 4.09 4.50
Murein Hydrolases 1.43 1.12 1.26 1.25 1.48 1.67
Peptidoglycan Biosynthesis 19.64 19.53 20.56 19.56 20.00 20.90
Peptidoglycan Crosslinking of Peptide Stems 0.00 0.01 0.00 0.00 0.00 0.00
Peptidoglycan biosynthesis—gjo 5.05 4.89 5.95 5.23 5.30 5.77
Recycling of Peptidoglycan Amino Acids 1.64 1.85 1.77 1.62 1.70 1.93 Recycling of Peptidoglycan Amino Sugars 0.28 0.53 0.64 0.35 0.37 0.40 UDP-N-acetylmuramate from Fructose-6-phosphate Biosynthesis 7.90 7.29 7.12 7.31 7.71 7.17
YjeE 0.85 0.73 0.77 0.95 0.70 0.83
tRNA-dependent amino acid transfers 0.04 0.03 0.01 0.03 0.01 0.00
Table 8
Percentage values calculated using minimum cut off value of 60% based on the reads corresponding to each subcategory of Fatty acids, lipids and Isoprenoids at the Subsystem Level 2 for the liquid samples.
Subsystems M1GL M2GL M3GL M1DL M2DL M3DL
Fatty acids 52.33 47.45 51.30 50.28 49.08 50.96
Isoprenoids 26.77 25.27 24.86 25.46 28.12 24.05
Phospholipids 17.73 22.10 18.11 21.98 17.95 20.72
Polyhydroxybutyrate metabolism 2.91 4.97 5.48 2.08 4.46 4.12
Triacylglycerols 0.26 0.22 0.24 0.20 0.39 0.16
SEED database, the domain-level breakdown of our samples was bacteria, eukaryotes and viruses (Fig. 1). The distribution of sequences from the bacteria was congruent with the distribution of SSU rRNA phylotypes, as reported in the canine intestinal microbiome and cattle faeces microbiome studies (Durso et al., 2011). Phylogenetic potentials of buffalo rumen indicate that the phylum Bacteroidetes was predominant, followed by Firmicutes, Proteobacteria, Actinobacteria and Fibrobacteres in all the diets Table 9
Percentage values calculated using minimum cut off value of 60% based on the reads corresponding to each subcategory of Fatty acids, lipids and Isoprenoids at the Subsystem Level 2 for the solid samples.
Subsystems M1GS M2GS M3GS M1DS M2DS M3DS
Fatty acids 43.61 47.49 47.11 45.21 46.45 48.19
Isoprenoids 25.13 25.80 23.98 24.91 26.31 23.55
Phospholipids 23.78 20.91 20.93 23.03 21.33 20.92
Polyhydroxybutyrate metabolism 6.62 5.46 7.49 6.21 5.53 6.80
Triacylglycerols 0.86 0.34 0.49 0.64 0.38 0.54
Table 10
Output of the One-way ANOSIM carried out using PAST tool to check the statistically significant difference for the SEED Subsystem Level 2 categories of Cell Wall and Capsule for liquid samples. (Values in bold denote significant difference between the respective groups).
Sample ID M1GL M1DL M2GL M2DL M3GL M3DL
M1GL 0.00 0.23 0.12 0.06 0.11 0.03
M1DL 0.23 0.00 0.11 0.14 0.03 0.03
M2GL 0.12 0.11 0.00 0.29 0.03 0.03
M2DL 0.06 0.14 0.29 0.00 0.03 0.03
M3GL 0.11 0.03 0.03 0.03 0.00 0.43
M3DL 0.03 0.03 0.03 0.03 0.43 0.00
Table 11
Output of the One-way ANOSIM carried out using PAST tool to check the statistically significant difference for the SEED Subsystem Level 2 categories of Cell Wall and Capsule for solid samples. (Values in bold denote significant difference between the respective groups).
Sample ID M1GS M1DS M2GS M2DS M3GS M3DS
M1GS 0.00 0.09 0.23 0.88 0.26 0.68
M1DS 0.09 0.00 0.03 0.03 0.03 0.06
M2GS 0.23 0.03 0.00 0.20 0.92 0.65
M2DS 0.88 0.03 0.20 0.00 0.19 0.28
M3GS 0.26 0.03 0.92 0.19 0.00 0.97
M3DS 0.68 0.06 0.65 0.28 0.97 0.00
Table 12
Output of the One-way ANOSIM carried out using PAST tool to check the statistically significant difference for the SEED Subsystem Level 2 categories of Fatty acids, lipids and Isoprenoids for liquid samples. (Values in bold denote significant difference between the respective groups).
Sample ID M1GL M1DL M2GL M2DL M3GL M3DL
M1GL 0.00 0.20 0.06 0.06 0.03 0.03
M1DL 0.20 0.00 0.09 0.12 0.03 0.03
M2GL 0.06 0.09 0.00 0.22 0.03 0.03
M2DL 0.06 0.12 0.22 0.00 0.03 0.03
M3GL 0.03 0.03 0.03 0.03 0.00 0.17
(Fig. 4A and B). Similar observation has also been reported byBruce et al. (2008)in cattle rumen andSingh et al. (2012)in buffalo rumen metagenome.
The greatest proportion of gene fragments assigned to known functions was associated with Clustering-based subsystems, carbohydrate and protein metabolisms in similar proportion in all the samples (Tables 2 and 3). The genes belonging to the group of“clustering based subsystems” are frequently found together in multiple organisms for which specific functions are not yet known (Durso et al., 2011). Interestingly, as observed in theFig. 3A and B, the proportion of genes assigned to the SEED Subsystem Level 2 subcategory of spore core dehydration decreases along the treatments, therefore it could be inferred that during the initial treatment of 50% green and dry roughage, the spores formed were dormant yet with low core water content, no high-energy compounds, and resistant to heat, freezing, irradiation, chemicals, pressure, and desiccation. This ensures long term survival without nutrients. But with the increase in the treatment from 50% roughage to 100% roughage, the core hydration takes place which could be considered ideal for spore maturation and germination. The peptidoglycan (PG) cortex of bacterial endospores is required for the maintenance of spore core dehydration, heat resistance and dormancy (Stephenson and Hoch, 2002; Leggett et al., 2012). Sporulation has been most extensively Table 13
Output of the One-way ANOSIM carried out using PAST tool to check the statistically significant difference for the SEED Subsystem Level 2 categories of Fatty acids, lipids and Isoprenoids for solid samples. (Values in bold denote significant difference between the respective groups).
Sample ID M1GS M1DS M2GS M2DS M3GS M3DS
M1GS 0.00 0.28 0.18 0.69 0.23 0.37
M1DS 0.28 0.00 0.03 0.08 0.03 0.14
M2GS 0.18 0.03 0.00 0.23 0.85 0.34
M2DS 0.69 0.08 0.23 0.00 0.14 0.26
M3GS 0.23 0.03 0.85 0.14 0.00 0.66
M3DS 0.37 0.14 0.34 0.26 0.66 0.00
Table 14
Output of the One-way ANOSIM carried out using PAST tool to check the statistically significant difference for the SEED Subsystem Level 2 categories of Dormancy and Sporulation for liquid samples. (Values in bold denote significant difference between the respective groups).
Sample ID M1GL M1DL M2GL M2DL M3GL M3DL
M1GL 0.00 0.20 0.03 0.03 0.03 0.03
M1DL 0.20 0.00 0.03 0.03 0.03 0.03
M2GL 0.03 0.03 0.00 0.14 0.03 0.03
M2DL 0.03 0.03 0.14 0.00 0.03 0.03
M3GL 0.03 0.03 0.03 0.03 0.00 0.03
M3DL 0.03 0.03 0.03 0.03 0.03 0.00
Table 15
Output of the One-way ANOSIM carried out using PAST tool to check the statistically significant difference for the SEED Subsystem Level 2 categories of Dormancy and Sporulation for solid samples. (Values in bold denote significant difference between the respective groups).
Sample ID M1GS M1DS M2GS M2DS M3GS M3DS
M1GS 0.00 0.26 0.03 0.03 0.03 0.03
M1DS 0.26 0.00 0.03 0.03 0.03 0.03
M2GS 0.03 0.03 0.00 0.65 0.60 0.38
M2DS 0.03 0.03 0.65 0.00 0.49 0.17
M3GS 0.03 0.03 0.60 0.49 0.00 0.70
M3DS 0.03 0.03 0.38 0.17 0.70 0.00
Fig. 5.(A) The graphical representation of the percentage values calculated for the liquid rumen sample and (B) the graphical representation of the percentage values calculated for the solid rumen sample from the output of the Gene Ontology Analysis using GO Slim with respect to the GO Slim term‘Sporulation.’
265
Singh
et
al.
/
Meta
Gene
2
(2014)
252
–
studied in the model organismBacillus subtilis. Entry into sporulation is governed by the master regulator Spo0A, which is activated by phosphorylation through a multicomponent signal transduction pathway (Gérard et al., 2007) Phosphorylated Spo0A directly regulates (activates or represses) the expression of many genes (Romero-Pérez et al., 2011).
The proportion of functional genes belonging to the subcategory of spore germination increases from the 50% to the 75% roughage treatments considering with respect to the decrease in the values of spore core dehydration. Therefore it is evident that germination of spores takes place across the treatments with the higher proportion of germination occurring in the case of 75% roughage treatment stating that 75% roughage and 25% concentrate ratio is an ideal condition for the germination of the spore.
The results of the sequence alignment using BLAT revealed that the most frequently observed taxa were that of Clostridia and Bacilli which belong to the phylum Firmicutes. In the case of solid sample, Firmicutes and Bacteroidetes complement each other in terms of their concentrations all along the green and dry solid samples (Fig. 4A and B). It has also been reported that Firmicutes phylum mainly consist of Gram positive bacteria (Leggett et al., 2012) and these endospore-forming bacteria belong to theBacillusandClostridium genera. Endospore formation is unique to the low-G–C group of Gram-positive bacteria (Firmicutes). For the most part, it is restricted to the family Bacillaceae and the class Clostridia, but members of the less studied family Veillonellaceae (Sahu et al., 2004; Moto, 2008) also produce endospores.
It could be observed fromFig. 3A and B that the proportion of functional genes associated with sporulation cluster and sporulation gene orphans increased along the treatments both for the green and dry solid and the liquid samples which clearly indicated that sporulation is increasing from 50% roughage to 100% roughage treatments. But as the treatment increased from 75% roughage to 100% roughage sporulation increases leading to unfavourable conditions for the germination of these spores. As reported in literature dormant spores of a number ofBacillusspecies have no detectable biosynthetic or metabolic activity and contain low levels of AT (Brooks and Church, 1957; Warth and Strominger, 1969; KANmdsg., 1970; Setlow., 1970). The lack of enzyme action on endogenous substrates for germination has included low water content and low levels of free metal ions within the dormant spore (Gould and Hurst, 1969; Singh, 1979). A large increase in spore internal water content upon germination has been suggested by other workers on the basis of several types of measurements (Gould and Hurst, 1969; Singh, 1979).Lamont et al. (2011)have identified and described a new spore-like morphotype inMycobacterium avium Subsp. Paratuberculosis (PAP)associated with nutrient starvation. The Gene Ontology analysis using GO Slim also showed a clear variation across treatments in the function of the genes associated with sporulation (Fig. 5A and B), with the highest hits corresponding to the 100% roughage treatment both in the case of green and dry (Solid; Liquid) samples while 75% roughage treatment showed lowest hits with respect to the gene functions associated with sporulation. Metagenomic studies have reported the occurrence of dormancy and sporulation genes in water metagenome (Gomez-Alvarez et al., 2012) and in hydrocarbon-impacted site sample (Smith et al., 2013) by using massive parallel sequencing.
Seed subsystem composition of Cell wall and Capsule of buffalo rumen microbiome indicates the predominance of capsular and extracellular polysaccharides (37.43–40.68%), Gram-Negative cell wall components (13.86–15.45%) and Peptidoglycan Biosynthesis (19.53–20.90%) (Tables 6 and 7). Our results show the presence of Cell wall and Capsule encoding genes in buffalo rumen, reflecting the directional flexibility of structure cell wall in rumen bacteria. High representation of the “cell wall and capsule” subsystem has been reported in bovine rumen (Kav et al., 2012), Yak rumen (Dai et al., 2012) and loris faecal metagenome (Xu et al., 2013).
5. Conclusion
25% concentrate ratio thereby suggesting that it may be an ideal stress-free environment for the microbes residing in the rumen.
Acknowledgement
This work was supported by the Niche Area of Excellence Project funded by the Indian Council of Agricultural Research, New Delhi.
Appendix A. Supplementary data
Supplementary data to this article can be found online athttp://dx.doi.org/10.1016/j.mgene.2014.01.005.
References
Brooks, D., Church, H.H., 1957.Intermediate metabolism of aerobic spores. I. Activation of glucose oxidation in spores ofBacillus cereusvarterminalis. J Bacteriol 73 (4), 470–476.
Bhupender, Singh, J.G., Islam, Nurul M., Santanu, D., Leif, A. Kirsebom, 2010.Growth, cell division and sporulation in mycobacteria. Antonie van Leeuwenhoek 98, 165–177.
Brady, R., C.J., Goodman, R.M., 1998.Molecular biological access to the chemistry of unknown soil microbes. Chem. Biol 5, 245–249.
Bruce, D.C., Richardson, P.M., Lidstrom, M.E., Chistoserdova, L., 2008.High-resolution metagenomics targets specific functional types in complex microbial communities. Nat Biotechnol 26 (9), 1029–1034 (Sep).
Cano, R.J., M.K.B., 2012.Revival and identification of bacterial spores in 25- to 40-million-year-old Dominican amber. Science 1060–1064.
Clarke, K.R., 1993.Non-parametric multivariate analyses of changes in community structure. Aust. J. Ecol 117–143.
Dai, X., Zhu, Y., Luo, Y., Song, L., Liu, D., et al., 2012.Metagenomic insights into thefibrolytic microbiome in yak rumen. PLoS ONE 7 (7), e40430.
Durso, L.M., Harhay, G.P., Bono, J.L., Smith, T.P., 2011.Virulence-associated and antibiotic resistance genes of microbial populations in cattle feces analyzed using a metagenomic approach. Methods J. Microbiol 84, 278–282.
Fonty, G., Gouet, P., Jouany, J.P., Senaud, J., 1987.Establishment of the microflora and anaerobic fungi in the rumen of lambs. J. Gen. Microbiol. 133, 1835–1843.
Gérard, F., Keith, J., Michel, C., Remy, R., Graham Naylor, F., 2007.Establishment and development of ruminal hydrogenotrophs in methanogen-free lambs. Appl Environ Microbiol October 73 (20), 6391–6403.
Gould, G., Hurst, A.W., 1969.The Bacterial Spore. Academic, Academic, New York 397–444.
Gomez-Alvarez, Vicente, Revetta, R.P., Santo Domingo, Jorge W., 2012.Metagenomic analyses of drinking water receiving different disinfection treatments. Appl Environ Microbiol. 78 (17), 6095–6102.
Hespell, R.B., O'Bryan, P.J., Moniruzzaman, M., Bothast, R.J., 1997.Hydrolysis by commercial enzyme mixtures of AFEX-treated corn
fiber and isolated xylans. Applied Biochemistry and Biotechnology 62 (1), 87–97.
Hess, M., S.E.R., Kim, T.-W., Chokhawala, H., Schroth, G., Luo, S., Clark, D.S., Chen, F.Z.T., 2011.Metagenomic discovery of biomass-degrading genes and genomes from cow rumen. Science 331, 463–467.
Huse, S.M., 2007.Accuracy and quality of massively parallel DNA pyrosequencing. Genome biology 8 (7), R143.
KANmdsg, S.P., 1970.Biochemical studies of bacterial sporulation and germination. J Biol Chem 25 (245(14)), 3645–3652.
Kav, A.B., Goor, S., Elie, Jami, 2012.Insights into the bovine rumen plasmidome. Proc Natl Acad Sci U S A 109 (14), 5452–5457 (April 3).
Lamont, E.A., Bannantine, J.P., Armién, A., Ariyakumar, D.S., Sreevatsan, S., 2012. Identification and characterization of a spore-like morphotype in chronically starvedMycobacterium aviumSubsp.ParatuberculosisCultures. PLoS ONE 7 (1), e30648.http:// dx.doi.org/10.1371/journal.pone.0030648.
Leggett, M.J., McDonnell, G., Denyer, S.P., Setlow, P., Maillard, J.Y., 2012.Bacterial spore structures and their protective role in biocide resistance. Journal of Applied Microbiology 485–98.
Moto, Mitsumori, 2008.Control of rumen microbial fermentation for mitigating methane emissions from the rumen. Asian-Aust. J. Anim. Sci 1, 144–154.
Romero-Pérez, G.A., Ominski, K.H., McAllister, T.A., Krause, D.O., 2011.Effect of environmental factors and influence of rumen and hindgut biogeography on bacterial communities in steers. Appl. Environ. Microbiol. 77 (1), 258–268.
Rondon, M.R., P.R.A., A.D.B., Brady, S., et al., 2000.Cloning the soil metagenome: a strategy for accessing the genetic and functional diversity of uncultured microorganisms. Appl. Environ. Microbiol 66, 2541–2547.
Sahu, N.P., K.D.N., Paul, S.S., 2004.Effect of cellulose degrading bacteria isolated from wild and domestic ruminants on in vitro digestibility of feed and enzyme production. Asian Aust. J. Anim. Sci 17, 199–202.
Setlow, P., 1970. Biochemical studies on bacterial sporulation and germination. XXIII. Nucleotide metabolism during spore germination. J. Biol.Chem 245 (3645–3652), 25.
Singh, K.M., Jakhesara, S.J., Koringa, P.G., Rank, D.N., Joshi, C.G., 2012. Metagenomic analysis of virulence-associated and antibiotic resistance genes of microbes in rumen of Indian buffalo (Bubalus bubalis). Gene 507 (2), 146–151.http://dx.doi.org/10.1016/ j.gene.2012.07.037(Oct 10, Epub 2012 Jul 28).
Singh, R.P., 1979.Purification and properties of phosphoglycerate phosphomutase from spores and cells ofBacillus megaterium. J Bacteriol 137 (2), 1024–1027.
Tyson, G.W., Chapman, J., Hugenholtz, P., Allen, E.E., Ram, R.J., Richardson, P.M., et al., 2004.Community structure and metabolism through reconstruction of microbial genomes from the environment. Nature 428 (6978), 37–43.
Warth, A.D., Strominger, J.L., 1969.Structure of the peptidoglycan of bacterial spores: occurrence of the lactam of muramic acid. Proc. Natl. Acad. Sci. USA 64, 528–535.
Woese, C.R., J.C.V., Halvorson, H.0., 1968.A kinetic model for bacterial spore germination. Nat. Acad. Sci. U.S.A. 59, 869–875.
Xu, Bo., Weijiang, Xu., Fuya, Yang., Junjun, Li., et al., 2013. Metagenomic analysis of the pygmy Loris Fecal microbiome reveals unique functional capacity related to metabolism of aromatic compounds. PLoS ONE 8 (2), e56565. http://dx.doi.org/10.1371/ journal.pone.0056565.