FINAL REPORT
VOLUME 2
TECHNICAL REPORTS
Table of Contents
RENEWABLE ENERGY SITING PARTNERSHIP
V
OLUMEII.
T
ECHNICALR
EPORTSTable of Contents
1. THE STRUCTURE OF RENEWABLE ENERGY FINANCING IN RHODE ISLAND
AN OVERVIEW OF 2011ENACTMENTS ... 1
Ken Payne
2. SITING OF WIND ENERGY FACILITIES IN RHODE ISLAND ... 11 Annette Grilli, Malcolm Spaulding, Chris Damon, and Christopher O’Reilly
3. WIND RESOURCE ASSESSMENT AND SITING FOR WIND ENERGY FACILITIES IN RHODE ISLAND ... 41
Annette Grilli, Malcolm Spaulding, Christopher Damon, Christopher O’Reilly, and Gopu Potty
4. WIND RESOURCE ASSESSMENT ... 99
John Merrill and Kelly Knorr
5. THE EFFECTS OF TERRESTRIAL WIND FARMS ON BIRDS AND BATS--LITERATURE REVIEW FOR RHODE ISLAND’S RENEWABLE ENERGY SITING PARTNERSHIP PROJECT ... 115
Peter Paton, Sarah Butler, and Corrie Heinz
6. ACOUSTIC EFFECTS OF WIND FARMS... 443
Gopu R Potty and James H. Miller
7. WIND TURBINE SHADOW FLICKER AND SIGNAL INTERFERENCE EFFECTS ... 483
Gopu R Potty and James H. Miller
8. RHODE ISLAND LANDFILL SOLAR RESOURCE ASSESSMENT AND SCREENING ANALYSIS ... 505
Tom Boving, Pamela Cady, Danny Musher, Tiffany Davis, and Christopher Damon
9. RHODE ISLAND HYDROPOWER RESOURCE ASSESSMENT ... 537 Edson Okwelum, Danny Musher, Tiffany Davis, and Christopher Damon
10.ASSESSING FINANCIAL FEASIBILITY AND ECONOMIC IMPACTS OF RENEWABLE ENERGY
PROJECTS ... 565
James J. Opaluch
Technical Report #1
RESP TECHNICAL REPORT #1
T
HES
TRUCTURE OFR
ENEWABLEE
NERGYF
INANCING INR
HODEI
SLANDA
NO
VERVIEW OF2011
E
NACTMENTSBy
Ken Payne
June, 2012
Technical Report #1
In 2011, the RI General Assembly comprehensively amended to laws pertaining to renewable energy financing. The year was a watershed. Now the structure of renewable energy financing in RI can only be described in terms of the 2011 enactments.
The components of the comprehensive suite of enactments are as follows: Net-metering: Public Laws of 2011, Chapters 134 and 147,
Distributed generation-long term contracting: Public Laws of 2011, Chapters 129 and 143,
Interconnection studies and charges: Public Laws of 2011, Chapters 140 and 144, Systems benefit charge: Public Laws of 2011, Chapters 19 and 28,
Renewable Energy Coordinating Board: Public Laws of 2011, Chapter 222.
Net-metering
Until the 2011 enactments, Public Laws of 2011, Chapters 134 and 147, net-metering was
a subsection of Rhode Island’s renewable energy standard law, RIGL Chapter 39-26. This was
awkward. Net-metering had become an increasingly important and complex topic with its own definitions and purposes. The 2011 enactments made net-metering a freestanding chapter of the General Laws, and provided critical definitions:
“Eligible Net Metering System” means a facility generating electricity using an eligible
net metering resource that is reasonably designed and sized to annually produce electricity in an amount that is equal to or less than the renewable self-generator’s usage at the eligible net metering system site measured by the three (3) year average annual consumption of energy over the previous three (3) years at the electric distribution account(s) located at the eligible net metering system site. A projected annual consumption of energy may be used until the actual three (3) year average annual consumption of energy over the previous three (3) years at the electric distribution account(s) located at the eligible net metering system site becomes available for use in determining eligibility of the generating system. The eligible net metering system must be owned by the same entity that is the customer of record on the net metered accounts. Notwithstanding any other provisions of this chapter, any eligible net metering resource: (i) owned by a municipality or multi-municipal collaborative or (ii) owned and operated by a renewable generation developer on behalf of a municipality or multi-municipal collaborative through municipal net metering financing arrangement shall be treated as an eligible net metering system and all municipal accounts designated by the municipality or multi-municipal collaborative for net metering shall be treated as accounts eligible for net metering within an eligible net metering system site.
“Eligible Net Metering System Site” means the site where the eligible net metering
system is located or is part of the same campus or complex of sites contiguous to one another and the site where the eligible net metering system is located or a farm in which the eligible net metering system is located. Except for an eligible net metering system owned by or operated on behalf of a municipality or multi-municipal collaborative through a municipal net metering
Technical Report #1
financing arrangement, the purpose of this definition is to reasonably assure that energy generated by the eligible net metering system is consumed by net metered electric service account(s) that are actually located in the same geographical location as the eligible net metering system. Except for an eligible net metering system owned by or operated on behalf of a municipality or multi-municipal collaborative through a municipal net metering financing arrangement, all of the net metered accounts at the eligible net metering system site must be the accounts of the same customer of record and customers are not permitted to enter into agreements or arrangements to change the name on accounts for the purpose of artificially expanding the eligible net metering system site to contiguous sites in an attempt to avoid this restriction. However, a property owner may change the nature of the metered service at the
accounts at the site to be master metered in the owner’s name, or become the customer of record
for each of the accounts, provided that the owner becoming the customer of record actually owns the property at which the account is located. As long as the net metered accounts meet the requirements set forth in this definition, there is no limit on the number of accounts that may be net metered within the eligible net metering system site.
"Renewable Net Metering Credit" means a credit that applies to an Eligible Net Metering System up to one hundred percent (100%) of the renewable self-generator’s usage at the Eligible Net Metering System Site over the applicable billing period. This credit shall be equal to the total kilowatt hours of electricity generated and consumed on-site during the billing period multiplied by the sum of the distribution company's:
(i) Standard offer service kilowatt hour charge for the rate class applicable to the net metering customer;
(ii) Distribution kilowatt hour charge; (iii) Transmission kilowatt hour charge; and (iv) Transition kilowatt hour charge.
“Excess Renewable Net Metering Credit” means a credit that applies to an eligible net
metering system for that portion of the renewable self-generator’s production of electricity beyond one hundred percent (100%) and no greater than one hundred twenty-five percent (125%) of the renewable self-generator’s own consumption at the eligible net metering system site during the applicable billing period. Such excess renewable net metering credit shall be
equal to the electric distribution company’s avoided cost rate, which is hereby declared to be the
electric distribution company’s standard offer service kilo-watt hour (kWh) charge for the rate
class and time-of-use billing period (if applicable) applicable to the distribution customer account(s) at the eligible net metering system site. Where there are accounts at the eligible net metering system site in different rate classes, the electric distribution company may calculate the excess renewable net metering credit based on the average of the standard offer service rates applicable to those on site accounts. The electric distribution company has the option to use the
Technical Report #1
energy received from such excess generation to serve the standard offer service load. The commission shall have the authority to make determinations as to the applicability of this credit to specific generation facilities to the extent there is any uncertainty or disagreement.
“Municipal net metering financing arrangement” means arrangements entered into by a
municipality or multi-municipal collaborative with a private entity to facilitate the financing and operation of a net metering resource, in which the private entity owns and operates an eligible net metering resource on behalf of a municipality or multi-municipal collaborative, where: (i) The eligible net metering resource is located on property owned or controlled by the municipality or one of the municipalities, as applicable, and (ii) The production from the eligible net metering resource and primary compensation paid by the municipality or multi-municipal collaborative to the private entity for such production is directly tied to the consumption of electricity occurring at the designated net metered accounts.
For ease of administering net metered accounts and stabilizing net metered account bills, the electric distribution company may elect (but is not required) to estimate for any twelve (12) month period:
(i) The production from the eligible net metering system; and
(ii) Aggregate consumption of the net metered accounts at the eligible net metering system site and establish a monthly billing plan that reflects the expected credits that would be applied to the net metered accounts over twelve (12) months. The billing plan would be designed to even out monthly billings over twelve (12) months, regardless of actual production and usage. If such election is made by the electric distribution company, the electric distribution company would reconcile payments and credits under the billing plan to actual production and consumption at the end of the twelve (12) month period and apply any credits or charges to the net metered accounts for any positive or negative difference, as applicable. Should there be a material change in circumstances at the eligible net metering system site or associated accounts during the twelve (12) month period, the estimates and credits may be adjusted by the electric distribution company during the reconciliation period. The electric distribution company also may elect (but is not required) to issue checks to any net metering customer in lieu of billing credits or carry forward credits or charges to the next billing period. For residential eligible net metering systems twenty-five kilowatts (25 kw) or smaller, the electric distribution company, at its option, may administer renewable net metering credits month to month allowing unused credits to carry forward into following billing period.
If the electricity generated by an eligible net metering system during a billing period is
equal to or less than the net metering customer’s usage during the billing period for electric
distribution company customer accounts at the eligible net metering system site, the customer shall receive renewable net metering credits, which shall be applied to offset the net metering
customer’s usage on accounts at the eligible net metering system site.
Technical Report #1
If the electricity generated by an eligible net metering system during a billing period is
greater than the net metering customer’s usage on accounts at the eligible net metering system
site during the billing period, the customer shall be paid by excess renewable net metering credits for the excess electricity generated beyond the net metering customer’s usage at the eligible net metering system site up to an additional twenty-five percent (25%) of the renewable self
generator’s consumption during the billing period; unless the electric distribution company and
net metering customer have agreed to a billing plan.
The amount of net metering was capped at: (1) The maximum allowable capacity for eligible net metering systems, based on nameplate capacity, shall be five megawatts (5 mw), and (2) The aggregate amount of net metering in Rhode Island shall not exceed three percent (3%) of peak load, provided that at least two megawatts (2 mw) are reserved for projects of less than fifty kilowatts (50 kw). The previous limitation on eligible net metering resources to solar and wind projects was eliminated.
The Acts also, within their renewable energy standard sections, separated the definition of eligible renewable energy resources from a requirement that such resources be used to off-set the electricity generation from non-renewable resources.
Distributed Generation-Long Term Contracting
Distributed generation-long term contracting: Public Laws of 2011, Chapters 129 and
143, is a new mechanism under Rhode Island law. The purpose of the law is “to facilitate and
promote installation of grid-connected generation of renewable energy; support and encourage development of distributed renewable energy generation systems; reduce environmental impacts; reduce carbon emissions that contribute to climate change by encouraging the local siting of
renewable energy projects; diversify the state’s energy generation sources; stimulate economic
development; improve distribution system resilience and reliability; and reduce distribution
system costs.”
If the function of the net metering law is to facilitate customers meeting their own electrical power needs from eligible renewable energy resources, the function of the distributed generation-long term contracting law is to facilitate the development of eligible renewable energy resources that provide electricity from eligible renewable energy resources to the grid serving the distribution area that includes Rhode Island.
The amount of generation subject to distributed generation-long term contracting is capped at aggregate amount of at least 40 MegaWatts name plate capacity; and the maximum individual project size is set at 5 MW name plate capacity, larger projects are eligible for enrollment in the long-term contracting provisions of RIGL chapter 39-26.1.
The distributed generation standard contract board [or in the absence of the board, the
OER] “shall set ceiling prices and annual targets for each renewable energy class of distributed
generation for the 2011 program year and make a filing with the commission pursuant to this
Technical Report #1
chapter recommending such prices and targets. Thereafter annually by no later than October 15 of each year, the board shall make filings with the commission to recommend the standard contract ceiling prices and annual targets for each renewable energy class of distributed generation facility. The ceiling price for each technology should be a price that would allow a private owner to invest in a given project at a reasonable rate of return, based on recent reported and forecast information on the cost of capital, and the cost of generation equipment. The calculation of the reasonable rate of return for a project shall include where applicable any state or federal incentives including, but not limited to, tax incentives. In setting the ceiling prices, the board also may consider: (1) Transactions for newly developed renewable energy resources, by technology and size, in the ISO-NE region and the northeast corridor; (2) Pricing for standard contracts received during the previous program year; (3) Environmental benefits, including, but not limited to, reducing carbon emissions, and system benefits; and (4) Cost effectiveness. The board shall in performing this assessment involve representation from its advisory council, if applicable, and from the office of energy resources, the electric distribution company, and the energy efficiency and resources management council. The board shall hold, with at least ten (10)
business days’ notice, a public community review meeting. The board shall issue a report of its
findings from the assessment process recommending standard contract ceiling prices for the
upcoming program year.”
As of 2012, there are to be at least four classes of projects, at least two for solar generation, at least one for wind, and one other.
Eligibility for the ceiling price at the small distributed generation is set at 500 KW solar, and 1.5 MW wind.
The “Standard contract” means a contract with a term of fifteen (15) years at a fixed rate
for the purchase of all capacity, energy, and attributes generated by a distributed generation facility. A contract may have a different term if it is mutually agreed to by the seller and the electric distribution company and it is approved by the commission. The terms of the standard contract for each program year and for each renewable energy class shall be set pursuant to the provisions of this chapter.
The “Standard contract ceiling price” means the standard contract price for the output of
a distributed generation facility which price is approved annually for each renewable energy class pursuant to the procedure established in this chapter, for the purchase of energy, capacity, renewable energy certificates, and all other environmental attributes and market products that are available or may become available from the distributed generation facility.
The standard contracts would be applicable for various technologies for both small and large distributed generation projects. The standard contracts should balance the need for the project to obtain financing against the need for the distribution company to protect itself and its distribution customers against unreasonable risks. The standard contract should be developed
Technical Report #1
from contracting terms typically utilized in the wholesale power industry, taking into account the size of each project and the technology. The standard contracts shall provide for the purchase of energy, capacity renewable energy certificates, and all other environmental attributes and market products that are available or may become available from the distributed generation facility. However, the electric distribution company shall retain the right to separate out pricing for each market product under the contracts for administrative and accounting purposes to avoid any detrimental accounting effects or for administrative convenience, provided that such accounting as specified in the contract does not affect the price and financial benefits to the seller as a seller of a bundled product. The standard contract also shall:
(i) Hold the distributed generation facility owner liable for the cost of interconnection from the distributed generation facility to the interconnect point with the distribution system, and for any upgrades to the existing distributed generation system that may be required by the electric distribution company. However, a distributed generation facility owner may appeal to the commission to reduce any required system upgrade costs to the extent such upgrades can be shown to benefit other customers of the electric distribution company and the balance of such costs shall be included in rates by the electric distribution company for recovery in the year incurred or the year following incurrence; (ii) Require the distributed generation facility owner to make a performance guarantee deposit to the electric distribution company of fifteen dollars ($15.00) for small distributed generation projects or twenty-five dollars ($25.00) for large distributed generation projects for every renewable energy certificate estimated to be generated per year under the contract, but at least five hundred dollars ($500) and not more than seventy-five thousand dollars ($75,000), paid at the time of contract execution;
(iii) Require the electric distribution company to refund the performance guarantee deposit on a pro-rated basis of renewable energy credits actually delivered by the
distributed generation facility over the course of the first year of the project’s operation,
paid quarterly;
(iv) Provide that if the distributed generation facility has not generated the output proposed in its enrollment application within eighteen (18) months after execution of the contract, the contract is automatically voided and the performance guarantee is forfeited. Any forfeited performance guarantee deposits shall be credited to all distribution customers in rates and not retained by the electric distribution company;
(v) Provide for flexible payment schedules that may be negotiated between the buyer and seller, but shall be no longer than quarterly if an agreement cannot be reached;
(vi) Require that an electric meter which conforms with standard industry norms be installed to measure the electrical energy output of the distributed generation facility, and require a system or procedure by which the distributed generation facility owner shall demonstrate creation of renewable energy credits, in a manner recognized and accounted for by the GIS; such demonstration of renewable energy credit creation to be at the
distributed generation facility owner’s expense. The electric distribution company may, at
Technical Report #1
its discretion, offer to provide such a renewable energy credit measurement and accounting system or procedure to the distributed generation facility owner, and the distributed generation facility owner may, at its discretion, use the electric distribution
company’s program, or use that of an independent third party, approved by the
commission, and the costs of such measurement and accounting are paid for by the distributed generation facility owner.
After 2011, there are three enrollments periods annually through 2014.
Interconnection
Theinterconnection law setting standard timetables and fee schedules for interconnection studies and charges, Public Laws of 2011, Chapters 140 and 144 was the result of frustration with an interconnection process that was unpredictable and frequently time consuming and expensive.
The General Assembly found “expeditious completion of the application process for
renewable distributed generation is in the public interest. For this reason, certain standards and other provisions for the processing of applications are hereby set forth to assure that the application process assists in the development of renewable generation resources in a timely
manner.”
Standard fee schedules and schedules are statutorily set for higher level “feasibility
studies” and more detailed “impact studies.” This is done by the size of the project:
(1) Residential applicants for interconnections of distributed generation that is twenty-five kilowatts (25 kw) or less,
(2) Residential applicants for interconnections of distributed generation that is greater than twenty-five kilowatts (25 kw),
(3) Non-residential applicants for interconnections of distributed generation that is one hundred kilowatts (100 kw) or less,
(4) Non-residential applicants for interconnections distributed generation that is two hundred fifty kilowatts (250 kw) or less,
(5) Non-residential applicants for interconnections of renewable distributed generation that is greater than two hundred fifty kilowatts (250 kw), and
(6) Non-residential applicants for interconnections of renewable distributed generation greater than one megawatt.
Demand Side Management Fee
The demand side management fee, a systems benefit charge of .3 mills per kilowatt hour-hour delivered was continued by Public Laws of 2011, Chapters 19 and 28, through 2018; the fee currently generates about $2 million annually and supports the Renewable Energy Fund at the Economic Development Corporation.
Technical Report #1
The Renewable Energy Coordinating Board
Recognizing that there was a need for on-going strategy and coordination of the State’s effort to obtain the benefits of renewable energy development, the General Assembly created the Renewable Energy Coordinating Board, Public Laws of 2011, Chapter 222.
The board has five (5) members: (1) The director of the department of administration, who shall serve as chairperson of the board; (2) The commissioner of the office of energy resources; (3) The executive director of the economic development corporation; (4) The director of the department of environmental management; and (5) The director of the coastal resources management council.
There is also an advisory council with (15) members. Each board member shall select three (3) advisory council members, provided that the advisory council includes members with experience in the following areas: (1) Renewable energy development; (2) Energy regulation and law; (3) Environmental issues pertaining to renewable energy; (4) Business association or chamber of commerce; (5) Green trades; (6) Residential energy consumers; (7) Low-income energy consumers; (8) Small business relating to renewable energy; and (9) Commercial/industrial energy consumers.
On or before November 15, 2011, the board shall adopt the strategic plan. The board may amend the strategic plan as necessary; and on March 15 and September 15 of each year, commencing in 2012, the board shall issue the strategic plan biannual report, which shall be made available to the public and transmitted to the governor; the senate president; the speaker of the house; and state agencies.
Technical Report #2
RESP TECHNICAL REPORT #2
S
ITING OFW
INDE
NERGYF
ACILITIES INR
HODEI
SLANDBy
Annette Grilli, Malcolm Spaulding, Chris Damon, and Christopher O’Reilly
University of Rhode Island,
Narragansett Bay Campus
June, 2012
Technical Report #2
Table of Contents
List of Figures ... 13
List of Tables ... 13
Abstract ... 14
1.INTRODUCTION... 15
2.MULTI-STEP SCREENING ANALYSIS ... 15
3.RESULTS ... 33
4.SUMMARY ... 37
5.REFERENCES ... 39
Technical Report #2
List of Figures
Figure 1. Renewable Energy Siting Plan (RESP) study area with USGS topography as the
background. ... 16
Figure 2. Predicted annual average wind speeds at 30 m elevation from AWS TrueWind. ... 17
Figure 3. Predicted annual average wind speeds at 50 m elevation from AWS TrueWind. ... 18
Figure 4. Predicted annual average wind speeds at 80 m elevation from AWS TrueWind. ... 19
Figure 5. Land-cover for RI from RIGIS -3/04 data base. Cover type is noted in the legend. ... 20
Figure 6. Surface roughness (zo) based on land cover (Figure 5). ... 20
Figure 7. Annual mean wind speed at 80 m (a), showing areas with winds greater than (b) 6 m/sec, (c) 6.5 m/sec, and (d) 7 m/sec. ... 21
Figure 8. FAA restricted areas around airports (setbacks based on runway lengths). ... 25
Figure 9. Population densities, in standard deviations above and below the mean, from the 2010 Census. ... 26
Figure 10. Wetlands, with 15.2 m (50ft) buffer. ... 26
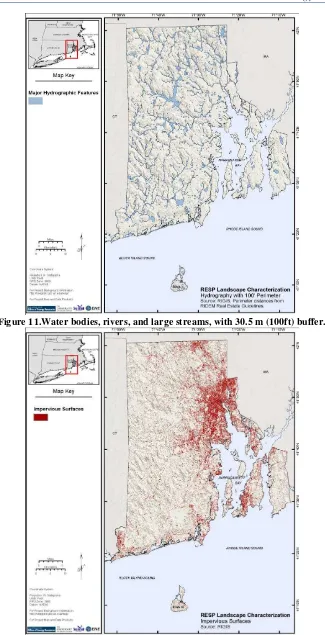
Figure 11.Water bodies, rivers, and large streams, with 30.5 m (100ft) buffer. ... 27
Figure 12. Impervious surfaces (highways, highly developed areas, parking lots, etc.). ... 27
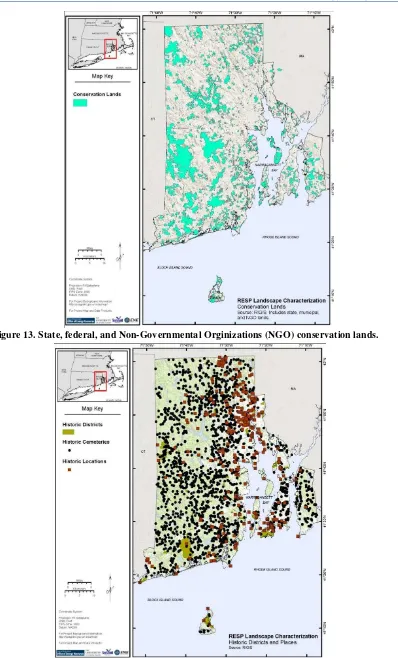
Figure 13. State, federal, and Non-Governmental Orginizations (NGO) conservation lands. ... 28
Figure 14. Historic districts, locations, and cemeteries (point locations). ... 28
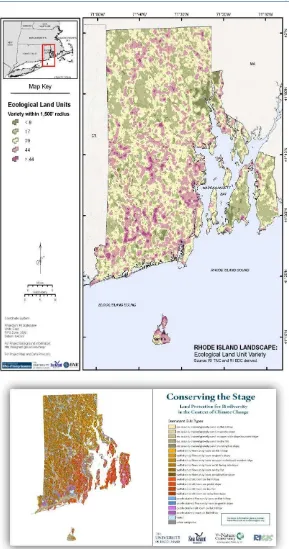
Figure 15. Number of Ecological Land Units (ELUs) - habitat diversity- within a 460 m (1500 ft) radius of the center point of a grid with 30 m by 30 m resolution (a, upper panel) and dominant ecological units for the state (b, lower panel) . ... 29
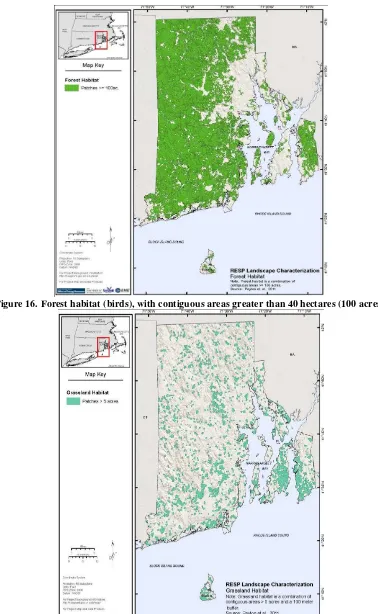
Figure 16. Forest habitat (birds), with contiguous areas greater than 40 hectares (100 acres). ... 30
Figure 17. Grassland habitats (birds), with contiguous areas greater than 2 hectares (5 acres) and 100 m buffer. ... 30
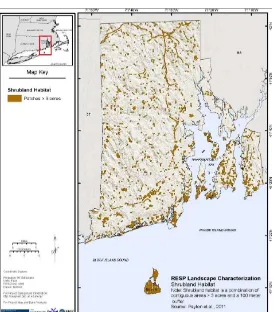
Figure 18. Shrubland habitats (birds), with contiguous areas greater than 1.2 hectares (3 acres) and 100 m buffer. ... 31
Figure 19. Threatened and endanger bird locations, with setbacks dependent on species noted in legend. ... 31
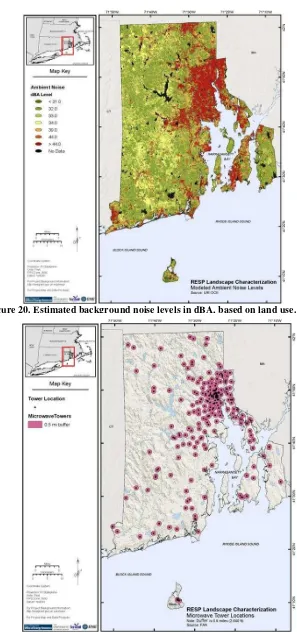
Figure 20. Estimated background noise levels in dBA, based on land use. ... 32
Figure 21.Communication (microwave) towers with 765m (0.5 mile) setback. ... 32
Figure 22. Number of constraints and weighted constraints for wind energy siting. ... 34
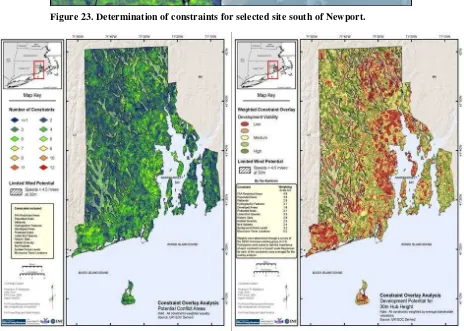
Figure 23. Determination of constraints for selected site south of Newport. ... 35
Figure 24. Number of constraints and weighted constraints with 4.5 m/sec (30 m) overlay. ... 35
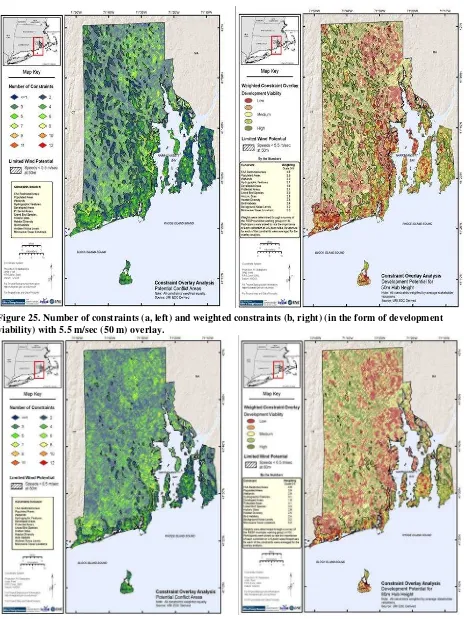
Figure 25. Number of constraints and weighted constraints with 5.5 m/sec (50 m) overlay. ... 36
Figure 26. Number of constraints and weighted constraints with 6.5 m/sec (80 m) overlay. ... 36
Figure 27. Number of constraints with 4.5 (a, left); 5.5 (b, center); and 6.5 (c, right) m/sec wind speed cutoffs overlaid. ... 37
List of Tables Table 1. Potential constraints for wind facility siting. ... 22
Table 2. Potential Constraints for Wind Facility Siting listed in Table 1 with Municipal Working Group Scores. ... 34
Technical Report #2
Abstract
To facilitate selection of sites for wind energy facilities (100 kW to several MWs) in Rhode Island a multi-step screening process was developed and implemented on a high resolution grid (30 m by 30 m) covering the state. The goal of the effort was to develop a simple, user friendly method to help guide site selection and as the initial step in site evaluation. The first step in the analysis was to characterize the wind resources at elevations of 30, 50, and 80 m, corresponding to wind turbine sizes of approximately 100 kW, 250-500 kW, and 1.5 MW or larger, respectively using a validated meteorological model that provided mean annual wind speeds. The model was validated with available wind observations. Wind speed thresholds (economic viability) were selected and areas removed from further consideration if the wind speeds fell below 4.5 (30 m), 5.5 (50 m), and 6.5 (80 m) m/sec. A series of potential constraints to facility siting were identified and put in the form of spatial distribution maps. The constraints included: FAA restricted areas around airports, population density, wetlands, water bodies, rivers and large streams, impervious surfaces, State/federal/ NGO protected areas, historic sites and cemeteries, habitat diversity, bird habitats, threatened and endangered bird species, background noise level and communications towers. Whether all or some of these variables are constraints is dependent on the municipality wind energy siting guidelines. Many may also be amenable to some type of mitigation. An analysis was performed to determine the number of potential constraints for each grid, assuming each had equal value. A second analysis was performed where the constraints were weighted by level of importance scores provided by representatives of RI municipalities interested in wind energy development, with scoring ranging from little to very important. The number of constraints, at a given location, was summarized on a grid and the municipal weighted scores were similarly presented in the form of a development viability index, ranging from low to high. Finally the wind thresholds for the three elevations were overlaid on the constraint score and development viability index maps. A review of the maps provides a rapid method to assess the viability of siting throughout the state. The approach allows the user to investigate the potential constraints at any particular site and to identify these early in the siting process. The study found that the viability of siting wind facilities is strongly dependent on turbine size with a decreasing number of viable areas with increasing wind power output. For smaller turbines siting is viable in inland areas while for larger turbines only sites that are close to the ocean have significant potential. The combined maps indicate that siting is highly site specific and each potential site may have one or more constraints that will need to be addressed. The maps also suggest that siting of large scale facilities in RI is likely to be restricted to individual or several turbines and not wind farms.
Technical Report #2
1.
I
NTRODUCTIONTo facilitate the siting of wind energy facilities in Rhode Island, a multi-step screening analysis to assess the suitability of sites was developed, implemented, and presented in this report. Grilli et al (2012), in a companion report, provide an assessment of the wind resources in the state, including a detailed comparison of meteorological model based estimates to observations, the overarching framework for energy facility siting, a summary of the analysis presented here, and recommendations for setbacks from facilities for blade failure/ice and blade throw, acoustic noise, and shadow flicker.
2.
M
ULTI-S
TEPS
CREENINGA
NALYSISTo set the stage Figure 1 shows the RI study area, with associated topography. The map also shows the location of meteorological observation towers and existing wind turbines that have been previously sited. The analysis begins with the characterization of wind resources at selected elevations. Elevations of 30, 50 and 80 m were selected for analysis since they are consistent with commercial scale developments for turbines with power production ranging from 100 kW (30 m), 500 kW (50 m) to 1.5 MW (80 m ) and greater. The wind data used in this analysis was obtained from AWS True Winds and generated using their MesoMap meteorological modeling system. The modeling study area included the southern New England states (Rhode Island, Massachusetts, and Connecticut) and adjacent coastal waters. The data were provided on a 200 m by 200 m resolution grid. AWS validated the model predictions by comparison to 33 stations located in southern New England. The maps show the annual average wind speeds at each elevation. Details on the modeling approach, application and validation are provided in Brower (2007). Figures 2, 3, and 4 show the annual mean wind speed contours for elevations of 30, 50, and 80 m, respectively. It has been assumed that commercially viable development will require wind speeds greater than 4.5, 5.5, and 6.5 m/sec for 30, 50, and 80 m elevation winds, respectively. These wind speed thresholds for development will clearly restrict the areas suitable for wind energy development in the state.
The pattern of the mean wind speeds is dominated by the topography (Figure 1), the land cover (Figure 5) and roughness (Figure 6). In general higher wind speeds are observed at higher elevations. Areas, with forest land cover, have a larger roughness than urban areas with significant cleared areas (Figure 6). Both topographic relief and land cover (roughness) are used
as input to AWS’s MesoMap model and hence reflected in their model estimates.
Technical Report #2
Figure 1. Renewable Energy Siting Plan (RESP) study area with USGS topography as the background. The locations of existing meteorological observation stations from NOAA/ NWS, Weather-Flow (a private firm), and other sources are provided. Locations of existing wind turbines are also provided.
Technical Report #2
Figure 2. Predicted annual average wind speeds at 30 m elevation from AWS TrueWind.
Technical Report #2
Figure 3. Predicted annual average wind speeds at 50 m elevation from AWS TrueWind.
Technical Report #2
Figure 4. Predicted annual average wind speeds at 80 m elevation from AWS TrueWind.
Technical Report #2
Figure 6. Surface roughness (zo) based on land cover (Figure 5).
Figure 5. Land-cover for RI from RIGIS -3/04 data base. Cover type is noted in the legend.
Technical Report #2
Figure 7. (a) Upper left, (b) upper right, (c) lower left, and (d) lower right. Annual mean wind speed at 80 m (a), showing areas with winds greater than (b) 6 m/sec, (c) 6.5 m/sec, and (d) 7 m/sec.
Technical Report #2
To illustrate the impact of assuming various wind energy thresholds on siting of wind energy facilities, Figure 7 shows contours of mean wind speed at 80 m assuming thresholds of (a)6 m/sec, (b) 6.5 m/sec and (c) 7 m/sec, respectively. Areas in grey are eliminated since the mean wind speed is below the threshold. Seven (7) m/sec is often used to represent the threshold of economic viability for wind turbines with hub heights of 80 m.
As the threshold value is increased the area suitable for development is dramatically reduced, with the highest elevations in the interior of the state and a narrow margin along the coast and Narragansett Bay being the only viable sites. If a 7 m/sec threshold is assumed only a very narrow band along the southern RI shoreline and southeast portion of the east bay communities is viable.
The next step in the process was to determine any potential constraints to the siting of wind facilities. Ideally this would be done in terms of hard constraints, indicating things that would absolutely preclude development, and other constraints that might indicate a concern but not necessarily a barrier to development. Initial application of variables that might be considered hard constraints showed that there were very few sites suitable for development. Discussion of the constraints with municipal officials from towns interested in wind energy development indicated that they had considerably varying views on the importance of various constraints.
Given this observation a total of fourteen maps were developed and implemented in GIS format, providing geospatial representations of potential constraints to siting. The constraint layers are summarized in Table 1 and GIS layers are provided in Figures 8 through 20. Detailed information on the source of the data for each constraint and any information on the processing that was used to generate the GIS layers is provided in the figure legends. The maps have various resolutions depending on the data source and methods used for processing. The goal was to have a nominal resolution of 30 m x 30 m covering the entire state.
Table 1. Potential constraints for wind facility siting.
Potential Constraints for Wind Facility Siting
FAA restricted areas around airports (setbacks based on runway lengths)
Population densities (greater than individuals per km2)
Wetlands (with buffers)
Water bodies, rivers and large streams (with buffers) Impervious surfaces (highways, highly developed State, federal, and NGO protected areas
Historic sites and cemeteries (point locations)
Ecological Land Units (ELUs) - habitat diversity- number of ELUs per 30 m grid Habitats (birds) (forests, grasslands, and shrubs) (with buffers)
Threatened and endangered bird species ( with buffers) Background noise level (land use, highways)
Communication towers
Technical Report #2
The rationale for selecting the various constraints listed in Table 1 is broadly summarized below.
FAA restricted areas around airports (setbacks based on runway lengths)(Figure 8)
Siting of wind turbines requires a case by case determination by the FAA as to site location given turbine characteristics. The map provides some guidance on the areas that are not likely to be acceptable.
Population densities (greater than individuals per km2) (Figure 9)
Population density maps show the distribution of individuals in the state based on 2010 Census data. Areas with high population density are not likely to be suitable for development given proximity of turbines to individuals and the setback requirements normally implemented in facility siting.
Wetlands (with buffers) (Figure 10)
Development in wetlands and associated buffers is normally prohibited by either the RI Department of Environmental Management (RI DEM) or the RI Coastal Resources Management Council(RI CRMC). Permitting challenges are likely to be very significant.
Water bodies, rivers and large streams (with buffers) (Figure 11)
Development in water bodies, rivers, and streams and associated buffers is normally prohibited by either the RI Department of Environmental Management (RI DEM) or the RI Coastal Resources Management Council (RI CRMC). Permitting challenges are likely to be very significant.
Impervious surfaces (highways, highly developed areas, etc) (Figure 12)
Development in areas with impervious surfaces may or may not be considered for development. It is likely that areas with extensive buildings and road and highway networks will not be suitable for development but parking lots may be appropriate.
State, federal, and NGO protected areas (Figure 13)
Development in state, federal, and NGO protected areas may be prohibited by law or the permitting process may be very difficult.
Historic sites and cemeteries (point locations) (Figure 14)
Development in historic sites and cemeteries is likely to be prohibited or the permitting process challenging.
Ecological Land Units (ELUs) - habitat diversity- number of ELUs per 30 m grid (Figure 15)
Technical Report #2
biodiversity (http://www.edc.uri.edu/elu/Biodiv101.html). Areas with a high number of ELUs are preferred for land conservation and hence might not be preferred for uses that potentially interfere with that goal, such as wind energy development.
Habitats (birds) (forests, grasslands, and shrubland) (with buffers) (Figures 16, 17, and 18)
Maps of forest, grasslands, and shrubland provide an indication of the location of various bird habitats. Siting of wind energy facilities need to consider that potential impacts on bird species who use these habitats.
Threatened and endangered bird species (Figure 19)
Siting of facilities that might adversely impact threatened and endangered bird species is likely to be prohibited or permitting extremely challenging.
Background noise level (land use, highways) (Figure 20)
A map of the average background noise was generated based on land use types. The map shows the noise levels in dBA. Some communities may wish to give preference to siting in areas with higher background noise levels. The counter argument is that areas with higher background noise levels are most likely to be areas with higher human use (e.g. roads, developed areas, etc.)
Communications towers (Figure 21)
Siting of wind turbines could be prohibited in close proximity to communication towers to minimize the interface of the turbines with communications. Communication towers are located on Figure 21. New European standards specify specific setbacks regarding this issue, and we could seek some guidance from those.
Technical Report #2
Figure 8a. FAA restricted areas around airports (setbacks based on runway lengths).
Figure 8b. (Below) FAA restrictions by elevation, (left) 60 m, (center) 120 m, and (right) 150 m. These correspond to turbines with hub heights of 30, 50, and 80 m, respectively.
Technical Report #2
Figure 10. Wetlands, with 15.2 m (50ft) buffer.
Figure 9. Population densities, in standard deviations above and below the mean, from the 2010 Census.
Technical Report #2
Figure 11.Water bodies, rivers, and large streams, with 30.5 m (100ft) buffer.
Figure 12. Impervious surfaces (highways, highly developed areas, parking lots, etc.).
Technical Report #2
Figure 14. Historic districts, locations, and cemeteries (point locations).
Figure 13. State, federal, and Non-Governmental Orginizations (NGO) conservation lands.
Technical Report #2
Figure 15. Number of Ecological Land Units (ELUs) - habitat diversity- within a 460 m (1500 ft) radius of the center point of a grid with 30 m by 30 m resolution (a, upper panel) and dominant ecological units for the state (b, lower panel) (Source: http://www.edc.uri.edu/elu/).
Technical Report #2
Figure 16. Forest habitat (birds), with contiguous areas greater than 40 hectares (100 acres).
Figure 17. Grassland habitats (birds), with contiguous areas greater than 2 hectares (5 acres) and 100 m buffer.
Technical Report #2
Figure 18. Shrubland habitats (birds), with contiguous areas greater than 1.2 hectares (3 acres) and 100 m buffer.
Figure 19. Threatened and endanger bird locations, with setbacks dependent on species noted in legend.
Technical Report #2
Figure 21.Communication (microwave) towers with 765m (0.5 mile) buffer. Figure 20. Estimated background noise levels in dBA, based on land use.
Technical Report #2
3.
R
ESULTSThe constraints, as provided in Figures 8 through 21, were overlaid on a 30 m by 30 m grid for the entire state and the number of constraints for each grid was determined (Figure 22a). The maximum number of constraints is typically 5 to 6, with the largest number located in areas with the highest levels of development (population, impervious surfaces, etc). The lowest numbers, 1 to several, are in rural areas distant from the coast in the center to the northwestern portion of the state.
It is clear that the constraints should have different weights depending on their importance to those responsible for the siting process. As an example, the constraint for FAA restricted areas is enforced by FAA while the importance of constraints for siting in bird habitats is clearly more subjective. To develop an assessment of the importance that key individuals in the siting process place on the constraints a group of representatives from the municipalities in RI were asked to provide a score of the importance of the individual constraints. The constraint layers were provided to them and the source and rationale for including each were discussed. They were asked to score each constraint from 0 to 5; with 0 representing no importance to the siting process to 5 indicating that the constraint was extremely important. A total of 13 individuals, representing the municipalities who were interested in wind energy development in their towns completed the survey. The mean score for each of the constraints is provided in Table 2. The average score over all constraints was 3.07. The highest score was for FAA constraint, while the lowest was for impervious surfaces. The reasoning behind this low score is that siting in parking lots and the like was deemed to be a minor constraint. Ecological constraints scores were typically in the 2.4 to 2.8 range, while all others were rated at about 3.
A weighted score was generated for each 30 m by 30 m grid and then converted into a siting viability index, progressing from low to high. Figure 22b provides a map of the index. This can be compared to the un-weighted map provided in 22a. Highly developed areas around the bay( Warwick, Cranston, Providence, East Providence, Woonsocket) and centers of large communities (Westerly, Newport/Middletown, and Kingston) have the lowest index scores while inland sites in the north and western portions of the state have the highest scores.
The GIS implementation of the constraints analysis allows one to determine the constraints that make up the score at any individual location. As an example, Figure 23 shows the constraints for a site at Castle Hill, south of Newport and noted by the star in the figure. The site has 5 constraints, which are listed on the insert to the figure. This capability provides a powerful tool to screen sites and determine the potential constraints for each.
Figures 24, 25, and 26 show the (a) un-weighted and (b) weighted (in the form of development viability) constraints with wind speed cutoffs of 4.5 (30 m), 5.5 (50 m), and 6.5 ( 80 m) m/sec, respectively. The underlying figures are exactly the same as in Figure 23. Figure 27 shows all three cutoffs, side by side, to make direct comparison simpler to visualize. The figures
Technical Report #2
show that the number of viable sites decreases dramatically as wind speed cutoffs increase (hub elevation). Inland sites are generally viable for small scale systems (100 kW) if they are at higher elevations but only near coast sites are viable for larger scale systems (1.5 MW). It is clear from the constraint maps that most sites have some potential constraints that need to be addressed in the siting process. The GIS layers provided here should be very helpful in that process.
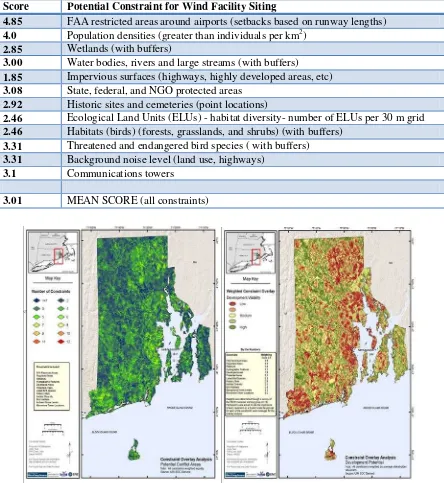
Table 2. Potential Constraints for Wind Facility Siting listed in Table 1 with Municipal Working Group Scores. Score: 0 - constraint is unimportant to 5 - constraint is very important. Average score is provided.
Score Potential Constraint for Wind Facility Siting
4.85 FAA restricted areas around airports (setbacks based on runway lengths)
4.0 Population densities (greater than individuals per km2)
2.85 Wetlands (with buffers)
3.00 Water bodies, rivers and large streams (with buffers)
1.85 Impervious surfaces (highways, highly developed areas, etc)
3.08 State, federal, and NGO protected areas
2.92 Historic sites and cemeteries (point locations)
2.46 Ecological Land Units (ELUs) - habitat diversity- number of ELUs per 30 m grid
2.46 Habitats (birds) (forests, grasslands, and shrubs) (with buffers)
3.31 Threatened and endangered bird species ( with buffers)
3.31 Background noise level (land use, highways)
3.1 Communications towers
3.01 MEAN SCORE (all constraints)
Figure 22. Number of constraints (a, left) and weighted constraints (b, right)(in the form of development viability) for wind energy siting.
Technical Report #2
Figure 24. Number of constraints (a, left) and weighted constraints (b, right) (in the form of development viability) with 4.5 m/sec (30 m) overlay.
Figure 23. Determination of constraints for selected site south of Newport.
Technical Report #2
Figure 26. Number of constraints (a, left) and weighted constraints (b, right)( in the form of development viability) with 6.5 m/sec (80 m) overlay.
Figure 25. Number of constraints (a, left) and weighted constraints (b, right) (in the form of development viability) with 5.5 m/sec (50 m) overlay.
Technical Report #2
Figure 27. Number of constraints with 4.5 (a, left); 5.5 (b, center); and 6.5 (c, right) m/sec wind speed cutoffs overlaid.
4.
S
UMMARYA statewide analysis has been performed to identify wind resources at three vertical elevations (30, 50, and 80 m). This analysis shows that wind speeds are generally modest because of the limited variations in topography and the extensive amount of the state that is forested. Wind speeds increase with elevation with a vertical profile that is locally dependent on land cover and type. Highest mean winds are found in a narrow band following the southern RI coast line, around the shoreline of Narragansett Bay, and then into southeastern RI (Newport, Tiverton). This is a direct result of proximity of these locations to the large water bodies where winds are generally stronger due to lower surface roughness. The viability of siting wind facilities is strongly dependent on turbine size with a decreasing number of viable areas with increasing wind power output. For smaller turbines siting is viable in inland areas while for larger turbines only sites that are close to the ocean have significant potential.
A number of variables that might constitute constraints to wind siting were developed and put in the form of GIS layers. The constraints included human, ecological, land and cultural and historical uses. A constraint analysis was performed on 30 m by 30 m grid covering the entire state and identified the number of constraints for each grid square. A weighted version of the constraints analysis was performed based on scoring from municipal representatives in the state. The weighted constraint maps were converted into development viability maps (low to high). Both weighted and un-weighted constraint (development viability) maps were developed with minimum mean annual wind speeds of 4.5, 5.5, and 6.5 m/sec, reflecting wind turbines at elevations of 30, 50, and 80 m above ground, respectively. These maps allow one to identify areas most viable for development for various turbine sizes. The combined maps indicate that siting is highly site specific and each potential site may have one or more constraints that will
Technical Report #2
need to be addressed. The maps also suggest that siting of large scale facilities in RI is likely to be restricted to individual or several turbines and not wind farms. The tools and GIS layers developed during this study should help developers, municipal officials, and interested citizens to perform initial screening of sites quickly and efficiently. It will also serve to highlight any critical constraints early in the siting process.
Technical Report #2
5.
R
EFERENCESBrower, M., 2007. Wind resource maps of Southern New England, prepared by True Wind Solutions, LLC, 10 p
Grilli, A., M. Spaulding, C. Damon, C. O’Reilly, and G. Potty, Wind resource assessment and
siting of wind energy facilities in Rhode Island, RI Renewable Energy Siting Partnership Technical Report, May 2012.
Technical Report #3
RESP TECHNICAL REPORT #3
W
INDR
ESOURCEA
SSESSMENT ANDS
ITING FORW
INDE
NERGYF
ACILITIES INR
HODEI
SLANDBy
Annette Grilli, Malcolm Spaulding, Christopher Damon,
Christopher O’Reilly, and Gopu Potty
University of Rhode Island,
Narragansett Bay Campus
June, 2012
2.1 Terminology and conceptual framework ... 48
2.2 Theoretical background ... 50
2.3 Data sources ... 54
Model simulated wind data ... 54 Wind observations ... 54 2.4 Wind resource spatial variability... 55
Wind speed distribution parameters... 55 Wind speed vertical profile ... 57 Wind geography ... 63 Mean expected theoretical wind power ... 65 2.5Expected technical power spatial variability ... 68
Mean expected technical power ... 68 Capacity factor ... 68 2.6. Wind measurement at stations ... 73
2.7 Wind and power uncertainties estimates ... 76
Comparison between observed and simulated wind speed at stations at
anemometer height ... 76 Uncertainty in mean wind speed ... 77 Uncertainty in mean power assuming accurate shape parameter ... 77 Uncertainty in shape parameter ... 78 Uncertainty in mean power assuming stochastic Weibull parameter ... 80 3.PRACTICAL WIND RESOURCE AND ECOSYSTEM SERVICES CONSTRAINTS ... 83 Feasible siting area ... 85 Optimal Siting Area ... 86 4.SETBACKS FOR SITING OF WIND ENERGY FACILITIES ... 87
4.1. Structural failure, blade and ice throw ... 87
4.2. Noise and Flicker ... 89
Recommendation for noise setbacks ... 90 Recommendation for shadow flicker setback ... 91 Recommendation for signal interference setback ... 91 5.WEB BASED ACCESS TO WIND RESOURCE,CONSTRAINTS AND SETBACK SITING TOOLS ... 92 6.CONCLUSION ... 93 7.REFERENCES ... 96
Technical Report #3
List of Figures
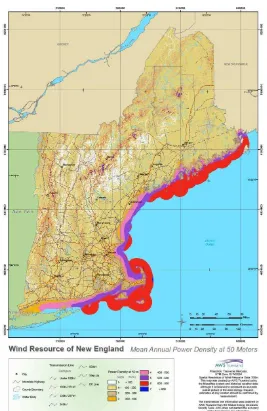
Figure 1. Conceptual Framework ... 48 Figure 2. Theoretical Wind Resource estimated from AWS Truewind, Bower, 2007. Mean annual power density at 50 meters. ... 50 Figure 3. Mean Wind Speed at 30, 50 and 80 meters –Data source: AWS Truewind. ... 56 Figure 4. Weibull shape parameter. ... 57 Figure 5. Shear coefficient inferred from AWS Truewind data. ... 58 Figure 6. Land cover from RIGIS landcover. ... 60 Figure 7. Roughness length Z0 (m). ... 61 Figure 8. Wind Geography based on cluster analysis. ... 64 Figure 9. Elevation (m). ... 64 Figure 10. Mean Theoretical power at 30 m, 50 m, and 80 meters. ... 66 Figure 11. Wind speed (11a) and Theoretical power (11b) sensitivity at 30 m to Charnock law versus power-law in vertical profile definition in m/s and percentage of expected power
respectively (%). ... 67 Figure 12.Technical power at 30 m, 50 m, and 80 m for 14 m/s rated speed. ... 69 Figure 13. Capacity Factor at 80 m for 10 m/s, 12 m/s, and 14 m/s rated speed. ... 72 Figure 14. Wind station locations. ... 73 Figure 15. Selected measurement length for stations shown in Table 3 ... 74 Figure 16. Weibull distribution with scale(c) and shape parameter (k) and their confidence
interval at anemometer height (16.5 m). ... 75 Figure 17. Wind speed directional frequency distribution (wind rose) and theoretical power directional frequency distribution (power rose) at anemometer height (16.5 m). ... 75 Figure 18. Monthly mean wind speed at anemometer height (16.5 m). ... 76 Figure 19. Simulated (AWS) and observed mean wind speed at measurement stations probability distribution ... 76 Figure 20. Mean wind speed relative difference between AWS Truewind values and observations at stations. ... 77 Figure 21. Sensitivity of the expected theoretical power to the wind speed uncertainty... 78 Figure 22. Weibull shape parameter distributions for observed data at stations (black dots) and corresponding values inferred from AWS Truewind data (open circles). ... 79 Figure 23. Probability distribution of the differences in Weibull shape coefficients between observations and AWS Truewind values at stations. ... 79 Figure 24. Sensitivity of the expected theoretical power to the shape parameter (k) value. ... 80 Figure 25. Mean wind speed relative uncertainty probability density. ... 80 Figure 26. Expected mean theoretical power relative uncertainty ... 81 Figure 27. Expected mean relative theoretical power uncertainty. ... 82 Figure 28. Mean uncertainty of the mean power value. ... 82 Figure 29. Siting approach based on ecosystem services optimization. ... 83 Figure 30. FAA restrictions by elevation, (left) 60 m, (center), 120 m, and (right) 150 m
elevations. These correspond to turbines with hub heights of 30, 50, and 80 m, respectively. .... 86
Technical Report #3
List of Tables
Table 1. Roughness length based on land use (Spruce, Berglund and Davis. NASA, 2004). ... 62 Table 2. Capacity factors at 3 sites, for 3 turbines (at each site), characterized by the following specifications: cut-in and cut-out are 3.5 m/s and 25 m/s and rated speed of 10 m/s, 12 m/s and 14 m/s, respectively. Each site is defined by its mean wind speed at 80 meters height. Theoretical power as well as technical power are also calculated. ... 70 Table 3. Selected measurement station locations. ... 74 Table 4. Ecosystem Services terminology and categories addressed in the constraint analysis; variables addressed in the state of the present study are indicated either by X or by their range of variation: a continuous variable varying between 0 and 1 is indicated as [0-1]; a binary variable is indicated as [0/1]. ... 85 Table 5. Turbine Characteristics of two generic turbines used in the setback failure examples. . 89 Table 6. Set back distance based on an accepted risk of fall beyond that distance for two generic turbines (Table 5) and three potential choices of accepted risk. ... 89 Table 7. RESP Noise Guidelines. ... 90 Table 8. Recommendations for shadow flicker (hours per year). ... 91
Technical Report #3
Executive Summary
A statewide analysis has been performed to identify and evaluate land based wind resources in Rhode Island (A prior analysis performed in the context of the SAMP project has assessed offshore wind resources). The present report is designed to establish a progression from theoretical wind resource assessment towards technical and finally, practical wind resource assessment; In brief, the general philosophy is to provide an assessment as accurate as possible of the wind resource, as provided by the wind (theoretical resource), but more precisely, to provide an assessment of the extractable power by a wind turbine (technical resource), and even more practically, to provide guidance towards the practical resource, which reflects the potential sites where wind turbines could feasibly be deployed considering the current social and ecological constraints (practical resource).
The Continental Rhode Island wind climate is characterized by a theoretical wind resource that is relatively modest compared to offshore area, with expected mean wind speed on the order of 4 to 6.5 m/s at 30 meters height and of the order of 5 to 7.5 m/s at 80 meters height, versus 8 to 9.5 m/s offshore, at 80 meters, showing a spatial variability primary due to topography and coastal proximity. Highest mean winds are found in a narrow band following the southern RI coastline, around the shoreline of Narragansett Bay, and then into southeastern RI (Newport, Tiverton). This is a direct result of proximity of these locations to the large water bodies where winds are generally stronger due to lower surface roughness.
Mapping theoretical and technical power shows that the technical power, is approximately half the theoretical power, and its spatial variance is slightly reduced. For example, at 30 meters height, the expected technical power is on the order of 100 W/m2 in the most sheltered inland areas (forested valley) and 200 W/m2 in coastal areas , while the theoretical power is on the order of 200 W/m2 and 500 W/m2, respectively. The viability of siting wind facilities is strongly dependent on turbine size with a decreasing number of viable areas with increasing wind power output. For smaller turbines siting is viable in inland areas while for larger turbines only sites that are close to the ocean/BAY have significant potential as shown by mapping the capacity factor for selected generic turbine.
The resource assessment analysis is performed in terms of expected mean power and its uncertainty around this mean value. It is shown that if the mean wind speed between 10 and 30 meters height can be estimated with uncertainty on the order of 3% around the mean value, the expected mean power carries an expected uncertainty of 10 times this order of magnitude, order of 30 % around the mean value, in a 95 % confidence interval. The current deployment of towers and SODAR measurement by the URI team (Merrill and Knorr, 2012) will provide additional wind speed time series, which will contribute to estimate and reduce the uncertainty associated with the current estimations at elevation.
Technical Report #3
Major ecosystem services are identified as social or ecological “constraints” to the siting of a wind turbine.
A resulting geography of the “practical area” showing feasible (eliminating exclusionary areas) and optimal area is developed. A companion report provides a GIS based constraint analysis. In identifying feasible area, FAA exclusionary area were carefully mapped and excluded. User interactive software was developed to identify FAA exclusionary zones based on turbine’s specification (tower height and blade diameter) (O’Reilly, 2012).
An interactive tool was developed to estimate setback distance from a deployed turbine. If noise and flicker setback distances are in agreement with the current best practice usage, the proposed setback distance recommended to prevent accident from potential blade or piece of blade breaking and being thrown, is based on a combination of ballistic theory and risk
assessment, and is therefore function of the wind turbine’s specifications (angular velocity and
blade radius). The resulting proposed setback distances are slightly larger than the setback distances previously proposed in Rhode Island, but are however, in close agreement with most setback distances adopted in Europe.
A GIS interactive tool is developed with which a user can query any site in Rhode Island and obtain relevant information in terms of wind resource, expected theoretical or technical power, capacity factor for a given turbine, potential social and ecological constraints, expected vertical wind profile and therefore power estimation at any level, proposed setback distance for given turbine ‘specifications, corresponding noise level spatial spreading zone, and the expected flicker spatial zone of influence.