2014
ACTIONS AND
ACCOUNTABILITY
TO ACCELERATE THE
WORLD’S PROGRESS
This report highlights the global nature of malnutrition and the successes and bottlenecks in addressing it. Malnutrition continues to affect the lives of millions of children and women worldwide. Every country is affected by some form of nutrition problem. This calls for countries to put in place appropriate strategies to overcome the problem in a concerted manner. But it isn’t an easy task. We all have many priorities and concerns that compete for our attention, our resources, our energy, and our political commitment. Ethiopia strongly believes that for a country to achieve sustainable human and economic growth, it must give special attention to the early stages of life as the foundation of human capital. We also believe that aligning and harmonizing partners’ plans with the government is critical to delivering results in the most eficient and effective manner. This necessitates not only more money for nutrition, but also more value for money.
KESETEBIRHAN ADMASU BIRHANE MINISTER OF HEALTH, FEDERAL DEMOCRATIC REPUBLIC OF ETHIOPIA
I congratulate the authors of the Global Nutrition Report and welcome their clear and decisive recom-mendations for action. The data and the evidence encourage us to become more ambitious and more accountable. There is no one solution for all, but many countries are showing that progress is achievable. The Scaling Up Nutrition Movement will continue to provide an open space for everyone that truly cham-pions nutrition.
TOM ARNOLD SCALING UP NUTRITION (SUN) MOVEMENT COORDINATOR AD INTERIM
Ending malnutrition throughout the world requires action on many fronts. The health sector cannot do it alone. But political commitment is growing. More and more countries know what they need to do to en-sure access to healthy diets for all. This report will help us track progress toward global nutrition targets and understand where greater investments are needed.
MARGARET CHAN DIRECTOR-GENERAL, WORLD HEALTH ORGANIZATION
The Global Nutrition Report is timely and inspiring. Its overview of under- and overnutrition taps the mo-mentum and urgency for achieving better nutrition, as encompassed by the Scaling Up Nutrition Move-ment and the Zero Hunger Challenge. It highlights areas for action, contributes to strengthened nutrition accountability, and guides as well as provides a yardstick for alliances across the supply chains for food and health, work with which WFP is intimately involved.
ERTHARIN COUSIN EXECUTIVE DIRECTOR, WORLD FOOD PROGRAMME
As this report reminds us, good nutrition is a foundation for sustainable development. Malnutrition affects all countries—North, South, East, and West—so all of us have a strong interest in working together to end this scourge. We know much about what must be done to improve nutrition, but we need to keep building political support to allow these actions to be scaled up. This report helps that scale-up by identifying where progress is lagging, by suggesting actions to accelerate it, and by making recommendations to ensure all stakeholders are more accountable for taking action to end malnutrition.
The indings highlighted in this report attest to an important commitment to bring together the data that exist on malnutrition and demonstrate meaningful progress on the commitments made at the 2013 Nutri-tion for Growth summit. Policymakers should heed the report’s call to prioritize collecting more and better nutrition data to drive even greater impact on the lives of the poorest in the years ahead.
MELINDA GATES CO-CHAIR, BILL & MELINDA GATES FOUNDATION
The report offers a much-needed platform for tracking progress on nutrition. Its emphasis on productive partnerships to accelerate improvements is especially relevant as the international community commits to action at the Second International Conference on Nutrition. Our generation has all the conditions to respond to the Zero Hunger Challenge and make all forms of malnutrition a relic of the past. True to our Constitution and the responsibility entrusted to us to help end hunger and raise the levels of nutrition, FAO is committed to working with all stakeholders to make this happen.
JOSÉ GRAZIANO DA SILVA DIRECTOR-GENERAL, FOOD AND AGRICULTURE ORGANIZATION OF THE UNITED NATIONS
Nutrition is one of the most cost-effective investments we can make in children—and fundamental to achieving all our sustainable development goals. But until recently, it was a forgotten topic. This has started to change as the Scaling Up Nutrition Movement has gained force, supported by more than 50 countries and the commitment of governments, international organizations, civil society, and communities to scale up nutrition. This report highlights the progress we have made and the urgent necessity to do more—set-ting ambitious goals and holding ourselves accountable for achieving them. For when we lose a child’s full potential, we lose a piece of our common future.
ANTHONY LAKE EXECUTIVE DIRECTOR, UNICEF
I am pleased to note the progress made in reducing malnutrition. We are now better informed about the complexities of malnutrition. Our response must therefore be adequate, multidimensional, and compre-hensive. It requires country-by-country interventions and a multistakeholder approach. At a community level, this means changing beliefs, habits, and practices. We must start early, from the health of the mother, through the irst 1,000 days of life and beyond.
GRAÇA MACHEL FOUNDER, GRAÇA MACHEL TRUST
The Global Nutrition Report demonstrates with data and with examples what we all know: improved nutri-tional status is essential for sustainable development. We are all responsible for ensuring that actions and investments truly respond to the realities of those for whom the multiple burdens of malnutrition are not an abstract concept, but an everyday reality. Access to timely and reliable data empowers decisionmakers to make the most eficient use of resources and is key to ensuring that all stakeholders’ commitments are honored and sustained.
2014
ACTIONS AND
ACCOUNTABILITY
TO ACCELERATE THE
WORLD’S PROGRESS
ON NUTRITION
This report was produced by an Independent Expert Group (IEG) empowered by the Global Nutrition Report Stakeholder Group. The writing was a collective effort by the IEG members, supplemented by additional analysts and writers. They are all listed here:
Lawrence Haddad, International Food Policy Research Institute, Washington, DC; Endang Achadi, University of Indonesia, Jakarta;
Mohamed Ag Bendech, Food and Agriculture Organization of the United Nations, Rome; Arti Ahuja, Women and Child Development, Odisha, India; Komal Bhatia, Institute of Development Studies, Brighton, UK; Zulfiqar Bhutta, Center for Global Child Health, Hospital for Sick Children, Toronto, Canada, and Center of Excellence in Women and Child Health, Aga Khan University, Karachi, Pakistan; Monika Blössner, World Health Organization, Geneva; Elaine Borghi, World Health Organization, Geneva; Esi Colecraft, University of Ghana, Accra; Mercedes de Onis, World Health Organization, Geneva; Kamilla Eriksen, University of Cambridge, UK; Jessica Fanzo, Columbia University, New York; Rafael Flores-Ayala, Centers for Disease Con-trol and Prevention, Atlanta; Patrizia Fracassi, Scaling Up Nutrition Secretariat, Geneva; Elizabeth Kimani, African Population and Health Research Centre, Nairobi; Eunice Nago, University of Abomey-Calavi, Benin; Julia Krasevec, United Nations Children’s Fund, New York; Holly Newby, United Nations Children’s Fund, New York; Rachel Nugent, University of Washington, Seattle; Stineke Oenema, Interchurch organization for development cooperation (ICCO) Alliance, Utrecht, Netherlands; Yves Martin-Prével, Institut de recherche pour le développement, Marseille, France; Judith Randel, Development Initiatives, Bristol, UK; Jennifer Requejo, Partnership for Maternal, Newborn & Child Health, World Health Organization, Geneva; Tara Shyam, Institute of Development Studies, Brighton, UK; Emorn Udomkesmalee, Mahidol University, Bangkok, Thailand; and K Srinath Reddy, Public Health Foundation of India, New Delhi
Authors of the panels in this report, and their affiliations, are as follows:
Endang Achadi (with acknowledgment to Sudarno Sumarto and Tauik Hidayat), University of Indonesia, Jakarta; Jose Luis Alvarez, Action Against Hunger UK (ACF), London; Michael Anderson, Children’s Investment Fund Foundation, London; Fernando Arriola, Secretaría de Seguridad Alimen-taria y Nutricional, Guatemala; Komal Bhatia, Institute of Development Studies, Brighton, UK; Claire Blanchard, Save the Children UK, London; Jennifer Bryce and colleagues, Johns Hopkins University, Baltimore, USA; Jesús Bulux, Secretaría de Seguridad Alimentaria y Nutricional, Guate-mala; Shruthi Cyriac, International Food Policy Research Institute, Washington, DC; Andrew Dillon, Michigan State University, East Lansing, USA; Kamilla Eriksen, University of Cambridge, UK; Jessica Fanzo, Columbia University, New York; Joel Gittelsohn, Johns Hopkins Bloomberg School of Public Health, Baltimore, USA; Carla Guillén, Secretaría de Seguridad Alimentaria y Nutricional, Guatemala; Lawrence Haddad, International Food Policy Research Institute, Washington, DC; Corinna Hawkes, World Cancer Research Fund International, London; Derek Headey, International Food Policy Research Institute, Washington, DC; Cecibel Juárez, Secretaría de Seguridad Alimentaria y Nutricional, Guatemala; Inge Kauer, Access to Nutrition Foundation, Utrecht, Netherlands; Joyce Kinabo, Sokoine University of Agriculture, Morogoro, Tanzania; Patrick Kolsteren, Ghent University, Belgium; Annamarie Kruger, North-West University, South Africa; Carl Lachat, Ghent University, Belgium; Purnima Menon, International Food Policy Research Institute, Washington, DC; Eunice Nago, University of Abomey-Calavi, Benin; Nicholas Nisbett, Institute of Development Studies, Brighton, UK; Deanna Kelly Olney, International Food Policy Research Institute, Washington, DC; Marcellin Ouédraogo, Helen Keller International, Ouagadou-gou, Burkina Faso; Abdoulaye Pedehombga, Helen Keller International, OuagadouOuagadou-gou, Burkina Faso; Clara Picanyol, Oxford Policy Management, Ox-ford, UK; Jennifer Requejo, Partnership for Maternal, Newborn & Child Health, World Health Organization, Geneva; Marie Ruel, International Food Policy Research Institute, Washington DC; Lisa Smith, TANGO International, Tucson, USA; Boyd Swinburn, University of Auckland, New Zealand; Dolf te Lintelo, Institute of Development Studies, Brighton, UK; Jonathan Tench, SUN Business Network; Otto Velasquez, Secretaría de Seguridad Ali-mentaria y Nutricional, Guatemala; Daniel Wang, Harvard School of Public Health, Cambridge, USA; Walter Willett, Harvard School of Public Health, Cambridge, USA
Copyright © 2014 International Food Policy Research Institute. All rights reserved. Contact the Communications and Knowledge Management Divi-sion at [email protected] for permisDivi-sion to reprint.
Suggested citation: International Food Policy Research Institute. 2014. Global Nutrition Report 2014: Actions and Accountability to Accelerate the World’s Progress on Nutrition. Washington, DC.
Any opinions stated herein are those of the authors and are not necessarily representative of or endorsed by the International Food Policy Research Institute. The boundaries and names used do not imply oficial endorsement or acceptance by the International Food Policy Research Institute.
International Food Policy Research Institute 2033 K Street, NW
Washington, DC 20006-1002 USA Telephone: +1-202-862-5600 www.ifpri.org
ISBN: 978-0-89629-564-3
DOI: http://dx.doi.org/10.2499/9780896295643
PRODUCTION CREDITS
Editors: Heidi Fritschel, Terra Carter, John Whitehead, and Andrew Marble Cover design: Julia Vivalo
CONTENTS
Supplementary Online Materials ... ix
Acknowledgments ... x
Abbreviations ... xii
Executive Summary ...xiii
Chapter 1 Introduction ... 2
Chapter 2 Nutrition Is Central to Sustainable Development ... 7
Chapter 3 Progress toward the World Health Assembly Nutrition Targets Is Too Slow ... 15
Chapter 4 The Coexistence of Different Forms of Malnutrition Is the “New Normal” ... 22
Chapter 5 The Coverage of Nutrition-Speciic Interventions Needs to Improve ... 29
Chapter 6 Interventions Addressing the Underlying Determinants of Nutrition Status Are Important,
but They Need to Be More Nutrition Sensitive ... 38
Chapter 7 The Enabling Environment Is Improving, but Not Quickly Enough ... 47
Chapter 8 The Need to Strengthen Accountability in Nutrition ... 56
Chapter 9 What Are the Priorities for Investment in Improved Nutrition Data? ... 67
Chapter 10 Key Messages and Recommendations ... 71
Appendix 1 The Nutrition Country Proile: A Tool for Action ... 75
Appendix 2 Which Countries Are on Course to Meet Several WHA Targets? ... 77
Appendix 3 Which Countries Are on Course for Which WHA Targets? ... 79
Appendix 4 Donor Spending on Nutrition-Speciic and Nutrition-Sensitive Interventions and Programs ... 84
Appendix 5 How Accountable Is the
Global Nutrition Report
? ... 86
Appendix 6 Availability of Data for Nutrition Country Proile Indicators ... 88
Notes ... 91
References ... 95
PANELS
Panel 1.1 Types of Nutrition Investment ... 4
Lawrence Haddad
Panel 2.1 Nutrition and the Sustainable Development Goals—No Room for Complacency ... 11
Michael Anderson
Panel 2.2 Some New Data from India: What If? ... 12
Lawrence Haddad, Komal Bhatia, and Kamilla Eriksen
Panel 2.3 How Did Maharashtra Cut Child Stunting? ... 13
Lawrence Haddad
Panel 2.4 Can Improving the Underlying Determinants of Nutrition Help Meet the WHA Targets? ... 14
Lisa Smith and Lawrence Haddad
Panel 4.1 Malnutrition in the United States and United Kingdom ... 25
Jessica Fanzo
PANELS CONTINUED
Panel 4.2 Regional Drivers of Malnutrition in Indonesia ... 26
Endang Achadi with acknowledgment to Sudarno Sumarto and Taufik Hidayat
Panel 4.3 Compiling District-Level Nutrition Data in India ... 27
Purnima Menon and Shruthi Cyriac
Panel 4.4 Targeting Minority Groups at Risk in the United States ... 28
Jennifer Requejo and Joel Gittelsohn
Panel 5.1 Measuring Coverage of Programs to Treat Severe Acute Malnutrition ... 37
Jose Luis Alvarez
Panel 6.1 Trends in Dietary Quality among Adults in the United States ... 41
Daniel Wang and Walter Willett
Panel 6.2 How Did Bangladesh Reduce Stunting So Rapidly? ... 43
Derek Headey
Panel 6.3 Using an Agricultural Platform in Burkina Faso to Improve Nutrition during the First 1,000 Days ... 45
Deanna Kelly Olney, Andrew Dillon, Abdoulaye Pedehombga, Marcellin Ouédraogo, and Marie Ruel
Panel 7.1 Is There a Better Way to Track Nutrition Spending? ... 48
Clara Picanyol
Panel 7.2 Tracking Financial Allocations to Nutrition: Guatemala’s Experience ... 49
Jesús Bulux, Otto Velasquez, Cecibel Juárez, Carla Guillén, and Fernando Arriola
Panel 7.3 A Tool for Assessing Government Progress on Creating Healthy Food Environments ... 51
Boyd Swinburn
Panel 7.4 Engaging Food and Beverage Companies through the Access to Nutrition Index ... 52
Inge Kauer
Panel 7.5 How Brazil Cut Child Stunting and Improved Breastfeeding Practices ... 54
Jennifer Requejo
Panel 8.1 Scaling Up Nutrition through Business ... 61
Jonathan Tench
Panel 8.2 How Civil Society Organizations Build Commitment to Nutrition ... 62
Claire Blanchard
Panel 8.3 Building Civil Society’s Capacity to Push for Policies on Obesity and Noncommunicable Diseases ... 63
Corinna Hawkes
Panel 8.4 Can Community Monitoring Enhance Accountability for Nutrition? ... 64
Nick Nisbett and Dolf te Lintelo
Panel 8.5 National Evaluation Platforms: Potential for Nutrition ... 65
Jennifer Bryce and colleagues
Panel 8.6 The State of African Nutrition Data for Accountability and Learning ... 66
Carl Lachat, Joyce Kinabo, Eunice Nago, Annamarie Kruger, and Patrick Kolsteren
FIGURES
Figure 1.1 Conceptual framework of this report ... 5
Figure 2.1 Beneit-cost ratios of scaling up nutrition-speciic interventions for stunting reduction in selected countries ... 9
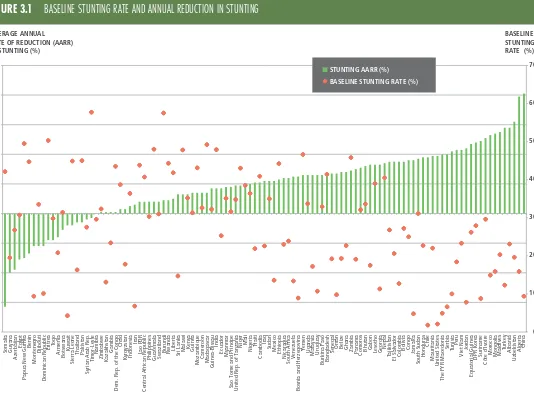
Figure 3.1 Baseline stunting rate and annual reduction in stunting ... 17
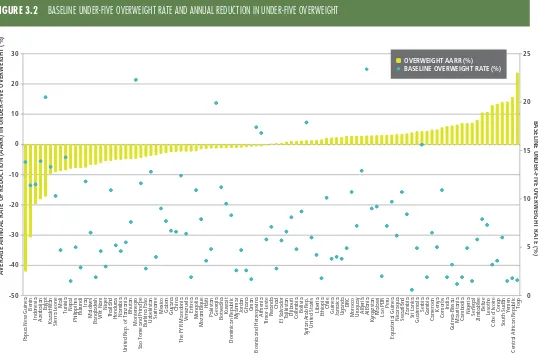
Figure 3.2 Baseline under-ive overweight rate and annual reduction in under-ive overweight ... 18
Figure 3.3 Percentage of infants age 0–5 months who are exclusively breastfed, by region, around 2000 and 2012 ... 19
Figure 3.4 Average incidence of low birth weight by UN subregion (%) ... 19
Figure 3.6 Number of countries on course to meet WHA global nutrition targets ... 21
Figure 3.7 Number of countries on course to meet each WHA global target ... 21
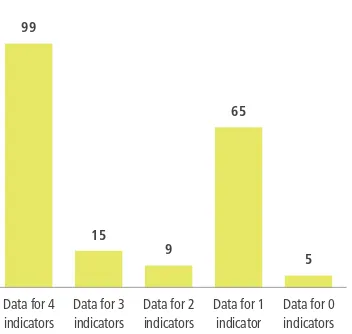
Figure 3.8 Number of countries that have data to determine WHA target status for four WHA indicators ... 21
Figure 3.9 Number of countries with missing data for at least one WHA indicator, by region ... 21
Figure 4.1 Prevalence of under-ive stunting and overweight for highest and lowest wealth quintiles in
selected countries (%) ... 27
Figure 5.1 Average share of women receiving iron–folic acid supplements for at least 90 days during pregnancy (%) ...31
Figure 5.2 Baseline breastfeeding rates and annual increase in breastfeeding, last two surveys ... 31
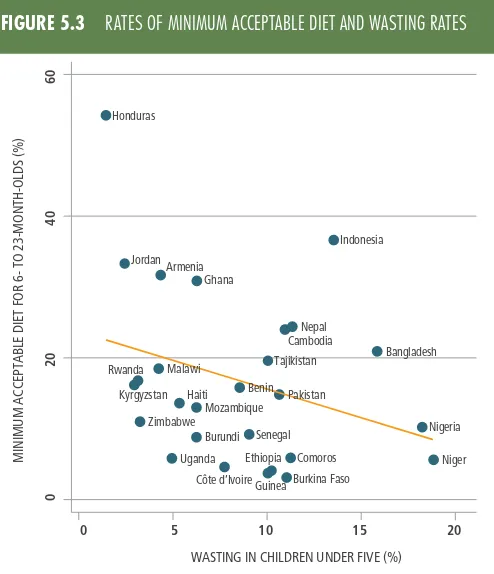
Figure 5.3 Rates of minimum acceptable diet and wasting rates ... 32
Figure 5.4 Rates of minimum dietary diversity and stunting rates ... 32
Figure 5.5 Average coverage of vitamin A supplementation (%) ... 33
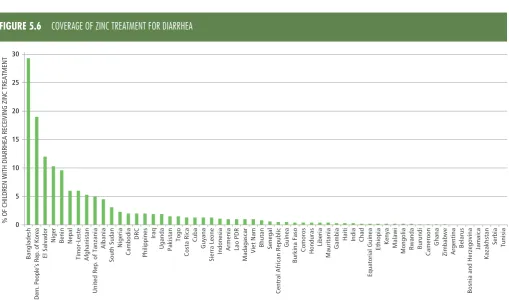
Figure 5.6 Coverage of zinc treatment for diarrhea ... 33
Figure 5.7 Coverage of salt iodization ... 34
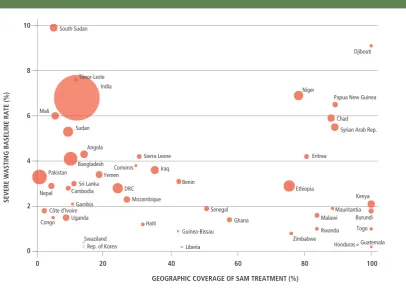
Figure 5.8 Geographic coverage of SAM treatment by under-ive severe wasting rates ... 35
Figure 6.1 Undernourishment trends by subregion ... 39
Figure 6.2 Undernourishment and overacquisition trends by region ... 39
Figure 6.3 Trends in calorie overacquisition in selected countries ... 40
Figure 6.4 Trends in access to improved water and sanitation in subregions of Africa and Asia ... 40
Figure 6.5 Trends in female secondary education enrollment ... 42
Figure 6.6 Health worker density per 1,000 people ... 42
Figure 6.7 Share of government expenditures on four sectors related to nutrition (%) ... 44
Figure 6.8 Share of government expenditures on four sectors related to nutrition in selected African countries (%), 2010 ... 44
Figure 7.1 Nutrition-related spending commitments of 13 donors ... 50
Figure 7.2 Nutrition-related disbursements of 10 donors ... 50
Figure 7.3 Percentage of countries with a top score for each enabling environment indicator ... 53
Figure 7.4 Mode scores for progress markers of institutional transformation in SUN countries ... 55
TABLES
Table 1.1 Audiences for this report: Individuals, organizations, and networks ... 4
Table 2.1 The human and economic costs of malnutrition ... 8
Table 2.2 How nutrition can contribute to the proposed Sustainable Development Goals (SDGs) ... 10
Table 2.3 World Health Assembly nutrition targets ... 11
Table 2.4 Where nutrition targets can be embedded within the 169 SDG targets ... 12
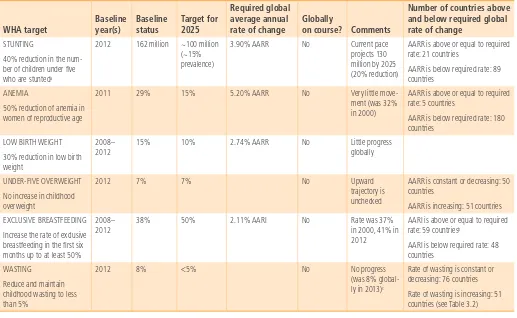
Table 3.1 Progress toward the global WHA targets... 16
Table 3.2 Changes in wasting rates ... 19
Table 3.3 Proposed WHO rules for deining whether a country is on or off course to meet
global WHA targets ... 20
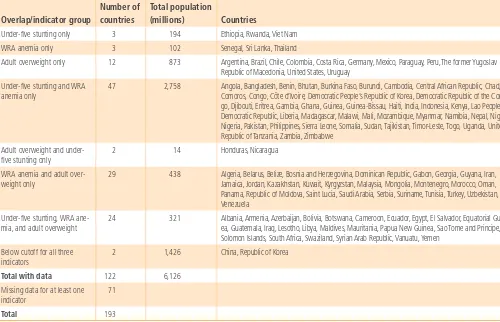
Table 4.1 Countries with overlapping stunting, wasting, and overweight in children under age ive ... 23
Table 4.2 Countries with overlapping thinness in women of reproductive age, short stature
in women of reproductive age, and adult female overweight ... 24
Table 4.3 Countries with overlapping under-ive stunting, anemia in women of reproductive age, and adult overweight ... 25
Table 4.4 Trends in stunting equity over time ... 28
Table 5.1 State of coverage data for nutrition-speciic interventions ... 30
TABLES CONTINUED
Table 5.2 Coverage of iron–folic acid supplementation during pregnancy ... 31
Table 5.3 Summary of infant and young child diets ... 32
Table 5.4 Countries with weak coverage of ive nutrition-speciic interventions... 34
Table 5.5 Nutrition-speciic interventions with the lowest coverage rates for 37 countries ... 34
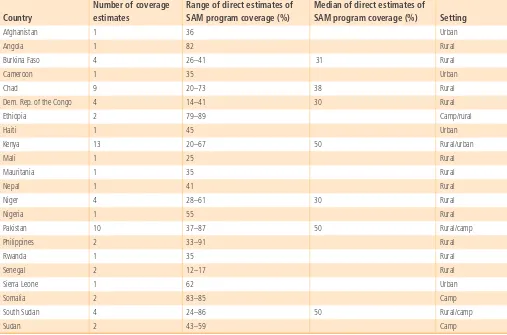
Table 5.6 Current direct estimates of coverage of SAM treatment ... 36
Table 6.1 Number of countries that are vulnerable on underlying determinants for undernutrition ...42
Table 6.2 Countries that are most vulnerable by each underlying determinant ... 43
Table 6.3 Examples of ways to make sector investments more nutrition sensitive ... 46
Table 7.1 Regions with high risks of, and weak policies for, hypertension and diabetes ... 55
Table 8.1 Response rates to requests for progress against N4G commitments ... 57
Table 8.2 Country progress in meeting N4G commitments ... 58
Table 8.3 Civil society organizations’ progress in meeting N4G commitments ... 59
Table 8.4 Self-assessments of N4G business commitments on workforce nutrition ... 59
Table 8.5 Company progress in meeting N4G commitments ... 60
Table 8.6 UN progress in meeting N4G commitments ... 61
Table 8.7 Donor progress in meeting N4G noninancial commitments ... 62
Table 8.8 Other organizations’ progress in meeting N4G commitments ... 63
Table 9.1 Data gaps that are constraints to needed action... 68
Table 9.2 Year of the most recent survey containing under-ive anthropometry in the WHA database ... 69
Table 9.3 Some key points from Technical Notes 4–12 on ways forward in illing some data gaps ... 70
Table A.1 Guide to the nutrition country proiles ... 76
Table A.2 Countries on course to meet several WHA targets ... 77
Table A.3 Country progress on the four WHA targets ... 79
Table A.4 Donor spending on nutrition-speciic and nutrition-sensitive categories, 2010 and 2012 (thousands of US$) ... 85
Table A.5 Applying the accountability framework to the report’s own processes ... 87
SUPPLEMENTARY ONLINE MATERIALS
The following supporting materials are available at www.globalnutritionreport.org.
Nutrition proiles
Global nutrition proile (data available for 84 indicators on a global scale)
Nutrition country proiles (data available for 84 indicators for each of the 193 United Nations member states)
Technical notes
Technical Note 1 Nutrition Country Proile Indicators Deinitions and Sources
Technical Note 2 LiST Analysis for Global Nutrition Report Independent Expert Group, Zuliqar Bhutta Technical Note 3 The Excessive (and Wasteful) Consumption of Food, Carlo Caiero
Technical Note 4 Toward Sustainable, Healthy, and Proitable Food Systems: Nutrition and the Sustainable Management of Natural Resources, United Nations System Standing Committee for Nutrition
Technical Note 5 Learning from Efforts to Cost Country Plans: Priority Technical Issues to Address, Helen Connolly
Technical Note 6 Measuring and Tracking the Access Dimension of Food Security: Available Indicators and Recommendations for Future Investments, Marie T. Ruel, Terri J. Ballard, and Megan Deitchler
Technical Note 7 Voices of the Hungry: Where in the World Is Food Insecurity More Severe? Carlo Caiero
Technical Note 8 Assessing Capacity: The Need to Invest in Nutrition Capacity Development in the West Africa Region, Roger Sodjinou
Technical Note 9 Data Gaps for Low Birth Weight, Holly Newby
Technical Note 10 Measuring Overweight and Obesity: Need for Harmonization and Reinement, Rachel Nugent, Mercedes de Onis, Komal Bhatia, Kamilla Eriksen, Gretchen Stevens, and Yves Martin-Prevel
Technical Note 11 Countries in the SUN Movement Assess Their Own Progress within Government-Led Multistakeholder Platforms, SUN Secretariat
Technical Note 12 Vitamin and Mineral Status Worldwide: What We Know and the Challenges Ahead, Luz Maria De-Regil
Nutrition for Growth tracking tables
Country Progress: Nutrition for Growth Tracking Table
Business Progress: Nutrition for Growth Tracking Table
Civil Society Organization Progress: Nutrition for Growth Tracking Table
Donor Noninancial Progress: Nutrition for Growth Tracking Table
Other Organizations Progress: Nutrition for Growth Tracking Table
UN Progress: Nutrition for Growth Tracking Table
Extended versions of panels in this report
Data and visualization platform
ACKNOWLEDGMENTS
T
he Global Nutrition Report’s Independent Expert Group (IEG) would like to acknowledge the support and contributions of a large number of people and organizations who made the development and delivery of the 2014 report possible.We would like to thank the writing and data analysis team: Lawrence Haddad, Jessica Fanzo, Kamilla Eriksen, and Komal Bhatia, with help from Julia Krasevec. We also thank the Report Secretariat, based at the Institute of Development Studies (IDS) and coordinated by Tara Shyam.
The IEG is grateful to the International Food Policy Re-search Institute’s Director General Shenggen Fan and Director of Communications and Knowledge Management (CKM) Gwendolyn Stansbury, as well as to CKM team members Tamar Abrams, Melanie Allen, Luz Marina Alvare, Mulugeta Bayeh, Terra Carter, Heidi Fritschel, Simone Hill-Lee, Andrew Marble, Andrea Pedolsky, David Popham, Nilam Prasai, Ghada Shields, Julia Vivalo, and John Whitehead. We also greatly ap-preciate administrative support from Lynette Aspillera, David Governey, and Catherine Gee.
We thank the following people for help with data methods and data access: Allison Pepper (Flour Fortiication Initiative) for data access; Ann Biddlecom (United Nations Population Division) for information on the unmet need for family plan-ning; Anne Peniston, Richard Greene, Elizabeth Jordan-Bell, and Robbin Boyer (US Agency for International Development [USAID]) for data clariications; Bingxin Yu (IFPRI) for SPEED data; Carlo Caiero and Piero Conforti (Food and Agriculture Organization of the United Nations [FAO]) for access to the overaquisition data; Caryn Bredenkamp and Leander Buisman (World Bank) for stunting trends by wealth quintile data; Leslie Elder and Andrea Spray (World Bank) for data clariications; Erin McLean (Government of Canada) for data clariications; David Clark (UNICEF) for the latest data on the International Code of Marketing of Breast-milk Substitutes; Liliana Carvajal (UNICEF) for information on zinc treatment for diarrhea; Holly Newby, Julia Krasevec, Arachana Dwivedi, and David Clark (UNICEF) for help on data access and data interpretation; Jere Behrman (University of Pennsylvania) for advice on the latest literature on the economic returns to nutrition; John Hoddinott (IFPRI) for new beneit-cost projections; Juan Feng (World Bank) for deinitions of poverty indicators; Lisa Smith (TANGO Interna-tional) for advice on models and access to some data on basic and underlying determinants; Manos Antoninis (United Nations Educational, Scientiic, and Cultural Organization [UNESCO]) for advice on women’s secondary education indicators; Matthew Greenslade (UK Department for International Development [DFID]) for advice on social protection data; Mercedes de Onis,
Monika Blössner, and Elaine Borghi (World Health Organization [WHO]) for support with data access and guidance on methods; Scaling Up Nutrition (SUN) focal points and in-country partners for conducting the self-assessment exercises on SUN country institutional transformation and the MDF team (Irma Alpenid-ze, Mike Zuyderduyn, and Ingrid Oomes) and SUN Movement Secretariat team (Patrizia Fracassi, Shaoyu Lin, Martin Gallagher, Kwame Akoto-Danso, Pau Blanquer, Delphine Babin-Pelliard, and Fanny Granchamp) for collating and analyzing the data; Rajith Lakshman, Maria Fe Celi Reyna, and Woody Wong Espejo (IDS) for work on the development policy document review; Rolf Luyendijk (UNICEF) for data and advice on water, sanita-tion, and hygiene; and Dolf te Lintelo (IDS), Gretchen Stevens (WHO), Jose Luiz Alvares Moran (Coverage Monitoring Net-work, Action Against Hunger), and Luz Maria De-Regil (Micro-nutrient Initiative) for being part of the report’s Data Access Group.
We also acknowledge support for the development of the panels (beyond authorship) featured in this year’s report from Jennifer Requejo, Lina Mahy and the UN Standing Committee on Nutrition, Pau Blanquer, Patrizia Fracassi, Rachel Nugent, Endang Achadi, Steve Wiggins, Mercedes de Onis, and Clara Picanyol.
For facilitating the tracking of Nutrition for Growth commit-ments, we thank Anna Taylor, Tanya Green, and Rob Hughes (DFID); Delphine Babin Pelliard, Kwame Akoto-Danso, Martin Gallagher, Patrizia Fracassi, Pau Blanquer, and Fanny Gran-champ (SUN Movement Secretariat); Jessica Meeker and Kat Pittore (IDS); Jonathan Tench (SUN Business Network); and Lina Mahy (UN Standing Committee on Nutrition).
Nations; Glen Tarman, Sabrina de Souza, and Sandra Mutuma (Action Against Hunger UK, Generation Nutrition); Stuart Gillespie (IFPRI); Marc van Ameringen and Jonathan Tench (Global Alli-ance for Improved Nutrition [GAIN] and SUN Business Network); Aslam Shaheen and Qadir Baloch (Harvest Plus Pakistan); Mags Gaynor (Irish Aid); Iris Bollemeijer (International Medical Corps); David Nabarro (SUN Movement Secretariat); Nicholas Nisbett (IDS); Kathryn Russell and Anupama Dathan (ONE Campaign); Robert Hecht, Arathi Rao, Tae Min Kim, and Aparna Kamath (Results for Development); Marie Rumsby (Save the Children UK, Road to Rio Group); Marie Ruel (IFPRI); Alexendre Ghelew (Swiss Development Cooperation); Syngenta; Hannah Schellander and James Jansen (UK Department for Environment, Food, and Rural Affairs); Anna Taylor and Rob Hughes (DFID); Werner Schultink, Yarlini Balarajan, and France Begin (UNICEF); Lina Mahy (UN Standing Committee on Nutrition); Anne Peniston (USAID); Veronique LaGrange and Dacia Whitsett-Morrow (US Dairy Export Council); Yael Velleman (WaterAid); Leslie Elder and Juan Feng (World Bank); Martin Bloem, Lynnda Kiess, Saskia Depee, and Natalie Rae Aldern (World Food Programme [WFP]); and Francesco Branca (WHO).
We are also grateful to Alan Dangour (London School of Hygiene and Tropical Medicine), Anna Taylor (DFID), and Jo Lofthouse (CIFF) for their early and continued encouragement; to Peter Godwin and Sujaya Misra for comments and ideas on the accountability and legitimacy framework; and to those who provided their feedback and ideas during the development of the concept note for the Global Nutrition Report in early 2014.
The IEG would like to thank the report’s Stakeholder Group for its engagement throughout the development of the report: cochairs Edith Mkawa (Permanent Secretary, Ofice of the President, Malawi, SUN Focal Point) and Jane Edmonson (DFID), Abdoulaye Ka (Cellule de lutte contre la malnutrition [CLM], Senegal), Anna Lartey (FAO), Chris Osa Isokpunwu (SUN Focal Point, Nigeria), David Nabarro (United Nations Secretary- General’s ofice, SUN), Ferew Lemma (Ethiopia), Francesco Bran-ca (WHO), Jésus Búlux (Secretaría de Seguridad Alimentaria y Nutricional de la Presidencia de la República [SESAN], Guatema-la), Martin Bloem (WFP), Nina Sardjunani (Bappenas, Indonesia), Jean-Pierre Halkin (European Commission, SUN Donor Network), Jennifer Goosen (Government of Canada, SUN Donor Network), John Cordaro (Mars, SUN Business Network), Kate Houston (Cargill, SUN Business Network), Lucy Sullivan and Jennifer Rigg (1,000 Days, SUN CSO Network), M. Aslam Shaheen (Pakistan), Marc Van Ameringen (GAIN, SUN Business Network), Michael Anderson (CIFF), Milton Rondo (Brazil), Shawn Baker (Bill & Melinda Gates Foundation, SUN Donor Network), Tom Arnold (Concern Worldwide, SUN CSO Network), and Werner Schultink (UNICEF).
Finally, we would also like to acknowledge the organiza-tions that provided inancial support for the 2014 report: 1,000 Days, the Bill & Melinda Gates Foundation, the CGIAR Research Program on Agriculture for Nutrition and Health, the Children’s Investment Fund Foundation, the European Commission, the Government of Canada, Irish Aid, and the UK Department for International Development.
ABBREVIATIONS
AARI average annual rate of increase
AARR average annual rate of reduction
BMI body mass index
CAADP Comprehensive Africa Agriculture Development Programme
CSO civil society organization
DHS Demographic and Health Survey
FAO Food and Agriculture Organization of the United Nations
HANCI Hunger and Nutrition Commitment Index
MAD minimum acceptable diet
MAM moderate acute malnutrition
MDD minimum dietary diversity
MICS Multiple Indicator Cluster Survey
NCD noncommunicable disease
NEPAD New Partnership for Africa’s Development
NGO nongovernmental organization
PPP purchasing power parity
SAM severe acute malnutrition
SDG Sustainable Development Goal
SUN Scaling Up Nutrition
UNICEF United Nations Children’s Fund
WHA World Health Assembly
WHO World Health Organization
G
OOD NUTRITION IS THE BEDROCK OF HUMAN WELL-BEING. BEFORE BIRTH AND
THROUGHOUT INFANCY, GOOD NUTRITION ALLOWS BRAIN FUNCTIONING TO
evolve without impairment and immune systems to develop more robustly.
For
young children, good nutrition status averts death and equips the body to grow and
develop to its full potential. Over the course of the human lifespan, it leads to more
effective learning at school, better-nourished mothers who give birth to better-nourished
children, and adults who are likelier to be productive and earn higher wages. In middle
age, it gives people metabolisms that are better prepared to ward off the diseases
asso-ciated with changes in diet and physical activity. Without good nutrition, people’s lives
and livelihoods are built on quicksand.
1. People with good nutrition are key to sustainable development.
• Malnutrition affects nearly every country in the world.
• More nutrition indicators need to be embedded within the Sustainable Development Goal accountability framework. 2. We need to commit to improving nutrition faster and build this goal into the Sustainable Development
Goal targets for 2030.
• The 2030 Sustainable Development Goal targets should be more ambitious than simple extensions of the 2025 World Health Assembly targets. A new consensus about what is possible needs to be established.
3. The world is currently not on course to meet the global nutrition targets set by the World Health As-sembly, but many countries are making good progress in the target indicators.
• More high-quality case studies are needed to understand why progress has or has not been made. 4. Dealing with different, overlapping forms of malnutrition is the “new normal.”
• Nutrition resources and expertise need to be better aligned toward the evolving nature of malnutrition. 5. We need to extend coverage of nutrition-specific programs to more of the people who need them.
• More attention needs to be given to coverage data—an important way of assessing presence on the ground where it counts.
6. A greater share of investments to improve the underlying determinants of nutrition should be de-signed to have a larger impact on nutritional outcomes.
• We need to keep tracking the proportion of nutrition resources to these approaches.
• We must also provide more guidance on how to design and implement these approaches to improve their effec-tiveness and reach.
7. More must be done to hold donors, countries, and agencies accountable for meeting their commit-ments to improve nutrition.
• Stakeholders should work to develop, pilot, and evaluate new accountability mechanisms. Civil society efforts to increase accountability need support.
• We need to develop targets or norms for spending on nutrition.
8. Tracking spending on nutrition is currently challenging, making it difficult to hold responsible parties accountable.
• Efforts to track financial resources need to be intensified—for all nutrition stakeholders. 9. Nutrition needs a data revolution.
• Of the many information gaps, the ones that most need to be filled are those that constrain priority action and impede accountability.
10. National nutrition champions need to be recognized, supported, and expanded in number.
• We must fill frontline vacancies, support nutrition leadership programs, and design country-led research programs.
xiii
EXECUTIVE SUMMARY
Good nutrition is also central to the sustainable develop-ment agenda that is taking shape in the form of the Sustainable Development Goals (SDGs) now under discussion. Inherently sustaining, good nutrition lows throughout the life cycle and across the generations. It promotes individual resilience in the face of shocks and uncertainties generated by climate change and extreme price luctuations. It supports the generation of in-novations needed to meet the joint challenge of improving the lives of current and future generations in ways that are environ-mentally sustainable.
This Global Nutrition Report is the irst in an annual series. It tracks worldwide progress in improving nutrition status, identi-ies bottlenecks to change, highlights opportunitidenti-ies for action, and contributes to strengthened nutrition accountability. The report series was created through a commitment of the signato-ries of the Nutrition for Growth Summit in 2013. It is supported by a wide-ranging group of stakeholders and delivered by an In-dependent Group of Experts in partnership with a large number of external contributors.
This report has a number of unique features. First, it is global in scope. Nearly every country in the world experiences some form of malnutrition, and no country can take good nutrition for granted. Second, because global goals require national action, the report aims to speak to policymakers, practitioners, scientists, and advocates in all countries. It assembles copi-ous country-level data and other information in an accessible manner and highlights the experiences of a large number of countries from Africa, Asia, Europe, Latin America and the Ca-ribbean, North America, and Oceania. Third, a key focus of the report concerns how to strengthen accountability in nutrition. Many of the core features of malnutrition—including its long-term effects, the need to work in alliances to counter it, and the invisibility of some of its manifestations—make account-ability challenging. We thus identify actions to strengthen key mechanisms, actors, and information in ways that will help hold all of us to account in our efforts to accelerate improvements in nutrition status. Finally, the report is delivered by an Indepen-dent Expert Group charged with providing a view of nutrition progress and an assessment of nutrition commitments that are as independent and evidence based as possible.
From the point of view of the authors, the report itself is an intervention against malnutrition: it is designed to help reframe malnutrition as a global challenge, to raise ambitions about how quickly it can be reduced, and to reenergize actions to reduce it. To accomplish this, we bring together a wide-ranging set of key indicators of nutrition status, actions, and resources for all 193 United Nations member states. We analyze these data in order both to assess worldwide progress in improving nutrition status and to locate individual country progress and experiences within the broader global and regional trends. In addition we provide an accountability mechanism for the commitments made by the 96 signatories of the Nutrition for Growth Summit, monitoring and assessing their self-reported progress against those public declarations of intent to act for nutrition.
KEY FINDINGS
The report offers a number of indings regarding the progress that has been made in improving nutrition status, scaling up nutrition action, meeting the commitments made by signatories to the Nutrition for Growth Compact, and reducing data gaps.
Progress in Improving Nutrition Status
1. IMPROVING PEOPLE’S NUTRITION STATUS IS CENTRAL TO ATTAINING SUSTAINABLE DEVELOPMENT. We summarize ev-idence to show that improvements in nutrition status will make large contributions to SDGs on poverty, food, health, education, gender, and employment. We also show that investments in nutrition have high returns. We estimate new beneit-cost ratios for scaling up nutrition interven-tions in 40 countries. Across these 40 countries, the medi-an beneit-cost ratio is 16—memedi-aning that for every dollar, rupee, birr, or peso invested, at the median more than 16 will be returned. The beneit-cost ratios from investing in nutrition are highly competitive with investments in roads, irrigation, and health.
2. MALNUTRITION AFFECTS NEARLY EVERY COUNTRY. All countries in the world, bar two, that collect nutrition data experience one of the following forms of malnutrition: stunting, anemia, or adult overweight. If the anemia rates in the two outlier countries were just 0.6 percentage points higher, then all countries in the world with nutrition data would be classiied as experiencing one of these three forms of malnutrition.
3. ON A GLOBAL SCALE, THE WORLD IS NOT ON COURSE TO MEET THE GLOBAL NUTRITION TARGETS AGREED TO BY THE WORLD HEALTH ASSEMBLY (WHA). Under existing assump-tions, projections from the World Health Organization (WHO) and UNICEF show that the world is not on track to meet any of the six WHA nutrition targets. Globally, little progress is being made in decreasing rates for anemia, low birth weight, wasting in children under age ive, and over-weight in children under age ive. Progress in increasing exclusive breastfeeding rates has been similarly lackluster. More progress has been made in reducing stunting rates in children under ive, but not enough to meet the global target under current projections.
course. Out of 107 countries with data on overweight of children under age ive, 31 are on course. Finally—and of great concern—only 5 out of 185 countries with data on anemia are on course for anemia reduction. There is great potential to learn from country experiences, but it is not being exploited because of a lack of country case studies that examine the wide range of factors affecting progress.
5. THERE IS A BASIS FOR SETTING MORE CHALLENGING TAR-GETS FOR NUTRITION IMPROVEMENT. How is this inding consistent with a world that is off course for the WHA global targets? First, country-level variation suggests that there are plenty of examples of progress from which to draw inspiration and insight. Second, experiences from the Indian state of Maharashtra as well from Bangladesh, Bra-zil, and the United States suggest that signiicant change in nutrition status can happen over the medium term as a result of determined action sustained over a period of 6–12 years. If just a few large countries improved their performance, it would change the basis for earlier projec-tions of progress. Finally, for India—the second-most pop-ulous country in the world—new and preliminary national data suggest it is experiencing a much faster improvement in WHA indicators than currently assumed. For example, if the new preliminary estimates undergo no further signif-icant adjustments, then the numbers of stunted children under the age of ive in India has already declined by more than 10 million.
6. THE FACE OF MALNUTRITION IS CHANGING: COUNTRIES ARE FACING COMPLEX, OVERLAPPING, AND CONNECTED MALNUTRITION BURDENS. Most countries experience some combination of under-ive stunting, anemia in women of reproductive age, and adult overweight; fewer than 20 countries have only one of these forms of malnutrition. These different burdens are connected not only at a physi-ological level, but also at a resource and political level. Re-searchers and practitioners urgently need to develop tools and strategies to prioritize and sequence nutrition-relevant actions in these complex contexts. Given these multiple burdens and the trend toward decentralization of nutrition programming, disaggregated analyses of nutrition out-comes are more important than ever. This is a major data gap, though it may not exist in all countries.
Progress on Scaling Up Nutrition Action
7. COVERAGE OF NUTRITION-SPECIFIC INTERVENTIONS IS LOW. The lack of national coverage data for nutrition- speciic interventions relects the low coverage of the programs themselves. Of 12 key nutrition-speciic inter-ventions that have been identiied as crucial for reducing undernutrition, many countries have national coverage data for only 3 (vitamin A supplementation, zinc treatment for diarrhea, and universal salt iodization). Given the lack of progress on wasting rates, the lack of coverage data for programs to treat moderate and severe acute
malnu-trition (MAM and SAM) is a major concern. Geographic coverage is poor, even in countries with very large burdens of SAM. Direct coverage estimates are needed to properly assess people’s access to treatment for both MAM and SAM. Ways need to be found to get the best blend of rapid stand-alone surveys and periodic national surveys to estimate MAM and SAM coverage in a timely and credible way.
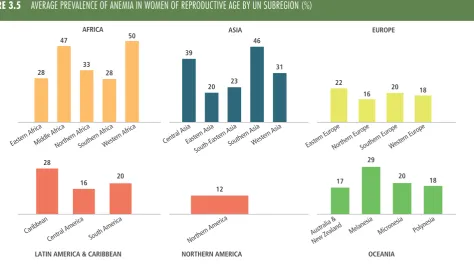
8. UNDERLYING DRIVERS OF NUTRITION STATUS ARE IMPROV-ING. Underlying drivers—such as food supply, clean water and sanitation, education, and health care—can contrib-ute a great deal to improving nutrition status. Estimates of undernourishment based on food supply are decreasing, but—with 805 million people below a minimum calorie threshold in 2012–2014—they are still high. Access to improved water and sanitation services is steadily im-proving, although large coverage gaps remain in Eastern, Western, and Middle Africa for water and in Southern and South-Eastern Asia and most regions of Africa for sanitation. Trends in female secondary education enroll-ment are positive for all regions, although the rate is still just 50 percent for Africa. Health services, though, are still lacking in Africa and Asia. Europe has the most physicians per 1,000 people (at 3.5) and Africa the least (0.5), while North America has the most nurses and midwives per 1,000 people (9.8) and Africa the least (1.3). Asia has two times as many community health workers per 1,000 peo-ple as Africa, but the numbers are low for both regions (1.4 compared with 0.7).
9. THE POTENTIAL FOR EXPANDING RESOURCES TO NUTRITION- SENSITIVE PROGRAMS IS CLEAR; THE QUESTION IS, HOW? Investments in nutrition-sensitive programs and approaches that address the underlying determinants of malnutrition can be important components of a portfolio of actions to improve nutrition status. We present data on government expenditures on the related sectors of agriculture, educa-tion, health, and social protection. Different governments make different choices about these sectors, and expendi-ture levels vary between regions and within regions. Social protection spending is increasing rapidly in many African and Asian countries, providing a major opportunity to scale up nutrition-sensitive actions. But evidence is limited on how to make interventions that address underlying determi-nants more nutrition sensitive. The report offers some ideas for agriculture; social protection; education; health; and water, sanitation, and hygiene.
10. COUNTRIES CANNOT CURRENTLY TRACK THEIR FINAN-CIAL COMMITMENTS TO NUTRITION. Several tools exist to accomplish this, and investments will need to be made to build the organizational capacity to do so. Guatemala pro-vides an inspiring case study. Spending by donors is some-what clearer than spending by countries. Between 2010 and 2012, commitments from 13 donors to nutrition- speciic interventions rose by 39 percent, and
ments rose by 30 percent. Nutrition-sensitive donor com-mitments declined by 14 percent, but nutrition-
sensitive disbursements for the 10 donors that reported data increased by 19 percent. The percentage of oficial development assistance disbursed to nutrition in 2012 was just above 1 percent. Donor reporting on nutrition is becoming more harmonized but has further to go owing to differences in deinitions and timing.
11. POLICIES, LAWS, AND INSTITUTIONS ARE IMPORTANT FOR SCALING UP NUTRITION. These elements of the policy envi-ronment can be measured. The Scaling Up Nutrition (SUN) process score approach is noteworthy for being a partic-ipatory measurement process that stimulates relection among stakeholders on how they can strengthen coordi-nated action on nutrition. Assessments of the strength of policies, laws, and institutions can point out disconnects, such as the coexistence of weak policy environments on di-abetes and populations with rates of raised blood glucose levels.
Monitoring the Nutrition for Growth Commitments
12. REPORTING ON THE 2013 NUTRITION FOR GROWTH (N4G) COMMITMENTS WAS CHALLENGING FOR ALL GROUPS OF SIGNATORIES. Valuable lessons were learned in this “base-line year.” Ninety percent of the signatories responded to requests for updates against their N4G commitments. Very few signatories were off course on their commitments, although there were many “not clear” assessments due to the vagueness of commitments made and of responses provided. In terms of progress against N4G targets, there were no obvious causes for concern from any group, at least at this early stage in the reporting period of 2013– 2020. The assessment will be strengthened in 2015 by more data, more streamlined processes, and, we suspect, participants that are more motivated given their under-standing of how their responses will be reported.
13. NUTRITION ACCOUNTABILITY CAN AND MUST BE BUILT. Civil society actors are particularly important in building accountability, although they need support to be most effective. National evaluation platforms and community feedback mechanisms are promising ways of strengthening nutrition accountability, but they need to be piloted and evaluated. National and international nutrition research programs that are driven by the problems of countries themselves are likely to improve accountability at the national level.
Reducing Data Gaps
14. THERE ARE MANY GAPS IN DATA ON NUTRITION OUTCOMES, PROGRAMS, AND RESOURCES. For example, for the four of six WHA indicators where rules exist to classify countries as “on course” or “off course,” only 60 percent of the 193 UN member countries have the data to assess whether their contribution levels are on or off course to meet the
global WHA targets. Ensuring all countries can report on the WHA indicators is a priority for governments and UN agencies. To identify data gaps beyond the WHA indica-tors, we posed the question: In what areas are data gaps leading us to fail to prioritize the issues that need to be prioritized and the actions that need to be taken to reduce malnutrition? We identiied three nutrition-status indica-tors—anemia, overweight/obesity, and low birth weight— where progress is slow and data gaps could be holding back action. We also identiied data gaps that we believe are holding back the scaling up and context-speciic blend-ing of nutrition-speciic, nutrition-sensitive, and enablblend-ing environment interventions. These gaps included data on countries’ capacity to implement and scale up nutrition actions, program costs, and inancial resource tracking. Many decisions about how to prioritize the illing of data gaps need to be undertaken at the national level, based on nutrition policies, plans, and strategies.
15. NOT ALL DATA GAPS NEED TO BE ADDRESSED BY COLLECT-ING NEW DATA. We identiied several ways of illing data gaps: (1) using existing data better, (2) strengthening exist-ing data collection quality, (3) improvexist-ing data comparability across countries, (4) collecting new data where there are not enough for good accountability, and (5) increasing the frequency of national nutrition survey data collection. Three to four key data gaps were identiied under each of these ive areas, and ways to begin illing these gaps were proposed. Many of these data gaps can be illed by invest-ing in the capacity of nutrition analysts, program manag-ers, and policy units to make better use of existing data.
WE CAN IMPROVE NUTRITION MORE RAPIDLY: STRONGER
ACCOUNTABILITY IS KEY
Almost all countries suffer from high levels of malnutrition. Countries should make a common cause and exploit opportu-nities to learn from each other. It is clear that the low-income countries do not have a monopoly on malnutrition problems and that the high-income countries do not have a monopoly on nutrition solutions.
Failure to intensify action and ind solutions will cast a long shadow, bequeathing a painful legacy to the next generation. Our generation has the opportunity—and the ability—to banish those shadows. To do so, we must act strategically, effectively, in alliances, and at scale. And we need to be held to account.
1
KEY
POINTS
INTRODUCTION
T
HE CHALLENGE OF IMPROVING NUTRITIONAL STATUS IS A QUINTESSENTIALLY
21ST-CENTURY ENDEAVOR. IT IS A CHALLENGE THAT RESONATES THE WORLD OVER:
nearly every country in the world experiences a level of malnutrition that constitutes
a serious public health risk. Between 2 and 3 billion people are malnourished—they
experience some form of undernutrition, are overweight or obese, or have some sort
of micr
onutrient deficiency.
1The faces of poor nutrition are many: from children living under famine conditions
who appear to be made of skin and bone, to adults who have trouble breathing
owing to obesity, to infants who do not live to see their first birthday as a result of a
combination of poor diets, poor infant feeding practices, and exposure to infectious
disease.
It is a challenge that requires effective action across a number of sectors and areas
(food, health, social welfare, education, water, sanitation, and women) and across
a number of actors (government, civil society, business, research, and international
development partners). Strong alliances for action are much more effective than silver
bullets, and the multiple causes of malnutrition often represent multiple opportunities
to improve nutrition in a sustainable way.
Lastly, poor nutrition is a challenge that casts a long shadow: its consequences flow
throughout the life cycle and cascade down the generations affecting everyone—
especially children, adolescent girls, and women—and include mortality, infection,
cognitive impairment, lower work productivity, early onset and higher risk of
noncom-municable diseases (NCDs), stigma, and depression.
1. The challenge of improving nutrition shares many characteristics with other 21st-century develop-ment challenges: global prevalence, long-term consequences, and the need to work through broad alliances of sectors and actors.
2. Improvements in nutrition status will be central to the sustainable development agenda: nutrition improvements are inherently sustaining throughout the life cycle and across generations, and they contribute directly to most of the proposed Sustainable Development Goals.
3. The features of nutrition outcomes and actions—their short- and long-term effects, the invisibility of some consequences of malnutrition, and the need for alliances—make the process of identifying commitments, and then monitoring them for accountability, more complex than for many other development issues.
4. This report is one contribution to strengthening accountability in nutrition.
ACTIONS & ACCOUNTABILITY TO ACCELERATE THE WORLD’S PROGRESS ON NUTRITION 3
NUTRITION IS CENTRAL TO SUSTAINABLE DEVELOPMENT
These features of nutrition—its global prevalence, the need to improve it through broad alliances of sectors, and its short- and long-term consequences—also define other current develop-ment challenges: achieving equity, facilitating demographic transitions to lower mortality and fertility levels, and addressing climate change and its implications for vulnerability, sustainable food systems, and natural resource use. The process of improv-ing nutrition outcomes has a kinship with these issues and is central to the sustainable development agenda in at least two ways. First, nutrition improvements are inherently sustaining over time. Investments in the first 1,000 days of a person’s life yield benefits throughout that person’s life cycle and across generations.2 Second, improvements in nutritional status will
drive many sustainable development outcomes—directly and in-directly. As Chapter 2 will show, improved nutrition contributes to most of the Sustainable Development Goals (SDGs) proposed by the UN’s Open Working Group. It is clear that improvements in nutrition can help drive the SDG agenda.
THE NEED TO STRENGTHEN NUTRITION ACCOUNTABILITY
While these aspects of nutrition make it central to sustainable development, they also make it difficult to hold key stakehold-ers accountable for their actions to improve it. How do individ-uals make claims on those responsible for improving nutrition if they cannot identify those responsible, cannot identify their duties, and cannot track whether they are fulfilling those responsibilities? Similarly those responsible for nutrition- improving actions will have trouble tracking the progress of their own efforts if tracking and feedback mechanisms are weak. The large number of actors, the long-term benefits to action, and the invisibility of some consequences of malnutri-tion all work against strong accountability. Without nutrimalnutri-tion accountability, there is no guide to action and no consequence to inaction and indifference—other than to the 2 to 3 billion people directly affected.Our knowledge of which actions can improve nutrition sta-tus has never been greater. For undernutrition, we can call on a set of proven, specific interventions and a set of much larger nutrition-sensitive investments that have enormous untapped potential. For overweight and obesity, the evidence base is weaker but getting stronger. Evidence suggests that addressing undernutrition also mitigates some of the risk factors associated with noncommunicable diseases later in life. In the absence of data, issues remain of how to sequence and prioritize actions and how to assess whether the actions are making a difference at the meso and macro levels.
AIMS OF THIS REPORT
This report represents a new contribution to strengthen the ability of policymakers, program implementers, civil society advocates, investors, communities, and families to monitor their society’s progress in improving nutrition. The aim of the report is to help these groups hold themselves, and others, to account
for their actions or inaction in improving nutrition. In so doing, the report seeks to support the SDG accountability infrastruc-ture and to serve as a spur to improved resource allocation and to intensified action and demand for good nutrition.
The key audiences are current “nutrition champions” and their current and future allies (Table 1.1). Nutrition champions are organizations and individuals, operating in the spotlight or behind the scenes, who consistently strive to accelerate improvements in nutrition outcomes. Their allies are those who work with the champions because they have an interest in investing in nutrition, typically to further another goal—in conjunction with, or because of, efforts to improve nutrition. Future champions are those whom we need to inspire and support, who are starting out in their nutrition careers, or who are discovering nutrition. Future allies are those who have vested interests in nutrition but may not yet realize it. They are the economists searching for new sources of growth; the social planners looking for new ways of reaching the most vulnerable; the agriculturalists seeking to maximize the human impacts of farm technologies, practices, and market innovations; and the water, sanitation, and hygiene specialists looking to maximize the health benefits of their work. Reaching and motivating these strategic partners will lead to new dialogues and should identify new opportunities for investments that lead to improve-ments in nutrition.
The report was originally called for by the signatories of the Nutrition for Growth (N4G) Summit Compact in 2013 in recog-nition of the need to better monitor commitments to improving nutrition. As such, the report is a collective endeavor of a set of N4G stakeholders who care deeply about improving nutrition as a spur to sustainable development.
The Stakeholder Group has empowered an Independent Ex-pert Group to bring together existing and new nutrition data to provide a more complete picture of country and global nutrition indicators, strengthen accountability, generate fresh insights, start new conversations, and catalyze new actions.
These two groups, like many others, recognize that although the political commitment to improve nutrition is currently high, it is not permanent. Development trends come and go. This report aims to be a legacy of current high levels of commitment and to help stimulate future waves of commit-ment to nutrition long after the current wave has dissipated.
CONCEPTUAL FRAMEWORK
Throughout the report we focus on the need for action on a broad number of fronts if nutrition status is to improve rapidly and sustainably. We use case studies from Bangladesh, Brazil, Burkina Faso, Indonesia, the Indian state of Maharashtra, the United States, and the United Kingdom to show what can be accomplished when action occurs in different sectors. Case studies in this report and elsewhere show that there is no magic recipe for multisectoral action (Garrett and Natalicchio 2011). Nutrition-specific and nutrition-sensitive programs, together with changes in the underlying determinants and the enabling environment, all have important roles to play. When they come together in a virtuous circle, they can lead to significant improvements in people’s nutrition status. It is vital that national leaders and the nutrition community have a strong vision for the nutrition goals they want to meet and a focused plan for how to do it. But the focused plan needs to be open to all possible actions and combinations of actions.
The report uses a simple accountability framework to guide its work. The framework is based on recent publications on nutrition accountability (Kraak et al. 2014; te Lintelo 2014). The
accountability cycle involves identifying commitments, track-ing progress against commitments, determintrack-ing accountability (were commitments met?), understanding how the account-ability information is being used (for example, to leverage new commitments), and describing how various actors respond to the assessment of accountability. Data and associated capacity gaps that are barriers to needed action are highlighted at the end of each chapter.3
The conceptual framework is summarized in Figure 1.1.
THE REPORT—FROM DOCUMENT TO INTERVENTION
The stakeholder analysis4 that was conducted to shape the
pur-pose and content of the report concluded that it should do four things above all others: (1) be an active intervention rather than merely a report; (2) constantly seek to support nutrition champi-ons and their allies at the national level; (3) focus on all forms of malnutrition, not just undernutrition, and (4) support the efforts of other nutrition reporting processes rather than duplicating or competing with them.
PANEL 1.1
TYPES OF NUTRITION INVESTMENT
LAWRENCE HADDAD
B
ecause a person’s nutrition status dependson a range of immediate, underlying, and basic determinants and their interactions, nutrition investments may take various forms to address these determinants.
Nutrition-specific programs address
the immediate determinants of nutrition sta-tus (such as inadequate diet and disease bur-den) and are found in a range of policy areas, such as health, humanitarian relief, and food
processing.1
Nutrition-sensitive programs and
approaches address the underlying deter-minants of nutrition status (such as food
security, health access, healthy household environment, and care practices) and are found in a wide range of policy areas (such as agriculture; education; water, sanitation, and hygiene; social protection; women’s empowerment; and health). They incorporate explicit nutritional goals or actions, although improved nutrition is not necessarily their pri-mary goal.
Enabling-environment investments
address the basic determinants of nutrition status such as governance, income, and equity. These investments take the form of laws, regulations, policies, investments in economic
growth, and improvements in governance capacity.
Most investments in actions to address the underlying and basic determinants of nutrition status are not nutrition sensitive—in other words they do not incorporate explicit nutritional goals or actions—but they can be important drivers of nutrition improvement.
Efforts to improve nutritional status can come from all three areas. The aim should be to ind the most potent blend of them, at scale, given the need, capacities, and political opportunities in each context.
TABLE 1.1
AUDIENCES FOR THIS REPORT: INDIVIDUALS, ORGANIZATIONS, AND NETWORKS
Champions Allies
Current Focused on improving nutrition outcomes
Willing and able to work with those outside nutrition to further nutrition status
Willing and able to exhibit leadership on nutrition
Already work with nutrition champions in win-win partnerships to further their own sectoral goals through increased attention to nutrition
Future Next generation of nutrition leaders Some current allies
Those who have a vested interest in improved nutrition status but who may not be fully aware of that
ACTIONS & ACCOUNTABILITY TO ACCELERATE THE WORLD’S PROGRESS ON NUTRITION 5
The report as an intervention
The goal of this report is to help better monitor progress on a range of nutrition status indicators, programs, determinants, policies, laws, and resources. The aim is to strengthen nutrition accountability and contribute to faster improvements in nutri-tion status. By identifying commitments, tracking them, and assessing whether they are met, the report should stimulate and intensify action. Because Global Nutrition Reports will be issued annually, stakeholders will be better able to learn who is and is not meeting commitments and to help them better meet these commitments in the future.
A focus on stakeholders at the national level
Arguably, the global commitment to nutrition is stronger than it has ever been. The food price spikes of 2007–2008 focused global attention on the long-term consequences of widespread shocks. The Lancet published two series of papers on maternal and child undernutrition in 2008 and 2013, bringing together what we know about the distribution and consequences of
malnutrition and what works to promote good nutrition. The Scaling Up Nutrition (SUN) Movement, initiated in 2010, has more than 50 country or state-level members and has been instrumental in stimulating and sustaining commitment to nu-trition. Progress in improving micronutrient deficiencies is slow but has received renewed global attention (such as in the 2014 Global Hunger Index [von Grebmer et al. 2014]). The signatories to the N4G Compact in London in 2013 pledged more than US$4 billion in extra financing for undernutrition reduction until 2020. Overweight and obesity, which affect between a third and a half of adults in high-income countries, are also rising up the global agenda (Ng et al. 2014; Popkin 2009; Keats and Wiggins 2014).
Global interest in malnutrition is increasingly reflected at the national level and generated by challenges experienced at that level. But without national-level progress, global interest will be difficult to sustain. This progress at the national level will depend on national champions who lead the way in pushing nutrition up the development agenda, building alliances across
FIGURE 1.1
CONCEPTUAL FRAMEWORK OF THIS REPORT
IDENTIFY
COMMITMENTS TRACK PROGRESS AGAINST
COMMITMENTS
DETERMINE WHETHER COMMITMENTS WERE MET
LEVERAGE INFORMATION ON ACCOUNTABILITY TO PUSH FOR NEW COMMITMENTS DESCRIBE
RESPONSE TO ACCOUNTABILITY
1
2
3
4
5
Country-driven combinations of nutrition-specific and nutrition-senstive programs and approaches, supported by trends in areas and sectors related to nutrition such as food, health, social welfare, education, water, sanitation, hygiene, and gender
Identify key data and capacity gaps Enabling environment for nutrition improvement
Progress in improving nutrition status Benefits of improved nutrition status
sectors and between central and local governments, delivering services, and documenting what works and what does not. This report—by offering access to country-specific data and analyses, showcasing national efforts, and directly connecting to a wide range of national champions—seeks to support the work of national champions in every country.
One key tool produced in conjunction with this report is a set of nutrition country profiles—one for each of the 193 mem-ber states of the United Nations. These profiles, which showcase the global scope of the report, are available at www .global nutritionreport.org. Each two-page profile contains 84 indica-tors in categories that are consistent with the different sections of the report.5
A focus on all forms of malnutrition
The world is experiencing an overweight and obesity pan-demic. At the same time the burden of disease in low- and middle-income countries is shifting rapidly from communicable to noncommunicable diseases (Lim et al. 2012). Micronutrient deficiencies remain a concern; anemia rates, for example, have not changed appreciably for more than 20 years and neither have wasting rates (WHO 2014a).
Virtually no country is free of malnutrition, and many fami-lies, communities, and countries struggle with all of these forms of malnutrition at the same time. Moreover, the various forms of malnutrition are connected physiologically, politically, and financially. Just as families must deal with them simultaneously, so too must policy and programming. The report outlines the overlaps in malnutrition burdens at the country level.
A report that complements rather than competes with others
It has taken the nutrition community almost 30 years to come together and work across national and institutional boundaries. This report seeks to highlight the excellent work done by the
dozens of organizations that have shared country-level data with us and to complement their work by bringing it together with the work of others. In so doing, we hope to generate new insights and identify gaps that need to be filled. New reports will be published in 2015 and in 2016 to help maintain the pressure for effective action on nutrition, to guide action, and to hold actors to account.
STRUCTURE OF THE REPORT
The report is organized as follows. Drawing on new analyses, Chapter 2 highlights the returns to improved nutrition status and explores the extent of improvements that are possible by 2025. Chapter 3 describes changes in nutrition status outcomes, assesses global progress on meeting the World Health Assembly targets, and looks at country progress in the WHA indicators. Chapter 4 describes how countries are experiencing multiple forms of malnutrition and examines some critical subnational patterns. Chapter 5 reports on the covera