in PROBABILITY
THE ALDOUS-SHIELDS MODEL REVISITED
WITH APPLICATION TO CELLULAR AGEING
KATHARINA BEST
Albert-Ludwigs Universität, Abteilung Mathematische Stochastik, Eckerstr. 1, D–79104 Freiburg
email: [email protected]
PETER PFAFFELHUBER
Albert-Ludwigs Universität, Abteilung Mathematische Stochastik, Eckerstr. 1, D–79104 Freiburg
email: [email protected]
SubmittedApril 9, 2010, accepted in final formSeptember 30, 2010 AMS 2000 Subject classification: 60K35, 92D20, 60J85, 05C05
Keywords: Random tree, cellular senescence, telomere, Hayflick limit
Abstract
In Aldous and Shields (1988) a model for a rooted, growing random binary tree with edge lengths 1 was presented. For somec>0, an external vertex splits at rate c−i (and becomes internal) if its distance from the root (depth) isi. We reanalyse the tree profile forc>1, i.e. the numbers of external vertices in depthi =1, 2, .... Our main result are concrete formulas for the expectation and covariance-structure of the profile. In addition, we present the application of the model to cellular ageing. Here, we say that nodes in depthh+1 are senescent, i.e. do not split. We obtain a limit result for the proportion of non-senesced vertices for largeh.
1
Introduction
Trees arise in several applied sciences: In linguistics and biology, trees describe the relationship of items (languages, species) and in computer science, trees are used as data structures, e.g. for sorting. Randomizing the input leads to random trees, which are subject of a large body of research. For applications in biology, see e.g.[6, 14]. Here, important examples are trees arising from branching processes (e.g. Yule trees). In computer science, prominent examples are search trees; see e.g.[18, 10].
In this note, we are concerned with an application of random trees to cellular biology. In the 1960s it was known that eukaryotic cells have a limited replication capacity ([16]). The number of generations until cells do not proliferate any more is today known as theHayflick limitand the phenomenon that cells lose their ability to proliferate is calledcellular senescence. The molecular bases for cellular senescence were uncovered starting in the 1970s. During each round of repli-cation, thetelomeres(which are the end part of each chromosome) are shortened due to physical
476 2 MODEL AND RESULTS
constraints of the DNA copying mechanism[20]. In humans, these telomeres are a multiple (i.e. more than 1000-fold) repetition of the base pairs TTAGGG and up to 200 bases are lost in each replication round [17]. Most importantly, telomeres have a stabilizing effect on the DNA. The
DNA repair mechanismof a cell must be able to distinguish between usual DNA breaks (which it is assumed to repair) and the telomeres (which it is assumed to ignore). Hence, when telomeres become shorter this stabilizing effect seizes and ageing occurs. In human cells, telomeres shrink from 15 kilobases at birth to less than 5 kilobases during a lifetime[24]. However, the enzyme
telomerase can decrease the loss of telomeres during replication. This enzyme is active in stem cells and cancer cells, which both are cell types with an (almost) unbounded replication potential. The deeper understanding of the role of telomeres and telomerase is an active field of research because of the medical implications for ageing and cancer. In particular, it was awarded the Nobel prize in medicine in 2009[25].
We study the model of random trees introduced in Aldous and Shields in[1](hereafter referred to as[AS]) and extend it for an application to cellular ageing. Given somec>0 and a full binary tree T, the model introduced in [AS] describes the evolution of the vertices of the tree. Here,
we distinguish internalandexternalvertices. At t=0, the root is the only external vertex (and there are no internal vertices). An external vertexu∈Tin depth|u|becomes internal at ratec−|u|.
At the time it becomes internal, the two daughter vertices in depth|u|+1 become external. We present our results on the Aldous-Shields model in Theorem 1.
For our application to cellular senescence, we will analyze a relative of the Aldous-Shields model forc>1. Here, a critical depthhis fixed, and only external vertices in depth at mosthcan become internal. External vertices in depthh+1 never become internal. Hereby, external vertices can be thought of as cells. The depth of a vertex is the number of generations from the first cell. Vertices in depth at mosthrepresent proliferating cells, because they are able to produce offspring (i.e. daughter cells). Vertices in depth h+1 represent senescent cells. This model has two features, which appear to be realistic in cellular senescence. First, the rate of cell proliferation decreases with the generation of a cell, parameterized byc>1. Second, cells which have already split too often lose their ability to proliferate at all. For this model, we obtain a limit result for the frequency of proliferating cells in Theorem 2.
The paper is organized as follows: In Section 2, we state our results on the Aldous-Shields model. The application to cellular senescence is carried out in Section 3, where we also give an overview of other models for cellular senescence in the literature. Section 4 contains the proofs for our results on the Aldous-Shields model (Theorem 1), and in Section 5, we give proofs for the results on the model of cellular ageing (Theorem 2).
2
Model and results
We start by introducing some notation. LetTbe the complete binary tree, given through
T=
∞
[
n=0
Tn
and
We refer to elements inTbyverticesand identifyu∈Tnby a word of lengthnover the alphabet
{0, 1}, whoseith letter isui,n≥1. The vertex;is the root of the tree and vertexu∈Thas two
daughter vertices,u0 andu1. (We make the convention that;0 :=0,;1 :=1.) Foru∈Twe set
|u|=niffu∈Tn.
We say thatuis an ancestor ofvif|u|<|v|and there arei1, ...,i|v|−|u|∈ {0, 1}withv=ui1· · ·i|v|−|u|. This induces a partial order onTif we writeu≺viffuis ancestor ofv.
Definition 2.1 (Aldous-Shields model). Fix c > 0. The (time-continuous)Aldous-Shields model
with parameter c is a a Markov jump processY = (Y(t))t≥0, Y(t) = (Yu(t))u∈T with state space {0, 1}T
, starting in Y(0) = (1
u=;)u∈T. Given Y(t) = y∈ {0, 1}
T
and u∈Twith y
u=1, it jumps to
(eyv)v∈T, given by
eyv=
0, v=u,
1, v=u0or v=u1,
yv, else, at rate c−|u|. In this case, we say that vertex u splits.
Remark 2.2 (Internal and external vertices). Let Y = (Y(t))t≥0 be the Aldous-Shields model andY = Y(t)for some t ≥0. It is important to note that the dynamics is such that any path
;,i1,i1i2, ...∈Twithi
1,i2, ...∈ {0, 1}, starting at the root, has exactly one elementuwithYu=1.
In particular, the sets
{u: there isvwithu≺vandYv=1} of internal vertices and
{u:Yu=1} of external vertices are disjoint.
Definition 2.3 (Profile). LetY = (Y(t))t≥0 be the Aldous-Shields model and Y =Y(t)for some t≥0. We define
Xn:=
X
u∈Tn
Yu, Xbn:=2−nXn, (2.1)
thetotal number of external verticesand therelative proportion of external verticesin depth n, respectively. The vector(Xn)n=0,1,2,...is also called theprofileand
X= ∞
X
n=0 Xn
is thetotal number of external vertices.
Remark 2.4(Dependence onc). The behaviour of the Aldous-Shields model strongly depends on
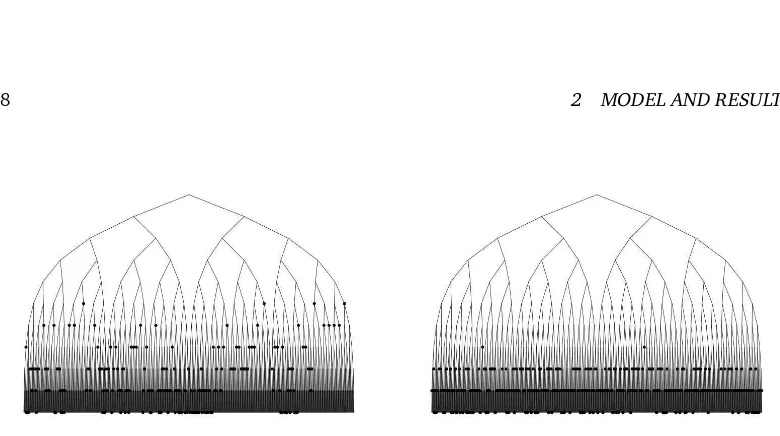
c: A largercimplies the profile being more concentrated around certain depths. The reason is that the difference in the splitting rate between external vertices at different depths is increasing inc. Therefore, external vertices in smaller depth can easily catch up with external vertices in larger depth for largec. See Figure 1 for an illustration.
Two values ofcare of particular importance in applications from computer science: forc=1, and ifX =n, the set of external vertices is a binary search tree withnexternal vertices. Forc=2 and
478 2 MODEL AND RESULTS
Figure 1: Two realizations of the Aldous-Shields model at the time when 500 vertices are external for c = 1.05 (A) and c = 3 (B). Only depths 0, ..., 10 are drawn and the external vertices are marked.
Remark 2.5(Relative frequencies). We observe that ∞
X
n=0
b
Xn(t) =1 (2.2)
for allt, almost surely. To see this, note thatXb0(0) =1 andXbn(0) =0 forn>0, i.e. (2.2) holds
at t =0. Additionally, assume that some uwith |u|= nsplits at time t. Then, we have that
b
Xn(t)−Xbn(t−) = −2−n andXbn+1(t)−Xbn+1(t−) = 2·2−(n+1) =2−n. In particular, every split
leavesP∞n=0Xbnunchanged which shows (2.2).
Remark 2.6 (Notation). In our results, we will give asymptotics of moments ofXn+i(t cn)for
large n. Generally, for two sequences (xn)n=1,2,... and(yn)n=1,2,..., which may depend on other
parameters, we write
xnn→∞≈ yn ⇐⇒ lim
n→∞
xn yn
=1.
In our exposition, several products appear. Throughout, we take the convention that an empty product equals 1.
Theorem 1(Moments of the profile and their limits). Let c>1. Define for k∈Z
+
ak= (−1)k
ck
(c−1)· · ·(ck−1), bk:=
c1· · ·ck
(c−1)· · ·(ck−1) (2.3) and a0=b0=1. For k<0, we set ak=bk=0. Moreover,
b∞:= ∞
Y
l=1
Then, for t>0and i>−n,
Remark 2.7(Convergence and covariance). 1. It is immediate from the Theorem and the def-inition ofXbnthat limn→∞V[Xb
2. The covariances given in (2.5) show a phase transition atc=p2. Such a phase transition is already known from results by[AS]and[9]. However, these papers do not give explicit formulas for the covariance structure.
3. Using (4.4), (4.6) and (4.10) it is also possible to obtain exact results for the covariance on the left hand side of (2.5).
Remark 2.8 (Connection to results from Aldous and Shields (1988)). In[AS], the evolution of the vector(Xbn(t))n=0,1,2,...is studied. In their Theorems, a law of large numbers forXn(t)to some
deterministic limitxn(t)is stated and proved using martingale methods. Their result implies that (2.7) holds even almost surely on compact time intervals. In particular, they claim that the limit
xi(t)of Xbn+i(t cn) must satisfy xi(t) = xi+1(c t), which clearly holds for the right hand side of
(2.7). In addition, they show that a suitably rescaled process, 2n/2(Xbn+i(t)−xi(t))t≥0, converges
weakly to a diffusion forc>p2. The rescaling factor 2n/2can also be recognized in the above Theorem. Moreover, (2.5) shows that a convergence ofcn(Xbn+i(t)−xi(t))t≥0to a diffusion can
be conjectured for 1<c<p2.
Remark 2.9 (Comparison to work of Dean and Majumdar (2006)). In[9], the total number X
of external vertices was studied in the context of the Aldous-Shields model on anm-ary tree. In the binary case, a functional equation (their equation (2)) for the Laplace transform ofX(t)was shown to hold true. This equation uses the following fact: Given thatT is the random time of the first split in the model, it is clear thatT is mean one exponential and, in addition,
X(t)=d 1
480 3 APPLICATION: CELLULAR AGEING
3
Application: cellular ageing
The first mathematical model for cellular senescence was given in[17]. It takes several biological facts into account. When DNA is copied, the double helix is unfolded and both strands of DNA are copied. Only in one of the two strands there are physical constraints by which the end of a chromosome cannot be perfectly copied. This shortening of telomeres is independent for all chromosomes. In[17], it is assumed that (i) the telomeres are of fixed length, (ii) they decrease by a fixed length at each proliferation event for one of the daughter cells and (iii) proliferation occurs along a full binary tree. If the telomere length of a single chromosome falls below a threshold, a cell cannot replicate any more and becomes senescent. This threshold takes the Hayflick limit into account, which states that a cell line can only live for a limited number of generations before it becomes senescent.
The model in[17]was extended in several directions. A stochastic amount of loss of telomeres was studied in[2]. In[3]and[19], the binary tree of proliferating cells considered in[17]was replaced by the tree of a branching process. In particular,[19]included cell death into their model, with different death rates above and below a critical threshold of telomere length. Age structure of cells (i.e. structure which phase of the cell cycle the cell is in) is considered in[11, 12]. Moreover,
[4]extends the model of[17]by making telomerase activity (which is present in stem cells and cancer cells) explicit.
The idea to use the Aldous-Shields model for cellular ageing was influenced by the following recent results:
1. In [7], a model is proposed which distinguishes two states of telomeres: cappedand un-capped. Only in the capped state, proliferation of the cell is still possible. In somatic cells, an uncapped telomere cannot be transformed to the capped state any more leading to senesced cells; see[22]. In stem and tumor cells, telomerase is (among other things) responsible for transitions from uncapped back to capped telomeres. Following[23], the transition rate of the uncapped to the capped state in stem cell decreases with shorter telomeres.
2. In data, it has been observed that proliferating cells can behave differently. Motivated by data from[5, 8, 15], it is argued in[21]that the rate of proliferation decreases for shorter telomeres. Their model produces a Gompertzian growth model which is known to fit to empirical data for somatic and tumor cells.
In stem cells, the decreasing rate for an uncapped telomere to re-enter the capped state for shorter telomeres follows the behaviour of the Aldous-Shields model as shown in[23]remarkably well: cells with a long replicative history proliferate slower. While[21]uses a linear decrease in repli-cation rate, depending on the telomere length, the Aldous-Shields model uses a geometric decay of the proliferation rate.
Note that short telomeres can be seen as a form ofdamage. In[13], models for cellular damage were introduced. In their model, cells pass on damage to the daughter cells. This model, as well as the Aldous-Shields model are among the analytically tractable ones.
We state our model of cellular ageing:
Definition 3.1. Fix h∈N,r>0and c>1and letTh:=Sh+1
n=0Tn. The processZ = (Z(t))t≥0, where Z(t) = (Zu(t))u∈This a Markov jump process with state space{0, 1}T
h
, starting in Z(0) = (1
Given Z(t) =z∈ {0, 1}Th
and u∈Th\Th+1with z
u=1, it jumps to(ezv)v∈T, given by
e
zv=
0, v=u,
1, v=u0or v=u1,
zv, else, at rate r c−|u|. (Note that vertices u∈Th+1do not split.)
Informally, every external vertexuin this process represents a cell. If|u|=n, we say that the cell is in generationn. The process starts with a single mother cell. It proliferates at rater. All cells up to generationhfrom the mother cell follow the usual dynamics of the Aldous-Shields model (with time rescaled by a factor ofr), such that cells in generationnproliferate at rater·c−n. If a cell is in generationh+1 from the mother cell, its telomeres have reached the Hayflick limit and the cell is not able to proliferate any more.
Definition 3.2(Relative frequency of proliferating cells). In applications, the relative frequency of proliferating cells,
L(t):= Z
p(t)
Zp(t) +Zs(t) (3.1)
with
Zp(t):= X
u∈Th\Th+1
Zu(t), Zs(t):= X
u∈Th+1 Zu(t),
is of particular importance. Here, Zp(t)and Zs(t)is the number of proliferating and senescent cells at time t, respectively.
Theorem 2(Frequency of replicating cells). ForZ and L as in Definition 3.1 and 3.2,
lim
h→∞L(t c
h) =
P∞
i=0
P∞
k=02− ia
ke−c i+kt/r
P∞
i=0
P∞
k=0ak(2−ie−c i+kt/r
+2e−c−i−1+kt/r
) (3.2)
in probability, for all t>0.
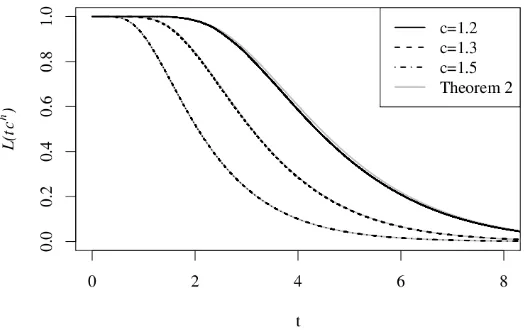
Remark 3.3 (Simulations). In our model for cellular senescence, Theorem 2 describes the de-crease in the frequency of proliferating cells. This frequency has been measured empirically; see e.g.[4, Figure 5] and[3, Figure 2]. As can be seen from the Theorem, every cgives a specific curve of decrease; see also Figure 2. These curves can be fit to data in order to estimatec. As the figure shows, the limiting result of Theorem 2 already gives a good fit for simulations which use
h=20.
4
Proof of Theorem 1
4.1
Preliminaries
The key ingredient in the proof is the quantity
yn(t):=E[Y0n(t)]with 0n:=0| {z }· · ·0 ntimes
482 4 PROOF OF THEOREM??
Figure 2: The decrease of the frequency of proliferating cells strongly depends on c. The figure shows simulations forc=1.2, 1.3, 1.5 andh=20. The grey lines show the limit result (3.2) from Theorem 2 withr=1.
Note that the dynamics of(Y0n)n=0,1,2,...(taking values in{0, 1}{0,1,2,...}with only one entry being 1)
is autonomous. It is given by the following rule: ifY0n(t) =1, then, at ratec−na transition occurs
to the configurationY0n(t) =0,Y0n+1(t) =1. From the dynamics of the Aldous-Shields model, it is clear that y(t) = (yn(t))n=0,1,2,...follows the differential equations
˙
yn=c−(n−1)yn−1−c−nyn, n≥0 (4.2)
with y−1=0; compare (2.1) in[AS]. We rewrite the equation to obtain
˙
y=C y
with
C=
−1 1 −c−1
c−1 −c−2 c−2 −c−3
c−3 −c−4 c−4 −c−5
· · · ·
Our first Lemma provides essential facts about the matrixC. Recallakandbkfrom (2.3).
Lemma 4.1. Let A= (ai j)i,j=0,1,2,...and B= (bi j)i,j=0,1,2,...be given by ai j:=ai−j, bi j:=bi−j.
Proof. To see thatAcontains the eigenvectors ofC, note that fori≥ j
To see thatAandBare inverse to each other, it follows from the definition ofakandbk that (BA)ii=a0·b0=1 and (BA)i j=0 fori< j.
where we have reversed the order of the summands in the last equality. We rewrite the product
(cl−1)· · ·(cl′
which implies thatAandBare inverse to each other. We use induction and note that the assertion is clear forn=1. Given it is true forn, we have
484 4 PROOF OF THEOREM??
4.2
First order structure; proof of
(2.4)
By linearity, we can now explicitly solve (4.2) using Lemma 4.1. SinceAcontains the eigenvalues of CandAis inverse toB, we immediately write, using y(t):= (y0(t),y1(t),y2(t), ...)andD:=
diag(−1,−c−1,−c−2, ...) 2−nE[X
n(t)]
n=0,1,2,...= y(t) =e
C ty(0)†=AeDtB y(0)†=AeDt(b
0,b1, ...)†
=
n
X
k=0
an−kbke−c−kt n=0,1,2,...
becausez(0) = (1, 0, 0, ...)as the process starts with(Y(0)) = (1
u=;)u∈T. We have shown the first
part of (2.4) and in order to prove the second part, fixi,k,tand note thatn7→ |ak|bn+i−ke−c
−i+kt
is increasing with a summable limit. Hence, by dominated convergence,
yn+i(t cn) =
∞
X
k=0
akbn+i−ke−c
−n−i+kt cnn→∞
≈ b∞
∞
X
k=0
ake−c−i+kt.
4.3
Second order structure; proof of
(2.5)
Now we come to the second order structure. Similar to the definition of ynin (4.1), we set for n≤n′
yn,n′,m(t):=COV[Y0n(t),Y0m1
n′−m(t)]with 0m1n′−m:=0| {z }· · ·0 mtimes
1· · ·1
| {z }
n′−mtimes
.
In order to see the connection of yn,n′,m(t)andCOV[Xn(t),Xn′(t)], we define the depth of the
most recent common ancestor ofu,u′as
Mu,u′:=sup{|v|:vu,vu′}, u,u′∈T,
wherevuifv≺uorv=u. LetU,U′be two random variables, whereUis uniformly distributed onTnandU′uniformly distributed onTn′, independent of all the rest. The distribution ofMU,U′
is given by (recalln≤n′)
P[MU,U′ =m] =2−((m+1)∧n), m=0, ...,n.
We write
COV[X
n(t),Xn′(t)] = X
u∈Tn
X
u′∈Tn′
E[Y
u(t)Yu′(t)]−E[Yu(t)]·E[Yu′(t)]
=2n+n′COV[Y
U(t),YU′(t)]
=2n+n′ ECOV[Y
U(t),YU′(t)|MU,U′]+COVE[YU|MU,U′],E[YU′|MU,U′]
=2n+n′ECOV[YU(t),YU′(t)|MU,U′]
=2n+n′
n
X
m=0
2−((m+1)∧n)yn,n′,m(t).
(4.4)
The second to last equality holds asE[YU|MU,U′] =E[YU]andE[YU′|MU,U′] =E[YU′]. In order
their most recent common ancestor and soM0n,0m1n′−m =m. We let Tmbe the last time whenY0m
is external, equivalently the time whenY0m+1becomes external, i.e. Tmis the sum of exponentials
with parameters 1,c−1,c−2, ...,c−m. Hence,
Using the last equations we now prove (2.5) in three steps. First, we give a representation of
yn,n′,m in terms of a functional of Tm. Second, we derive the asymptotics of yn+i,n+i′,m(t cn)for
largenusing this representation. Last, we plug this asymptotics into (4.4).
486 5 PROOF OF THEOREM 2
Plugging the last expression into (4.9) gives (4.8).
Step 3(Combining (4.8) and (4.4)). We write immediately, usingj=i−kandj′=i′−k′, This finally shows (2.5) and finishes the proof of Theorem 1.
5
Proof of Theorem 2
The parameter ris only a rescaling of time. Hence, we can safely assumer=1 in our proof. Let
it is important to note that
e
Xh+1(t) =#{u∈Th+1: ∃v:uv,Yv(t) =1},
almost surely; see also Remark 2.5. This implies that we can coupleY andZ in the sense that
(X1(t), ...,Xh(t),Xeh+1(t))t≥0 d
= X
u∈T1
Zu(t), ..., X
u∈Th+1 Zu(t)
t≥0.
By Theorem 1, forn≤handi=0, 1, 2, ...
Zp(t ch)=d
h
X
i=0
Xi(t ch) = h
X
i=0
Xh−i(t ch) h→∞
≈ b∞·2h ∞
X
i=0
∞
X
k=0
2−iake−c i+kt
,
Zs(t ch)=d Xeh+1(t ch) =
∞
X
i=1
2−i+1Xh+i(t ch) h→∞
≈ b∞·2h ∞
X
i=1
∞
X
k=0
2ake−c−i+kt
in probability, for allt>0. Using the last two limits in the definition ofLin (3.1) gives the result.
Acknowledgements
This research was supported by the BMBF through FRISYS (Kennzeichen 0313921).
References
[1] D. Aldous and P. Shields. A diffusion limit for a class of randomly-growing binary trees.Prob. Theo. Rel. Fields, 79(4):509–542, 1988. MR0966174
[2] T. Antal, K. B. Blagoev, S. A. Trugman, and S. Redner. Aging and immortality in a cell proliferation model. J. Theor. Biol., 248(3):411–417, 2007.
[3] O. Arino, M. Kimmel, and G. F. Webb. Mathematical modeling of the loss of telomere se-quences. J. Theor. Biol., 177(1):45–57, 1995.
[4] N. Arkus. A mathematical model of cellular apoptosis and senescence through the dynamics of telomere loss. J. Theor. Biol., 235(1):13–32, 2005. MR2139011
[5] Melissa A. Baxter, R. F. Wynn, S. N. Jowitt, J. Ed Wraith, L. J. Fairbairn, and I. Bellantuono. Study of telomere length reveals rapid aging of human marrow stromal cells following in vitro expansion. Stem Cells, 22(5):675–682, 2004.
[6] N. Berestycki. Recent progress in coalescent theory. Ensaios Matematicos, 16:1–193, 2009. MR2574323
[7] E. H. Blackburn. Telomere states and cell fates.Nature, 408:53–56, 2000.
[8] M. Bonab, K. Alimoghaddam, F. Talebian, S. Ghaffari, A. Ghavamzadeh, and B. Nikbin. Aging of mesenchymal stem cell in vitro. BMC Cell Biology, 7(1):14, 2006.
488 REFERENCES
[10] M. Drmota.Random Trees. Springer, 2009. MR2484382
[11] J. Dyson, E. Sánchez, R. Villella-Bressan, and G. F. Webb. Stabilization of telomeres in non-linear models of proliferating cell lines.J. Theor. Biol., 244(3):400–408, 2007. MR2293122
[12] J. Dyson, R. Villella-Bressan, and G. F. Webb. Asynchronous exponential growth in an age structured population of proliferating and quiescent cells. Math. Biosci., 177-178:73–83, 2002. MR1923804
[13] S. N. Evans and D. Steinsaltz. Damage segregation at fissioning may increase growth rates: A superprocess model.Theo. Pop. Biol., 71(4):473–490, 2007.
[14] J. Felsenstein.Inferring Phylogenies. Palgrave Macmillan, 2002.
[15] N. Gupta, R. Taneja, A. Pandey, M. Mukesh, H. Singh, and S. C. Gupta. Replicative senes-cence, telomere shortening and cell proliferation rate in gaddi goat’s skin fibroblast cell line.
Cell Biol. Int., 31:1257–1264, 2007.
[16] L. Hayflick and P. S. Moorhead. The serial cultivation of human diploid cell strains.Exp. Cell Res., 25:585–621, 1961.
[17] M. Z. Levy, R. C. Allsopp, A. B. Futcher, C. W. Greider, and C. B. Harley. Telomere end-replication problem and cell aging.J. Mol. Biol., 225(4):951–960, 1992.
[18] R. Neininger. Stochastische Analyse von Algorithmen, Fixpunktgleichungen und ideale Metriken, Habilitationsschrift, University of Frankfurt, 2004.
[19] P. Olofsson and M. Kimmel. Stochastic models of telomere shortening. Math. Biosci., 158(1):75–92, 1999. MR1681442
[20] A. M. Olovnikov. Telomeres, telomerase, and aging: origin of the theory. Exp. Gerontol., 31:443–448, 1996.
[21] R. D. Portugal, M. G. Land, and B. F. Svaiter. A computational model for telomere-dependent cell-replicative aging.BioSystems, 91(1):262–267, 2008.
[22] C. J. Proctor and T. B. Kirkwood. Modelling cellular senescence as a result of telomere state.
Aging Cell, 2(3):151–157, 2003.
[23] I. A. Rodriguez-Brenes and C. S. Peskin. Quantitative theory of telomere length regulation and cellular senescence.Proc. Natl. Acad. Sci., 107(12):5387–5392, 2010.
[24] J. W. Shay and W. E. Wright. Senescence and immortalization: role of telomeres and telom-erase.Carcinogenesis, 26:867–874, 2005.