Summary We measured stem respiration rates during and after the 1994 growing season of three common boreal tree species at sites near the northern and southern boundaries of the closed-canopy boreal forest in central Canada. The growth respiration coefficient (rg; carbon efflux per µmole of carbon incorporated in structural matter) varied between 0.25 and 0.76, and was greatest for black spruce (Picea mariana (Mill.) B.S.P.), least for jack pine (Pinus banksiana Lamb.) and inter-mediate for trembling aspen (Populus tremuloides Michx.). There was a consistent trend for higher rg at northern sites than at southern sites. Maintenance respiration rates at 15 °C (rm) varied from 0.5 to 2.7 nmol C mol−1Csapwood s−1. Values of rm were high at sapling-stage jack pine sites and mature black spruce sites, and low at mature trembling aspen and mature jack pine sites. We found significant relationships between annual maintenance respiration and sapwood relative growth rate and sapwood volume per unit of stem surface area that explained much of the within-stand and between-stand variability. Be-cause of the large differences in parameter values among sites, we conclude that the use of stand-specific respiratory parame-ters may improve model predictions of ecosystem process models over the use of generic parameter values.
Keywords: autotrophic respiration, carbon cycle, climate warming, ecosystem process models, growth respiration coef-ficient, Picea mariana, Pinus banksiana, Populus tremuloides, sapwood relative growth rate, sapwood volume, stand-specific respiratory parameters.
Introduction
Knowledge of carbon cycling in the boreal biome is important because it may be the missing sink in the global C cycle (Tans et al. 1990), and because the boreal biome may switch from being a net C sink to become a net source if the predicted climate warming occurs. Annual net ecosystem storage of carbon depends on the balance between photosynthesis and respiration (autotrophic plus heterotrophic); however, this bal-ance may change with climate warming because respiration is relatively more sensitive to temperature than photosynthesis (Ryan 1991, Amthor 1994). Stem growth is an important component of the carbon cycle of forested systems because
stems store carbon for long periods compared with foliage and fine roots. Although some of the carbon allocated to woody tissues is used for respiration, much is incorporated in new biomass. Stem carbon use efficiency, which describes the frac-tion of net photosynthetic producfrac-tion allocated to stems that is incorporated into new biomass, is an important indicator of how effectively the ecosystem sequesters carbon (Ryan et al. 1994, 1996).
The functional model of autotrophic respiration, which di-vides total respiration into growth and maintenance compo-nents (Amthor 1989, 1994), has become the standard basis for evaluating woody-tissue respiration (Sprugel and Benecke 1991, Sprugel et al. 1995). However, separating the growth and maintenance respiration components of total respiration is difficult because growing organs also contain mature tissues whose respiration is limited to the maintenance component. Theoretical methods for estimating the growth respiration co-efficient, (rg), have been developed (reviewed by Amthor 1989, 1994, Griffin 1994). Growth respiration can be estimated when rg and growth are known, and maintenance respiration can then be calculated by subtracting growth respiration from total respiration. The mature tissue method (Amthor 1989) is an alternative method of dividing total respiration into growth and maintenance respiration. The mature tissue method assumes that respiration rates of mature tissues, or respiration rates measured when growth is minimal, can be used to estimate maintenance respiration rates of actively growing tissues, and growth respiration is then calculated as the difference between total respiration and maintenance respiration (Amthor 1989, and Sprugel and Benecke 1991). Sprugel and Benecke (1991) noted that estimates of growth respiration obtained by the mature tissue method tend to be greater than those calculated by theoretical methods, and suggested that there were demands for the products of growth respiration in addition to those included in the theoretical methods. Furthermore, several stud-ies have found relationships between maintenance respiration rates and growth rates (Penning de Vries et al. 1979, Lavigne 1988, 1996), indicating that the assumption that they are inde-pendent is incorrect in at least some circumstances. Of the processes dependent on maintenance respiration, protein turn-over of existing tissues is thought to create the largest demand (Penning de Vries 1975a, Amthor 1989). Based on the
assump-Growth and maintenance respiration rates of aspen, black spruce and
jack pine stems at northern and southern BOREAS sites
M. B. LAVIGNE
1and M. G. RYAN
21
Canadian Forest Service, Atlantic Forestry Centre, Natural Resources Canada, Fredericton, NB E3B 5P7, Canada 2 Rocky Mountain Research Station, USDA Forest Service, Fort Collins, CO 80526-2098, USA
Received November 15, 1996
tion that nitrogen content is related to growth rate, Ryan (1991, 1995) and Ryan et al. (1996) used tissue nitrogen content as the basis for expressing maintenance respiration rates in an attempt to eliminate the effects of the relationship between maintenance respiration and growth.
Elevated CO2 concentrations do not directly affect stem
respiration parameters (Wullschleger et al. 1995, Carey et al. 1996), but they can indirectly influence respiration rates by changing the amount of carbohydrate available for stem growth. Possible global warming might affect the balance between growth and respiration because rising temperatures could increase maintenance respiration rates more than growth rates (Ryan 1991). Ryan et al. (1995) found that, for temperate conifer ecosystems, the proportion of net assimilation used for stem maintenance respiration increased linearly from 5 to 12% with increasing mean annual temperature.
The goal of the BOReal Ecosystem Atmosphere Study (BOREAS) was to assess the current and future roles of the boreal biome in the global carbon cycle (Sellers et al. 1995). We measured stem respiration during 1994 at sites near the southern and northern boundaries of the closed-canopy boreal forest in central Canada with the following objectives: (1) to determine whether respiratory parameters vary among three common boreal tree species (black spruce, Picea mariana (Mill.) B.S.P., jack pine, Pinus banksiana Lamb., and trem-bling aspen, Populus tremuloides Michx.), (2) to compare respiration parameters from the cold northern sites with those from the warmer, southern sites, and (3) to provide estimates of respiratory parameters for use in ecosystem process models. A companion study (Ryan et al. 1997) reports on foliar and root respiration, and examines complete autotrophic respira-tion budgets for these sites.
Methods Study sites
We measured stem respiration and growth during the 1994 growing season at eight BOREAS sites with contrasting cli-mates (Table 1). Four sites were located in the Southern Study Area, near the southern boundary of the boreal forest in central Canada, in the vicinity of Prince Albert, Saskatchewan (53°53′ N, 104°53′ W). The other four sites were located near the northern boundary of the boreal region, close to Thompson, Manitoba (55°53′ N, 98°20′ W) in the Northern Study Area. In each study area there was a mature aspen stand, referred to here as northern old aspen (NOA) and southern old aspen (SOA), a mature black spruce stand designated NOBS and SOBS, a mature jack pine stand called NOJP and SOJP, and a sapling-stage jack pine stand called northern young jack pine (NYJP) and southern young jack pine (SYJP). These sites are described in detail by Gower et al. (1997); important site characteristics for this study are summarized in Table 2.
Respiration measurements
We used automated, manifold systems to measure respiration rates. The data at the northern sites were supplemented with measurements made with a manual system. The manifold system used at the Northern Study Area differed from that used in the south, and so they are described separately. The manifold systems gave similar results to the portable system.
Southern Study Area The respiration system used in the south was similar to that described by Lavigne et al. (1996) and Lavigne (1996). Ambient air, drawn from 1 m above the ground, was pumped through 16 respiration chambers and
Table 1. Climatic norms for BOREAS study areas near Prince Albert, Saskatchewan, Canada (south) and Thompson, Manitoba, Canada (north).
Study area Mean annual temperature (°C) July average temperature (°C) Annual precipitation (mm) Growing season precipitation (mm)
South 0.1 14 390 160
North --3.9 16 540 220
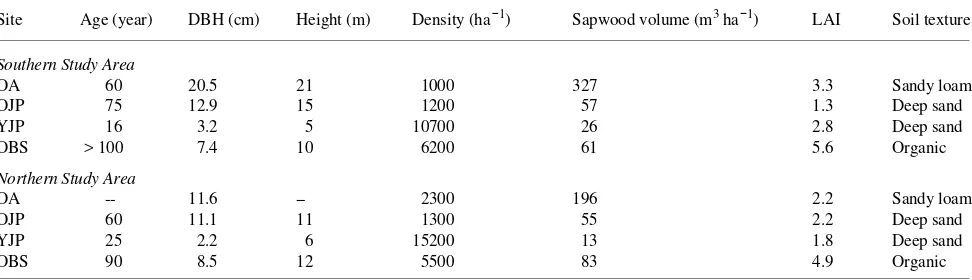
Table 2. Site characteristics of stands (OA = old trembling aspen, OJP = old jack pine, YJP = young jack pine, OBS = old black spruce) near the southern boundary of the boreal zone (Southern Study Area) and the northern boundary (Northern Study Area) in central Canada where stem respiration measurements were taken. The source of this information was Gower et al. (1997).
Site Age (year) DBH (cm) Height (m) Density (ha−1) Sapwood volume (m3 ha−1) LAI Soil texture
Southern Study Area
OA 60 20.5 21 1000 327 3.3 Sandy loam
OJP 75 12.9 15 1200 57 1.3 Deep sand
YJP 16 3.2 5 10700 26 2.8 Deep sand
OBS > 100 7.4 10 6200 61 5.6 Organic
Northern Study Area
OA -- 11.6 -- 2300 196 2.2 Sandy loam
OJP 60 11.1 11 1300 55 2.2 Deep sand
YJP 25 2.2 6 15200 13 1.8 Deep sand
through the reference cell of the gas analyzer (LI-6252, Li-Cor, Inc., Lincoln, NE). A data logger (Model CR-10, Campbell Scientific Inc., Chatham, ON, Canada) controlled a series of solenoids that determined the order in which air was pumped through the 16 chambers. Each chamber was measured once during the 1.75-h measurement cycle. Air was pumped through each chamber for 20 minutes, and mean values for the last minute were recorded. Fans stirred air in the chambers while measurements were taken. The zero of the gas analyzer was checked regularly during the measurement cycle, and span was checked once. Stem temperature immediately under the bark was measured with a copper-constantan thermocouple inside the chambers while CO2 flux was being observed.
Respiration chambers used in the Southern Study Area con-sisted of clear acrylic tubes and closed-cell neoprene (Lavigne et al. 1996 and Lavigne 1996). Chambers used on small diame-ter trees, including all trees at SYJP and some trees at SOBS, completely encircled the stem. Chambers on large diameter trees enclosed a portion of the stem circumference. One cham-ber per tree was attached to 16 trees in each stand. Tree diameters spanned the range of the stands (Table 3). Chambers were attached 1--2.5 m aboveground. Plate-like chambers on larger trees were attached on the sides of the trees that were most conducive to forming air-tight seals.
All stands were measured with the manifold system for 3--4 days early in the growing season, during the middle of the growing season, late in the growing season and after growth had ended for the year. Thirty to 50 measurements were made per chamber during each measurement period. Additional measurements were made with the manifold system at SOBS between the early growing season and mid-growing season
intensive field campaigns. Chambers were opened between measurement periods.
Northern Study Area Stem respiration was measured on 20 trees in the NOJP, NOBS, and NOA stands, and 10 trees in the NYJP stand; tree diameters spanned the range of the stand (Table 3). In the NOJP, NOBS, and NOA stands, aluminum chamber plates (110 cm2) with an external neoprene gasket were attached to the north side of the tree with putty after the removal of loose bark. Chambers were attached at a height of 1.2--1.4 m on four trees per stand, and additional chambers were placed at a height of 6 m. For CO2 efflux measurements,
a Plexiglas chamber was sealed to the chamber plate with an elastic cord. For measurements in the NYJP stand, split Plexi-glas chambers (23 cm in length) enclosed the entire stem, with neoprene gaskets creating a seal. A small fan mixed the air in each chamber, and chambers were removed between measure-ments. Sapwood temperature was measured for each chamber with a copper-constantan thermocouple inserted 1 cm into the sapwood.
Two types of measurements were made in 1994. (1) During each intensive field campaign in the NOJP, NOBS, and NOA stands, CO2 efflux was measured once per hour for 3--6 days
on eight chambers per site (four trees with chambers located at heights of 1.3 and 6 m) to determine temperature response. At the NYJP stand, continuous measurements were made on six trees only during the midsummer intensive field campaign. (2) Point measurements of CO2 flux were made every 2--3 weeks
at all sites for all chambers. The continuous measurements were made using both a manifold and an open system (Field et al. 1991), controlled with a data logger (Model CR-21X, Campbell Scientific, Logan, UT). The manifold system had two gas circuits. When CO2 efflux was being measured, inlet
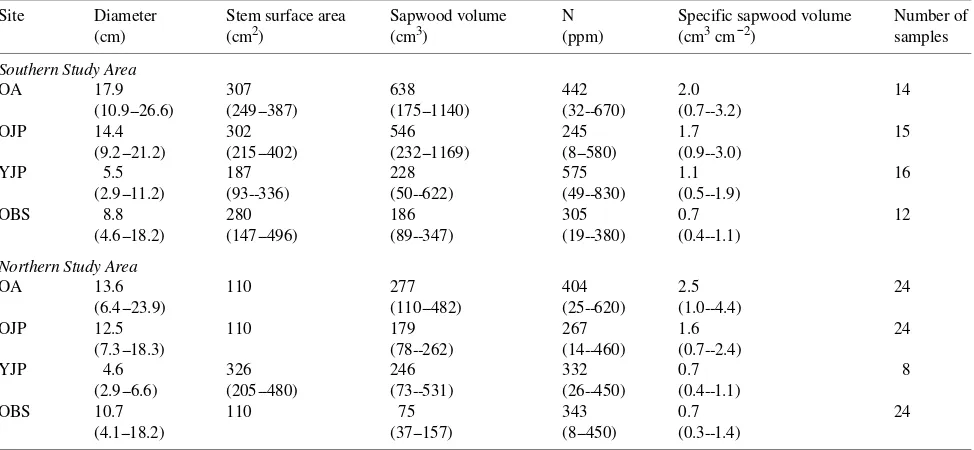
Table 3. Stem characteristics where respiration chambers were attached at BOREAS sites near Prince Albert, Saskatchewan in the Southern Study Area, and near Thompson, Manitoba in the Northern Study Area. Abbreviations: OA = old trembling aspen stand, OJP = old jack pine stand, YJP = young jack pine stand, and OBS = old black spruce stand. Ranges are shown in parentheses.
Site Diameter Stem surface area Sapwood volume N Specific sapwood volume Number of (cm) (cm2) (cm3) (ppm) (cm3 cm−2) samples
Southern Study Area
OA 17.9 307 638 442 2.0 14
(10.9--26.6) (249--387) (175--1140) (32--670) (0.7--3.2)
OJP 14.4 302 546 245 1.7 15
(9.2--21.2) (215--402) (232--1169) (8--580) (0.9--3.0)
YJP 5.5 187 228 575 1.1 16
(2.9--11.2) (93--336) (50--622) (49--830) (0.5--1.9)
OBS 8.8 280 186 305 0.7 12
(4.6--18.2) (147--496) (89--347) (19--380) (0.4--1.1)
Northern Study Area
OA 13.6 110 277 404 2.5 24
(6.4--23.9) (110--482) (25--620) (1.0--4.4)
OJP 12.5 110 179 267 1.6 24
(7.3--18.3) (78--262) (14--460) (0.7--2.4)
YJP 4.6 326 246 332 0.7 8
(2.9--6.6) (205--480) (73--531) (26--450) (0.4--1.1)
OBS 10.7 110 75 343 0.7 24
air was drawn through a 20-liter mixing chamber (to provide a stable reference CO2 concentration), pushed through the
cham-ber at 270 µmol s−1, and returned to the CO2 analyzer (ADC
LCA2, ADC, Hoddesdon, U.K.). Otherwise, inlet air was pushed through the chambers at 3.5 mmol s−1, to keep CO2
concentration in the chamber at < 5 µmol mol−1 above ambi-ent. The point measurements were made with an open system (Field et al. 1991) and an ADC LCA3 or LCA4 gas analyzer with an air flow of 270 µmol s−1.
Growth measurements
Increment cores were taken from enclosed portions of stems after chambers were removed. We measured bark thickness, phloem width, width of the 1994 xylem ring, and sapwood thickness on one increment core. Wood density and nitrogen concentration of sapwood were measured on a second incre-ment core. We used the data to estimate sapwood volume beneath each chamber and growth on a dry weight basis. Growth estimates were converted to molar units by assuming a 50% carbon content for oven-dried wood (Carey et al. 1996). We computed sapwood relative growth rates (RGRsapwood) as µmol mol−1Csapwood year−1 to facilitate comparing chambers of different sizes, and so that the units would be compatible with the respiration rate units.
Data analysis
We divided chamber flux by sapwood carbon enclosed in the chamber to calculate respiration rate. We regressed stem respi-ration rate against sapwood temperature for each chamber and intensive field campaign with the equation:
r = r15Q10(T− 15)⁄10, (1)
where r is stem respiration rate (nmol C mol−1Csapwood s−1), T is sapwood temperature (°C) recorded approximately 2 h ear-lier (see Ryan et al. (1996) and Lavigne et al. (1996) for explanations of the use of lagged sapwood temperature), r15 is a regression coefficient that estimates respiration rate at 15 °C, and Q10 is a regression coefficient that describes the change in respiration rate for a 10 °C change in sapwood temperature. Similar analyses have been described in detail by Lavigne (1987). We used the average Q10 for the stand to estimate the r15 of chambers where spot measurements were made.
The dates on which stem growth began and ended were estimated for each stand based on respiration measurements and phenological observations. We assumed that coefficients estimated with the post-growing season data were repre-sentative of the physiological state during the entire dormant season. Values of r15 and Q10 on each day of the growing season were estimated by linear interpolation between measured val-ues. Sapwood temperature or air temperature was recorded hourly or half-hourly at most sites between Days 145 and 265 by groups making eddy covariance measurements. For times when temperatures were not collected on site, we used tem-perature records from nearby weather stations to make com-plete records of air temperature for the 1994 calendar year. Annual total respiration (Rt, mmol C mol−1Csapwood year−1)
was estimated by Equation 1 using daily values of r15 and Q10 with temperature records. Temperatures were not meas-ured at NOA, so the temperature record for NYJP was used.
The mature tissue method (Amthor 1989) was used to esti-mate annual maintenance respiration (Rm), and to subdivide total respiration into maintenance and annual growth respira-tion (Rg). Values of r15 and Q10 estimated with post-growing season CO2 flux measurements and the annual site-specific
temperature records were used with Equation 1 to estimate Rm.
Two-way analysis of variance was used to compare respira-tion and growth among study areas and sites. When require-ments for normality and homogeneity of variance were not met with data in its original units, the two-way ANOVA was per-formed on rank transper-formed data. A Fisher’s LSD multiple comparison test was performed when significant differences (P < 0.05) were found. Sigmastat version 2.0 (Jandel Inc., San Rafael, CA) was used for statistical analyses.
Results
Seasonal course of stem respiration rates
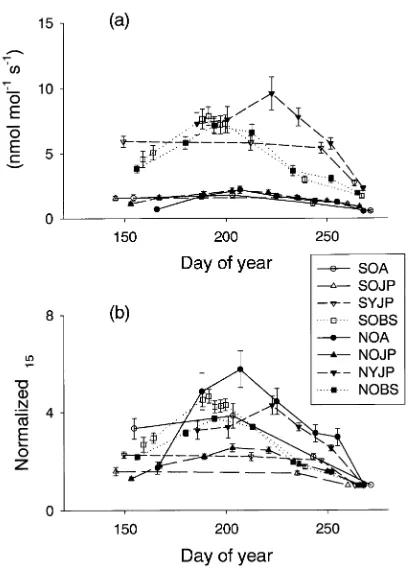
Stem respiration rates at the OJP and OA stands were lower than those at the YJP and OBS stands (Figure 1a). In the earliest measurements of the year, stem respiration rates of
Figure 1. (a) Seasonal course of total stem respiration rates at 15 °C at BOREAS sites in the Southern and Northern Study Areas in central Canada. (b) Seasonal course of normalized total stem respiration rates at 15 °C (observed r15 during the growing season divided by the r15
southern sites were already much greater than dormant season rates (Figure 1b). In contrast, the earliest measurements of respiration rates at northern sites were only slightly greater than dormant season rates, and rates increased substantially during the following 30--70 days (Figure 1b). Respiration rates at SOJP and SYJP showed little variation during the growing season (Figures 1a and 1b); respiration rates declined from growing season rates to dormant season rates during a rela-tively short period. Respiration rates at NOJP and NYJP varied more during the growing season than their southern counter-parts and the decline from growing season maximal rates to dormant-season rates began earlier than at the southern sites. Respiration rates at Northern and Southern OBS and OA stands showed substantial seasonal variation that differed be-tween species (Figures 1a and 1b). Respiration increased to maximal rates between Days 180--190 at OBS stands, and after Day 200 at OA stands.
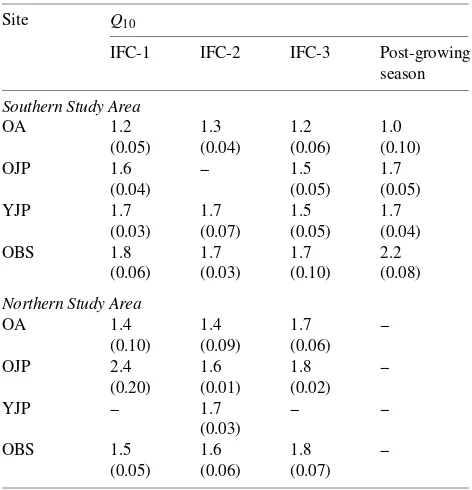
Among the forest stands studied, respiration rates varied least with temperature in aspen stands (Table 4), but there were no other statistical differences among stands or between Northern and Southern Study Areas.
Annual respiration rates
Annual total respiration rates did not vary significantly (P > 0.05) between Northern and Southern Study Areas, but did vary significantly between sites (P < 0.001, Table 5). The Rt rates were greatest at the YJP stands, followed by the OBS,
OJP, and OA stands. Average annual maintenance respiration rates varied significantly between sites (P < 0.001), but not between Northern and Southern Study Areas (Table 5). The order of stands from highest to lowest Rm followed that for Rt.
Annual growth respiration rates (Rg) varied significantly
between Northern and Southern Study Areas (P < 0.001), between stands (P < 0.001), and the interaction between study area and stand was also significant (P = 0.008, Table 5). Sapwood relative growth rates (RGRsapwood) did not vary
sig-nificantly between Northern and Southern Study Areas, but did vary significantly between stands (P < 0.001, Table 5). Young Jack Pine stands had the highest growth rates, OBS stands had significantly greater growth rates than those of OJP and OA stands, but growth rates of OJP stands did not differ significantly from those of OA stands. Stem carbon use efficiency (CUE), calculated as the ratio of carbon used for growth to carbon used for growth and respiration (RGRsapwood / (RGRsapwood +Rt)), differed significantly
be-tween sites (P < 0.001), and these site differences were not the same at Northern and Southern Study Areas (P = 0.026, Ta-ble 5). Old Aspen and YJP stands were among the most effi-cient users of carbon in Northern and Southern Study Areas, and the OBS stand was least efficient in both study areas. The YJP stand was significantly more efficient than the OJP stand in the Southern Study Area, but not in the Northern Study Area. The Rg rates were significantly correlated to RGRsapwood (Figure 2a, Table 5). The growth respiration coefficient (rg, Table 5), which was estimated as the ratio of annual growth respiration rate to sapwood relative growth rate (Rg / RGRsapwood), varied significantly between study areas (P < 0.001) and sites (P < 0.001), and there was a significant interaction between study area and site (P = 0.003). Values of rg were highest for OBS stands and lowest for JP stands. Values of rg tended to be higher at northern sites than at southern sites, and the differences between study areas were statistically sig-nificant (P < 0.05) for the YJP and OJP stands.
Maintenance respiration rates
There were no significant relationships between maintenance respiration rate and sapwood nitrogen concentration within stands or for all stands combined. The RGRsapwood explained
much of the within-stand and between-stand variations in maintenance respiration rates (Figure 2b). A nonlinear rela-tionship between annual maintenance respiration (Rm; mmol mol−1 Csapwood year−1) and sapwood relative growth rate (RGRsapwood; mmol mol−1Csapwood year−1),
Rm= 71.4 (1 − exp(−0.0105 RGRsapwood)), (2)
explained 55% of the variation (r2 = 0.55, standard error of estimate = 12.8 mmol mol−1Csapwood year−1). The nonlinear equation produced accurate estimates over the entire range of observed RGRsapwood, in contrast to a simple linear equation that consistently overestimated maintenance respiration rates at low RGRsapwood. Within-stand relationships between RGRsapwood and Rmdiffered from the relationship that existed when data from all stands were pooled (Figure 2b).
Relation-Table 4. Values of temperature response coefficients (Q10) measured
during BOREAS intensive field campaigns early in the growing sea-son (IFC-1, May 23 to June 16), mid-growing seasea-son (IFC-2, July 19 to August 8), late growing season (IFC-3, August 29 to September 20), and after the growing season had ended (September 27 to October 10). Standard errors of the means are given in parentheses.
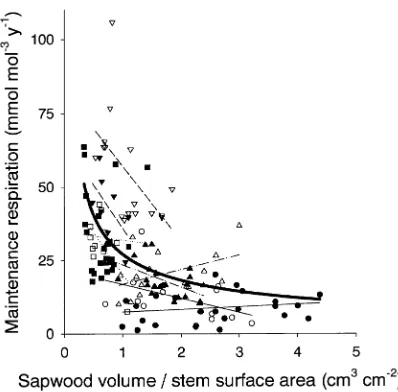
ships between maintenance respiration and sapwood volume per unit of stem surface (SSV; cm3 cm−2) existed for individual stands and for all stands combined (Figure 3). A nonlinear relationship between annual maintenance respiration and SSV,
Rm= 27.2 SSV−0.58, (3)
based on data from all stands, explained 28% of the total variation (r2 = 0.28, standard error of estimate = 15.0 mmol mol−1Csapwood year−1) and fit the data well over the entire range of SSVs. We tested numerous regression models using both RGRsapwood and SSV to predict Rm, and obtained the best fit (r2 = 0.65, standard error of estimate = 11.4 mmol mol−1 Csapwood year−1) when the nonlinear models used for RGRsapwood and SSV were combined:
Rm= 59.5 SSV−0.38(1 − exp(−0.0139 RGRsapwood)). (4)
Discussion
With the mature tissue method, we obtained estimates of rg that were substantially higher than theoretical estimates reported for the same or similar species. For example, Carey et al. (1996) determined that the theoretical rg for Pinus ponderosa Dougl. ex Laws. was 17, which is lower than the values we estimated for jack pine (Table 5). Chung and Barnes (1977) estimated rg theoretically for black spruce at 12, which is much less than our estimates (Table 5), and the rg of 0.25 calculated for generic wood by Penning de Vries (1975b) is lower than our estimates for trembling aspen. Edwards and Hanson (1996) found that predicted respiration, based on theoretical
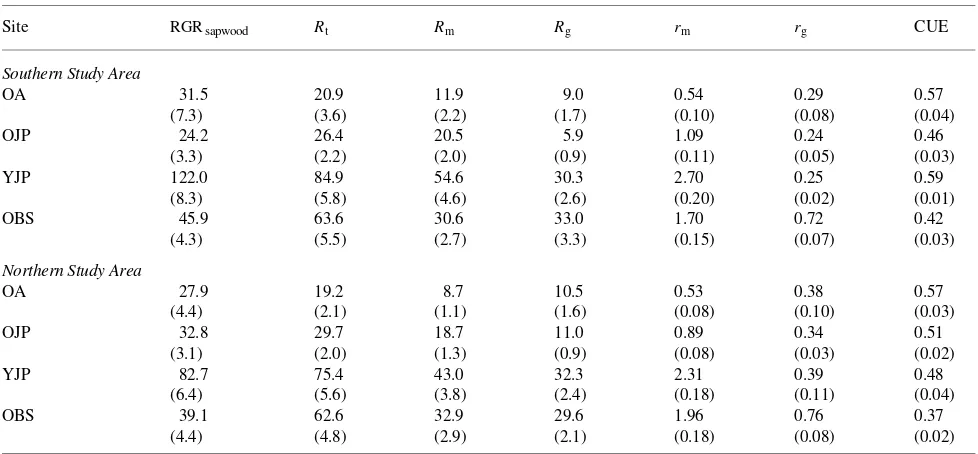
Table 5. Mean sapwood relative growth rate (RGRsapwood (mmol mol−1Csapwood year−1)), annual total, maintenance and growth respiration rates
(Rt, Rm and Rg (mmol mol−1 Csapwood year−1)), maintenance respiration coefficient (rm (nmol mol−1 Csapwood s−1)), growth respiration coefficient (rg (µmol µmol−1)) and stem carbon use efficiency (CUE).
Site RGRsapwood Rt Rm Rg rm rg CUE
Southern Study Area
OA 31.5 20.9 11.9 9.0 0.54 0.29 0.57
(7.3) (3.6) (2.2) (1.7) (0.10) (0.08) (0.04)
OJP 24.2 26.4 20.5 5.9 1.09 0.24 0.46
(3.3) (2.2) (2.0) (0.9) (0.11) (0.05) (0.03)
YJP 122.0 84.9 54.6 30.3 2.70 0.25 0.59
(8.3) (5.8) (4.6) (2.6) (0.20) (0.02) (0.01)
OBS 45.9 63.6 30.6 33.0 1.70 0.72 0.42
(4.3) (5.5) (2.7) (3.3) (0.15) (0.07) (0.03)
Northern Study Area
OA 27.9 19.2 8.7 10.5 0.53 0.38 0.57
(4.4) (2.1) (1.1) (1.6) (0.08) (0.10) (0.03)
OJP 32.8 29.7 18.7 11.0 0.89 0.34 0.51
(3.1) (2.0) (1.3) (0.9) (0.08) (0.03) (0.02)
YJP 82.7 75.4 43.0 32.3 2.31 0.39 0.48
(6.4) (5.6) (3.8) (2.4) (0.18) (0.11) (0.04)
OBS 39.1 62.6 32.9 29.6 1.96 0.76 0.37
(4.4) (4.8) (2.9) (2.1) (0.18) (0.08) (0.02)
estimates of rg, underestimated observed respiration rates dur-ing the growdur-ing season for Quercus alba L. and Acer rubrum L. but not for Quercus prinus L. Sprugel and Benecke (1991) noted that mature tissue estimates of rg were generally higher than theoretical estimates. Griffin (1994) reported that publish-ed theoretical estimates of rg for stem wood ranged from 0.08 to 0.50 for a variety of species, and our estimates by the mature tissue method ranged from 0.25 to 0.76 (Table 5). Sprugel and Benecke (1991; p 335) argued that theoretical estimates of rg should be considered the minimum realistic estimates, because ‘‘growth-related maintenance respiration and other ‘‘hidden costs’’ of wood production’’ are not included. The extent to which our estimates of rg differed from theoretical estimates varied between species, as was found by Edwards and Hanson (1996).
The rg of stands at each southern site was lower than for the comparable stand in the Northern Study Area (Table 5), show-ing that stem growth was more efficient in the south than in the north. We speculate that the differences in rg could be related to subtle, inherent differences in the seasonal course of growth rates (Figures 1a and 1b), the contributions of respiration that have not previously been assigned to growth, and the weather during the 1994 growing season, which was warmer than usual, particularly in the north, and drier than usual, especially in the south.
Maintenance respiration rates differed greatly between stands (Table 5). The OA stands had the lowest rm, possibly
because stem photosynthesis recycled some of the CO2
pro-duced by respiration (Foote and Schaedle 1976, 1978). Rela-tionships between sapwood volume per unit of stem surface area (SSV) and Rm existed for some sites, but not for the aspen
sites (Figure 3), and this difference might also have been
associated with stem photosynthesis. Site differences were not simply species-related; OJP stands had relatively low rm,
whereas YJP stands had relatively high rm. The rm did not differ
significantly between Northern and Southern Study Areas. Lavigne (1996) found no differences in stem maintenance respiration rates between northern and southern provenances of jack pine growing together in a common garden at a south-ern site. Growth rates of trees selected to represent northsouth-ern provenances were similar to those representing southern provenances. These results and the findings presented here show that stem maintenance respiration of jack pine does not exhibit genetically related latitudinal trends.
Differences in maintenance respiration between and within sites could be explained partly by differences in RGRsapwood
and SSV, although the significance and nature of the relation-ships varied between sites (Figures 2b and 3). A relationship between maintenance respiration rate and sapwood relative growth rate similar to that observed at the BOREAS sites was observed for jack pine growing in eastern Canada (Lavigne 1996), and trends between maintenance respiration and stem growth and SSV similar to those found here have been ob-served for Abies balsamea (L.) Mill. (Lavigne 1988, Lavigne et al. 1996). However, these relationships do not always exist. For example, relationships were insignificant at the OA stands, and relationships with SSV were nonexistent at the SOBS and SOJP stands (Figure 3). Moreover, Ryan (1990), Sprugel (1990) and Edwards and Hanson (1996) found that only sap-wood volume correlated with chamber differences in mainte-nance respiratory fluxes.
Although it has been assumed that no relationship exists between maintenance respiration rate and growth rate (Amthor 1989), we consistently observed such relationships at our sites (Figure 2b), suggesting that the manner in which the functional subdivision of respiration is applied may need to be modified. One possibility is to develop individual relationships between rm for maintenance respiration and specific sapwood volume and sapwood relative growth rate, rather than assuming the same value for all trees of a species; however this will require a better understanding of maintenance respiration. A better understanding of growth respiration is also required to explain why estimates of rg by the mature tissue method are greater than the theoretical estimates, and this, in turn, might lead to a revision in our understanding of total respiration and its growth and maintenance components.
Because the calculations of stem carbon use efficiency did not require dividing respiration into its growth and mainte-nance components, the comparisons of stands were not subject to the associated uncertainties. Among stands, the black spruce stands used the carbon allocated to stems least efficiently (Table 5). Black spruce stands also had the lowest carbon use efficiencies based on conversion of net photosynthetic produc-tion to net primary producproduc-tion (Ryan et al. 1997). Aspen stands had the highest carbon use efficiency, but the true efficiency could be lower if some respired CO2 was recycled by stem
photosynthesis. The SYJP stand had higher stem carbon use efficiency than the SOJP stand, indicating an effect of stand age. However, our data do not unequivocally demonstrate that
stem carbon use efficiency changed with stand age for jack pine, because the NYJP stand was not more efficient than the NOJP stand, as a result of the high rg of the NYJP stand.
Conclusions
Most process models use three parameters: the growth coeffi-cient (rg; µmol C respired per µmol C incorporated in woody biomass), the maintenance respiration rate per unit of sapwood C (or N) at some reference temperature (rm; nmol C mol−1 Csapwood s−1 at 15 °C) and a dimensionless temperature coeffi-cient (i.e., Q10). We found that each of these parameters varied substantially among stands, and therefore, using stand-specific parameters may improve model predictions compared with using generic parameter values. The large variations in these parameters highlight the need for a better understanding of stem growth and maintenance respiration processes. The re-sults cast doubt on the assumption that stem maintenance respiration rate is independent of stem growth rate.
Acknowledgments
We thank tower flux teams at all BOREAS sites for use of stem and air temperature data, Rob Hubbard, Silvia Pongracic, Bill Grauel and Troy Riche for field assistance, and Mark Rayment and Jon Massheder for operating the manifold respiration system at SOBS between the first and second intensive field campaigns. This study was funded by the Climate Change Program of the Canadian Forest Service, NASA (S64092), and the USDA Forest Service.
References
Amthor, J.S. 1989. Respiration and crop productivity. Springer-Ver-lag, New York, 215 p.
Amthor, J.S. 1994. Plant respiratory responses to the environment and their effects on the carbon balance. In Plant--Environment Interac-tions. Ed. R.E. Wilkinson. Marcel Dekker, Inc., New York, pp 501--554.
Carey, E.V., E.H. DeLucia and J.T. Ball. 1996. Stem maintenance and construction respiration in Pinus ponderosa grown in different concentrations of atmospheric CO2. Tree Physiol. 16:125--130.
Chung, H.-H. and R.L. Barnes. 1977. Photosynthate allocation in
Pinus taeda. I. Substrate requirements for synthesis of shoot biomass. Can. J. For. Res. 7:106--111.
Edwards, N.T. and P.J. Hanson. 1996. Stem respiration in a closed-canopy upland oak forest. Tree Physiol. 16:433--439.
Field, C.B., J.T. Ball and J.A. Berry. 1991. Photosynthesis: principles and field techniques. In Plant Physiological Ecology: Field Meth-ods and Instrumentation. Eds. R.W. Pearcy, J. Ehleringer, H.A. Mooney and P.W. Rundel. Chapman and Hall, London, U.K., pp 209--253.
Foote, K.C. and M. Schaedle. 1976. Diurnal and seasonal patterns of photosynthesis and respiration by stems of Populus tremuloides
Michx. Plant Physiol. 58:651--655.
Foote, K.C. and M. Schaedle. 1978. The contribution of aspen bark photosynthesis to the energy balance of the stem. For. Sci. 24:569--573.
Gower, S.T., J. Vogel, T.K. Snow, J.M. Norman, S.J. Steele and C.J. Kucharik. 1997. Carbon distribution and above-ground net primary production of upland and lowland boreal forests in Saskatchewan and Manitoba. J. Geophys. Res. In press.
Griffin, K.L. 1994. Calorimetric estimates of construction cost and their use in ecological studies. Funct. Ecol. 8:551--562.
Lavigne, M.B. 1987. Differences in stem respiration responses to temperature between balsam fir trees in thinned and unthinned stands. Tree Physiol. 3:225--233.
Lavigne, M.B. 1988. Stem growth and respiration of young balsam fir trees in thinned and unthinned stands. Can. J. For. Res. 18:483--489. Lavigne, M.B. 1996. Comparing stem respiration and growth of jack pine provenances from southern and northern locations. Tree Physiol. 16:847--852.
Lavigne, M.B., S.E. Franklin and E.R. Hunt, Jr. 1996. Estimating stem maintenance respiration rates of dissimilar balsam fir stands. Tree Physiol. 16:687--695.
Penning de Vries, F.W.T. 1975a. The cost of maintenance processes in plant cells. Ann. Bot. 39:77--92.
Penning de Vries, F.W.T. 1975b. Use of assimilates in higher plants.
In Photosynthesis and Productivity in Different Environments. Ed. J.P. Cooper. Cambridge Univ. Press, London, U.K., pp 459--480. Penning de Vries, F.W.T., J.M. Witlage and D. Kremer. 1979. Rates of
respiration and of increase in structural dry matter in young wheat, ryegrass and maize plants in relation to temperature, to water stress and to their sugar content. Ann. Bot. 44:595--609.
Ryan, M.G. 1990. Growth and maintenance respiration in stems of
Pinus contorta and Picea engelmannii. Can. J. For. Res. 20:48--57. Ryan, M.G. 1991. Effects of climate change on plant respiration. Ecol.
Appl. 1:157--167.
Ryan, M.G. 1995. Foliar maintenance respiration of subalpine and boreal trees and shrubs in relation to nitrogen content. Plant Cell Environ. 18:765--772.
Ryan, M.G., M.B. Lavigne and S.T. Gower. 1997. Annual carbon cost of autotrophic respiration in boreal forest ecosystems in relation to species and climate. J. Geophys. Res. In press.
Ryan, M.G., S. Linder, J.M. Vose and R.M. Hubbard. 1994. Dark respiration of pines. Ecol. Bull. 43:50--63.
Ryan, M.G., S.T. Gower, R.M. Hubbard, R.H. Waring, H.L. Gholz, W.P. Cropper and S.W. Running. 1995. Woody tissue maintenance respiration of four conifers in contrasting climates. Oecologia 101:133--140.
Ryan, M.G., R.M. Hubbard, S. Pongracic, R.J. Raison and R.E. McMurtrie. 1996. Foliage, fine-root, woody-tissue and stand respi-ration in Pinus radiata in relation to nitrogen status. Tree Physiol. 16:333--343.
Sellers, P., F. Hall, H. Margolis, R. Kelly, D. Baldocchi, G. den Hartog, J. Cihlar, M.G. Ryan, B. Goodison, P. Crill, K.J. Ranson, D. Letten-maier and D.E. Wickland. 1995. The boreal ecosystem-atmosphere study (BOREAS): an overview and early results from the 1994 field year. Bull. Am. Meteorol. Soc. 76:1549--1577.
Sprugel, D.G. 1990. Components of woody-tissue respiration in young Abies amabilis (Dougl.) Forbes trees. Trees 4:88--98. Sprugel, D.G., and U. Benecke. 1991. Measuring woody-tissue
respi-ration and photosynthesis. In Techniques and Approaches in Forest Tree Physiology. Eds. J.P. Lassoie and T.M. Hinckley. CRC Press, Boca Raton, FL, pp 329--355.
Tans, P.P., I.Y. Fung and T. Takahashi. 1990. Observational constraints on the global atmospheric CO2 budget. Science 247:1431--1438.