Health insurance and female labor supply in Taiwan
Y.J. Chou
a, Douglas Staiger
b,∗aDepartment of Social Medicine, Institute of Health and Welfare Policy, National Yang-Ming University, Medical School, No. 155, Sec. 2, Lih-Nong St., Taipei, Taiwan, ROC
bDepartment of Economics, Dartmouth College, Hanover, NH 03755, USA
Received 1 November 1998; received in revised form 1 September 2000; accepted 14 September 2000
Abstract
We examine whether the availability of subsidized health insurance to the non-working population in Taiwan affected the labor force participation of married women. Our empirical identification exploits the fact that such insurance was first made available to wives of government employees, before being made universally available in Taiwan in 1995. We find that the availability of insurance for non-workers was associated with a 4 percentage point decline in labor force participation among married women, with larger declines among women from low income households. Countries considering universal health insurance as in Taiwan should anticipate similar declines in labor force participation. © 2001 Elsevier Science B.V. All rights reserved.
JEL classification:I10; J22
Keywords:National health insurance; Labor supply; Taiwan
1. Introduction
This paper provides an empirical examination of how the expansion of subsidized health insurance to the non-working population in Taiwan affected the labor supply of married women. We estimate reduced form labor force participation models for married women us-ing a series of cross-sectional surveys, the Survey of Family Income and Expenditure, col-lected annually in Taiwan from 1969 to the present. Our empirical work identifies the effect of this insurance expansion on labor force participation by exploiting the fact that this insur-ance was only made available to wives of government employees beginning in 1982, before being made universally available in 1995. We find that the availability of subsidized health
∗Corresponding author. Tel.:+1-603-646-2979; fax:+1-603-646-2122.
E-mail address:[email protected] (D. Staiger).
insurance for non-working women was associated with a roughly 4 percentage point de-cline in labor force participation among married women, with larger dede-clines among women whose husbands have low earnings potential (as measured by their educational attainment). Both of these results are best explained by a simple static model of labor supply with incom-plete health insurance markets, in which health insurance for non-working women is valued above its expected financial value due to a combination of risk aversion, highly variable health care expenses, and the lack of a market for private health insurance in Taiwan.
There is a large empirical literature, almost exclusively based on the US experience, that investigates the impact of health insurance on individual labor supply behavior (see Currie and Madrian, 1998 and Gruber, 1998 for recent surveys). The work most closely related to this paper falls into four categories. (1) Spouse insurance coverage and female labor force participation, (2) medicare and retirement, (3) employer provided health insurance and “job-lock” and (4) medicaid and the labor supply of single mothers. The common thread connecting our results to the recent papers in these four categories is that the link between employment and health insurance is found to have significant impacts on labor supply behavior which are larger than one would anticipate based on the expected dollar value of this insurance alone. However, if there is market failure in the private insurance market (say, due to adverse selection), then one would expect such large effects of health insurance on labor supply: risk averse individuals who cannot obtain insurance otherwise will value employer-provided health insurance above its expected dollar value. Thus, our paper adds to the evidence that employer-provided health insurance is an important determinant of labor supply behavior in the presence of incomplete insurance markets.
Section 2 provides some background on the key features of health insurance in Taiwan that provide the basis for our empirical work. Until recently, health insurance in Taiwan has only been available to working adults with no coverage of spouses or dependents. In 1982, the health insurance plan for government employees was amended to provide coverage of spouses, allowing government employees’ wives to withdraw from the labor market and still maintain health insurance coverage. In 1995, National Health Insurance was implemented in Taiwan and provided coverage to spouses of all workers. These changes provide the basis for our empirical work, as we compare the labor force participation of government employees’ wives to that of other married women in the years just before and after these changes in coverage.
coverage and the surveys from 1992 to 1997 to analyze the 1995 change. In both analyses, we estimate reduced form probit models of labor force participation among married women on the pooled data. We identify the impact of the change in insurance coverage by comparing the change in labor force participation among the affected women to the change among women whose insurance options were unaffected.
We find that labor force participation of married women declines by about 4 percentage points after subsidized health insurance is made available to them through their spouses or through National Health Insurance. For wives of less-educated husbands, the effects are larger, up to twice as large depending on the specification. The magnitudes of both of these estimates are large relative to the expected value of the insurance subsidy being given to women, but are consistent with our model in which risk-averse women are reluctant to leave the labor force if they cannot purchase health insurance. Moreover, the magnitudes are large from a macro-perspective and may help to explain recent concern in Taiwan over a decline in labor force participation rates. Countries considering insurance expansions similar to Taiwan’s want to consider these potential effects on their labor supply.
2. Background
In March 1995, Taiwan implemented a new National Health Insurance program that pro-vides health insurance coverage to the entire population.1 Prior to this, the availability of health insurance was quite limited. Nearly half of the population was uninsured, and the remainder of the population received insurance through one of three government-sponsored health plans with virtually no private health insurance coverage available.2 Three features of the pre-1995 health plans are particularly relevant to our analysis. Firstly, all the plans provide a similar range of comprehensive health benefits. Secondly, these plans were tied to a person’s place of employment with premiums paid by contributions from the employee, the employer and the government. Finally and most importantly, until 1995 there was no coverage of spouses or dependents in the largest of these plans, Labor Insurance (LI), that covered all private-sector employees (roughly one-third of the population and two-thirds of the insured prior to 1995). Thus, for the most part, comprehensive health insurance was available to workers but unavailable for any person who was not working prior to March 1995.
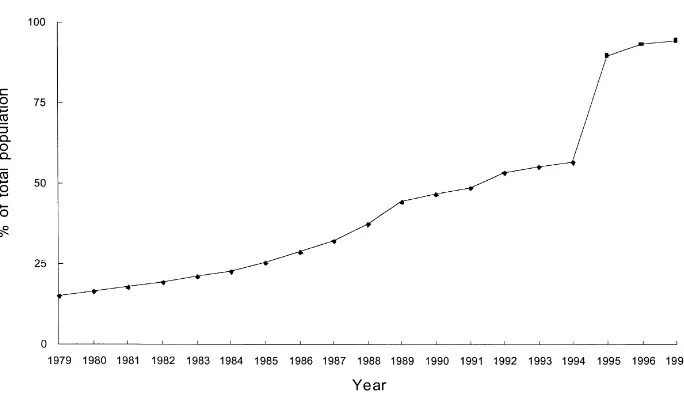
As seen in Fig. 1, the combination of no private market for health insurance along with limited availability of coverage for family members in the government-sponsored plans resulted in a large fraction of the population being uninsured. The Taiwan government provided some direct subsidies to providers for treating the poor uninsured and beginning in 1990 provided health insurance to very low-income households, but these programs covered less then 1% of health spending. As a result, prior to 1995 the average household in Taiwan faced out-of-pocket health expenditures that were both large and variable. For example, in the early 1990s roughly 50% of health expenditures in Taiwan were paid out-of-pocket,
1Bureau of National Health Insurance, 1997.
Fig. 1. Percentage of population with health insurance Taiwan 1979–1997.
with the average household spending approximately 3% of income on out-of-pocket health expenditures. Moreover, the distribution of out-of-pocket health expenditures was quite variable and skewed, with the standard deviation across households being 2–3 times the mean and the mean twice the median.3
Prior to National Health Insurance, however, some of the government-sponsored plans were amended to provide coverage for family members, resulting in an increase in insurance coverage that is apparent in Fig. 1. Table 1 summarizes the major features of the three government-sponsored plans and how they changed through time. In July 1982, the health plan for government employees (Government Employee Insurance, GEI, which covered about 3% of the population and 10% of paid employees in 1981) was amended to provide coverage for dependents. Only spouses of government employees were covered in the initial stage. The parents and children of government employees became eligible in July 1989 and 1992, respectively.4 The additional premium for a spouse (and dependents) was 3–5% of the government employees’ salary, with 50% of this amount paid by the employee. As a result of this change in the GEI in 1982, spouses of government employees became the only Taiwanese who could obtain health insurance while not employed.
This change in the GEI program provides a unique opportunity to study the impact of health insurance on the labor force participation of women. Prior to 1982, any women who did not work faced the full expense and uncertainty of her health care expenses. After 1982, wives of government employees who did not work could obtain subsidized comprehensive health insurance, while wives of private-sector workers could not. During our study pe-riod, 1979–1985, there was no change in the LI insurance plan that covered private-sector
3Based on authors calculations from the Survey of Family Income and Expenditure for 1994. See also Peabody et al., 1995.
employees. Thus, we can identify the effect of this health insurance expansion by com-paring the labor force participation of government employees’ wives to non-government employees’ wives.
With the implementation of National Health Insurance in early 1995, all women in Tai-wan gained access to an insurance plan similar to what government employees’ wives had obtained in 1982. The new system provides a “reverse test”: the labor force participation of non-government employees’ wives should be affected by the new insurance, while govern-ment employees’ spouses (who were already covered by health insurance de-linked from their employment) should be unaffected.
A number of factors may make the impact of the National Health Insurance on women’s labor force participation different from what was observed among government employees’ spouses in 1982. First, the subsidy in 1995 was larger, with the employee only paying 30% of the premium. More importantly, by the 1990s many non-government employees’ wives were able to obtain insurance through other family members. The GEI offered coverage to dependents and parents of government employees by 1992, while Farmers Health Insurance (FHI) was introduced in 1985 and was available to all family members over age 15 (including children and parents) of agricultural households by 1989. Nevertheless, we would still expect to observe an impact of National Health Insurance on the labor force participation of non-government employees’ wives, although the magnitude may differ from what we observe in 1982.
3. Theory
The basic theory of static labor supply implies that the availability of subsidized health insurance for non-working women will reduce labor force participation. Like other forms of social insurance, the government subsidy being offered to non-workers reduces the attrac-tiveness of working. In addition, health insurance has a value beyond the subsidy, since it reduces the variability in consumption that results from unexpected health expenditures. If a women’s health expenditures are a small part of total expenditures (for example, because of high husband earnings) we might expect the additional subsidy and insurance to have little effect on her labor force decision. In contrast, for a less affluent household, the availability of subsidized insurance may have a large impact on the women’s decision.
These ideas can be made more formal in a simple model of labor supply. For simplicity, suppose that a women chooses either working and receiving a wagew, or not working and having additional leisureβ. Utility from consumption (C) and leisure (L) takes the form:
U (C, L)= C 1−γ
1−γ +L (3.1)
whereγ is the coefficient of relative risk aversion. Finally, consumption equals the wife’s earnings plus other household income (A) less health expenses (H). For simplicity, we treat health expenses as pure financial losses, with no direct utility value. Health expenses are uncertain, with a meanµand standard deviationσ.
working isU(A+w,0). The expected utility of not working depends on whether subsidized health insurance is available. If health insurance can be purchased for some fraction (δ) of its expected cost, then the expected utility of not working is U(A−δµ,β). If health insurance is unavailable, then the expected utility of not working is E[U(A−H,β)]∼=
U (A−µ−p,β) wherep = −1/2σ2U′′/U′ = 1/2σ2γ /(A−µ)is the risk premium associated with uninsured health care expenses (Pratt, 1964). Adding an error term (ν) representing idiosyncratic tastes for work versus leisure, this model predicts that women will work when:
where INSURE=1 if insurance is available and 0 otherwise.
Eq. (3.2) formalizes how the availability of insurance affects the probability of working. If individuals are risk averse (γ >0) and insurance is subsidized (δ <1) then the last term in brackets is positive, and the availability of insurance will reduce labor force participation. The magnitude of this effect is an empirical question, since it depends on the distribution of ν. However, the term in brackets in Eq. (3.2) declines asAincreases (because of the concavity ofUand declining absolute risk aversion). This suggests that the affect of the availability of subsidized insurance will be largest for women whose husbands have low earnings (small A) — these women are more concerned about both the level and the uncertainty of health expenses in the absence of insurance.
There are a number of reasons to think this type of subsidized insurance will have a substantial effect on labor supply in Taiwan. First, the subsidy (1−δ) was large: 50% of the cost of insurance for government employees’ wives in 1982 and 70% for all women in 1995. These subsidies are equivalent to roughly 1–3% of average earnings among women in our sample. If individuals were risk neutral, we would expect the effect of this subsidy on labor force participation to be equivalent to the effect of a 1–3% reduction in wages. With risk aversion, the insurance will have an even larger effect on labor force participation: the insurance expansion provides a direct subsidy to not working and eliminates the risk premium associated with not working. Under plausible values for (A,µ,σ,γ), the risk premium (p) is about as large as the direct subsidy value.5 Thus, the effects of these insurance expansions on labor force participation should be comparable to the effects one would see from a 2–6% reduction in women’s wages.
Of course, this calculation provides only a rough estimate as to the value of health in-surance availability for non-working women. For example, this calculation may understate the value of insurance because the risk premium calculation is based on a local approx-imation, while health expenditures are very skewed with a long upper tail. Alternatively, this calculation may overstate the value of insurance if spending on medical care produces little benefits due to the moral hazard effects of insurance. Thus, while the effects of the insurance expansion on labor supply are likely to be sizable, it is difficult to be very precise about the expected magnitude of these effects.
4. Data and empirical strategy
4.1. Data
The data we use are drawn from a series of cross-sectional surveys, the Survey of Family Income and Expenditure (SFIE),6 collected annually in Taiwan from 1969 to the present. Our primary analysis uses six surveys, covering the years 1979 to1985 but excluding 1982, the year in which the health insurance program for government employees’ dependents took effect. Since the program was implemented in the middle of the year on July 1st, it is unclear to what extent this year was affected by the program. Our second analysis uses data from the years 1992–1997, the most recent years available. Again, we drop the year in which the program takes effect (1995) from the analysis. Unfortunately, only 2 years of data (1996–1997) are available for the period after implementation of National Health Insurance. This data limitation, combined with the fact that the Farmer and Labor Insurance programs were changing in the 1990s as well, may make it difficult to isolate the impact of the National Health Insurance program on labor force participation.
The SFIE is a household survey that was conducted by the Department of Budget, Ac-counting and Statistics in Taiwan, with the interviews and field work arranged by the local government. The sampling procedure was designed to represent the civilian non-institutio-nalized population in Taiwan. A sample of 14,000 to 16,000 registered households was se-lected and interviewed during each study year. The number of people covered in this period totals from 57,000 to 77,000. Unfortunately, we can not follow the same household through time.
The main information collected in this survey includes: (1) family composition and basic individual information (including age, family relationship, whether or not employed, sector of employment, occupation, job title), (2) housing conditions and facilities, and (3) individual income and family expenditures. The data are collected both from interviews and from diaries. At the initial interview, questions are asked about individual basic information and the major categories of income and expenditures over the past year. A small sample of respondents is required to keep diaries and is visited regularly by inspectors. The results of this control group are used to monitor quality of the interview survey. According to Deaton and Paxson (1994) the data are of good quality.
Our sample is restricted to married women who are between the ages of 20 and 65 and whose husbands are paid employees in the public or private sectors.7 The sample is further restricted to women who are the household head or married to the household head, because determining marital status and identifying the spouse is only possible for the household head in the SFIE (although marital status is available for every individual after 1988). We exclude women from agricultural families and women whose husbands are self-employed or an employer, because these women are likely to work in a family business and their labor force status is often ambiguous (e.g. there is less distinction between “housekeeper”, “employed” and “self-employed”). We exclude single women (who might serve as an alternative control group) for two reasons. First, single women who are not household heads cannot be identified prior to 1991. Second, labor force participation rates among single women (both their levels and their trends) are quite different from married women, making them a poor control group.
Thus, we gather a treatment group of married women whose husbands are employed in the government sector and a control group of married women whose husbands are employed in the non-agricultural private sector. Non-working women in the treatment group (wives of government sector employees) can obtain health insurance through their husbands beginning in July 1982, while non-working women in the control group (wives of private sector employees) cannot obtain health insurance until March 1995.
The final sample for 1979–1985 consists of 34,223 women (about 5500 women per year), of which 7456 (22%) have husbands employed by the government. The sample for 1992–1997 consists of 27,753 women (also about 5500 women each year), of which 4185 (15%) have husbands employed by the government. About 8% of the total labor force works in government jobs in Taiwan. In our sample, government employment is over-represented because we exclude the self-employed and agricultural households (both large sectors in Taiwan) and because married household heads are more likely to work for the government. The decline over time in the fraction of our sample working for the government is consistent with published statistics (The Executive Yuan, 1997) and reflects the rapid growth of paid employment in the private sector over the last 20 years in Taiwan.
We construct two closely related measures of employment status, based on a question about labor force status during the month of December that was consistently surveyed from 1979 to 1996. We define being in the labor force to include four categories: employer, employee, self-employed and no-pay family workers. Those who are not in the labor force are classified as students, housekeepers and others (over age 65 and those with a disabil-ity). Alternatively, we construct a variable indicating whether a women is an “employee” conditional on being in the labor force. Labor Insurance primarily covers women who are employees of companies or factories with five or more employees.8 Therefore, the em-ployee category corresponds to women who are working in the “covered” sectors, i.e. in
7Two types of employees in the public sector are identified in the survey: government enterprise and government. Only about half of the employees (civil servants) in the government enterprise sector are eligible for health insurance benefits for their spouses. We exclude government enterprise employees from our analysis. However, we derive similar results by including the small proportion of employees working in the government enterprise sector.
Table 2
Husband’s income (1991 NT dollars), 1979–1985a
Husband’s employment Total sample Government employee Non-government employee Husband’s education
Husband did not attend high school
Illiterate 205092 (86379) 216883 (53349) 204285 (88154) Literate 207485 (91674) 217396 (60684) 206313 (94650) Elementary school 248395 (100553) 248544 (85348) 248385 (101514) Junior high school 281411 (115091) 282839 (96465) 281164 (118021) Husband attended high school
High school (occupational) 330395 (155528) 312169 (100914) 337740 (172196) High school (senior) 329164 (145830) 307175 (101467) 336563 (157305) College (occupational) 377433 (192426) 356376 (118079) 397160 (240564) College (academic) 437839 (231395) 389704 (140056) 481729 (283659) Graduate school 554265 (300946) 513283 (206825) 626802 (410035) aStandard deviation in parentheses.
jobs that provide health insurance coverage. We would expect the availability of spousal coverage to reduce the likelihood of working in the covered sector (being an “employee”) given that a women was working.
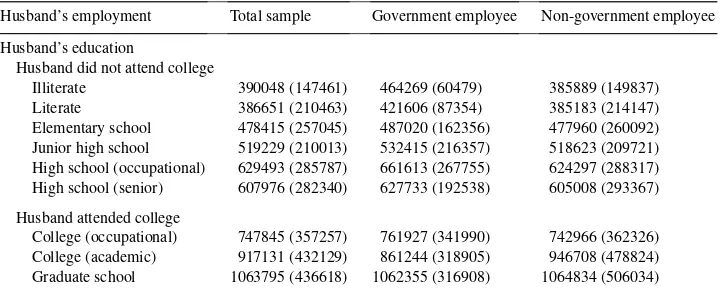
For some of our analysis, we restrict the sample to a low education group, based on the husband’s educational attainment. As discussed in Section 3, we expect that a women’s labor supply response to the availability of insurance will depend on other income available in the household (e.g. her husband’s income and non-labor income). Rather than using the husband’s actual income (which may be endogenous), we differentiate women by their husband’s education. As can be seen in Tables 2 and 3, a husband’s education is strongly related to his earnings for both government and non-government workers. In the 1979–85 sample, we define the low education group as having a husband who did not attend high school. In the 1992–97 sample, we define the low education group as having a husband who
Table 3
Husband’s income (1991 NT dollars), 1992–1997a
Husband’s employment Total sample Government employee Non-government employee Husband’s education
Husband did not attend college
Illiterate 390048 (147461) 464269 (60479) 385889 (149837) Literate 386651 (210463) 421606 (87354) 385183 (214147) Elementary school 478415 (257045) 487020 (162356) 477960 (260092) Junior high school 519229 (210013) 532415 (216357) 518623 (209721) High school (occupational) 629493 (285787) 661613 (267755) 624297 (288317) High school (senior) 607976 (282340) 627733 (192538) 605008 (293367) Husband attended college
did not attend college (since almost all government workers in the 1992–1997 sample have attended high school).
Tables 4 and 5 present the sample means of selected variables for the two samples. The left-hand panel of each table contains means for the total sample. The first two columns report statistics for wives of government employees before and after the change in in-surance availability and the second two columns report the same statistics for wives of non-government employees. As would be expected, the characteristics of government employees’ wives differ substantially from non-government employees’ wives. Govern-ment employees’ wives are older, more educated, have fewer young children, have a better educated husband and higher family income.
The right hand panel of Tables 4 and 5 show the sample means for the low education subgroup. Wives of government and non-government employees look more similar than in the sample as a whole, particularly in terms of their own education. Not surprisingly, the women in the low education group have lower education themselves, lower labor force participation, lower family income and tend to be older.
4.2. Empirical strategy
Our goal is to estimate how health insurance expansions, to government employees’ wives in 1982 and to all women in 1995, affected the labor supply of married women. In 1982, government employees’ wives became eligible for health insurance through their husbands, while non-government employees’ wives were unaffected and thereby comprise a natural comparison group. In 1995, this situation was reversed. All women became eligible for health insurance though, implementation of the National Health Insurance program. Since government employees’ wives already had access to such insurance, they can be used as a control group.
We estimate the effect of these health insurance expansions on female labor force partic-ipation through the following probit equation:
Pr(working=1)=Φ[β0+β1×government+β2×government×
post-insurance+β3×year+β4×X] (4.1)
where: “working” is a dummy variable equal to one if the women is in the labor force (or alternatively is an employee conditional on being in the labor force); “government” is a dummy variable representing whether the husband is a government employee or not; “post-insurance” is a dummy variable identifying the years after the implementation of the new health insurance program; “year” is a set of year dummies; andXis a set of individual demographic and family characteristics. The interaction term captures the health insurance impact on the labor participation decisions of those women affected by the insurance ex-pansion, relative to women not affected by the change. We expectβ2 <0, i.e. we expect the availability of insurance to reduce women’s labor force participation.
or islander) is only available and controlled for in the 1979–1985 sample. Year dummies are used to control for any time trend. In some specifications, we interact the year dummies with birth cohort dummies (ten 5-year birth cohorts).
5. Results
5.1. Descriptive evidence
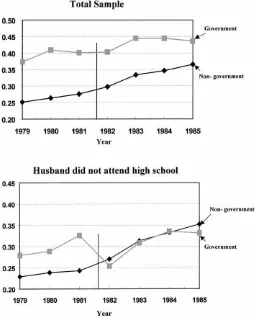
Figs. 2 and 3 present basic descriptive evidence on how the employment among govern-ment employees’ wives changed relative to other women in 1982 and 1995. Each panel in these figures graph the proportion of women who were working in each year, separately for government employees’ wives and non-government employees’ wives. Fig. 2 plots the data for 1979–1985, while Fig. 3 plots the data from 1992–1997. The vertical line in each figure indicates the point at which coverage became available for government employee wives (July 1982) and for non-government employee wives (March 1995). The top panel in each
Fig. 3. Labor force participation, 1992–1997.
figure presents trends for the total sample, and the bottom panel presents trends for only the low education subsample — those women whose husbands did not attend high school (1979–1985) or college (1992–1997).
A simple difference-in-difference estimate of the effect of the insurance changes on labor force participation can be constructed from these data. As seen in the first row of Table 4, the growth in labor force participation between 1979–1981 and 1983–1985 was 4.7 percentage points among government employees’ wives (from 39.5 to 44.2%) and 8.4 percentage points for non-government employee wives (from 26.4 to 34.8%). Thus, labor force participation among government employees’ wives fell by 3.7 percentage points (P <0.01) relative to the control group. A similar calculation for the sample of women with less educated husbands implies an even larger effect, with labor force participation among government employees’ wives falling by 6.8 percentage points (P <0.01) relative to the control group. Analogous estimates, based on data from 1992–1997 (see the first row of Table 5), suggest that the introduction of National Health Insurance had similar effects. Labor force participation fell by 4.5 percentage points (P <0.01) among non-government employees’ wives relative to government employees’ wives following the introduction of National Health Insurance, with a larger effect (6.9 percentage points,P =0.01) among wives with less educated husbands. The effects in the total sample (top panels of Figs. 2 and 3) are difficult to distinguish visibly in part because government employees’ wives are much more likely to work. This is less true in the low education sample (bottom panels). As was seen in Tables 4 and 5, there are differences between government employees’ wives and non-government employees’ wives that are likely to affect their labor force behavior. For example, the difference in the total sample is in part due to the higher education (and therefore, potential wages) of govern-ment employees’ wives. These differences between the governgovern-ment and non-governgovern-ment employees’ wives highlight the fact that the treatment and control group are not completely comparable, so that it may be important to control for these differences.
5.2. Probit estimates: 1979–1985
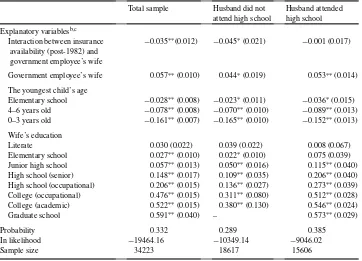
Table 6 reports the results of probit estimates of whether a women is working based on Eq. (4.1). Unlike the graphs, these estimates allow us to control for observable characteristics that differ between the government employees’ wives and non-government employees’ wives. The first column of each table shows results from the entire sample. In the second and third columns the sample is split according to whether a women’s husband attended high school. For convenience, the coefficients from the probit analysis have been transformed into the marginal probabilities implied by those coefficients. Logit models and linear probability models yield very similar results.
Table 6
Probit models of labor force participation, 1979–1985a
Total sample Husband did not
Government employee’s wife 0.057∗∗(0.010) 0.044∗(0.019) 0.053∗∗(0.014)
The youngest child’s age
Literate 0.030 (0.022) 0.039 (0.022) 0.008 (0.067)
Elementary school 0.027∗∗(0.010) 0.022∗(0.010) 0.075 (0.039)
Junior high school 0.057∗∗(0.013) 0.050∗∗(0.016) 0.115∗∗(0.040)
High school (senior) 0.148∗∗(0.017) 0.109∗∗(0.035) 0.206∗∗(0.040)
High school (occupational) 0.206∗∗(0.015) 0.136∗∗(0.027) 0.273∗∗(0.039)
College (occupational) 0.476∗∗(0.015) 0.311∗∗(0.080) 0.512∗∗(0.028)
College (academic) 0.522∗∗(0.015) 0.380∗∗(0.130) 0.546∗∗(0.024)
Graduate school 0.591∗∗(0.040) – 0.573∗∗(0.029)
Probability 0.332 0.289 0.385
In likelihood −19464.16 −10349.14 −9046.02
Sample size 34223 18617 15606
aThe coefficients have been transformed to the marginal effects.
bIn addition to the variables reported, all probit models control for age and age squared of the husband and wife, husband’s education, county, urbanization, living with parents, husband’s occupation, husband’s race, wife’s race and year dummies.
cStandard errors are shown in parentheses beneath marginal effects.
∗Significant at the 5% level. ∗∗Significant at the 1% level.
implying a decline of over 15% in the number of these women in the labor force after health insurance becomes available.
The remainder of the coefficients in these probit models are generally as expected. We only report coefficients for selected variables of interest. Conditional on all our control variables, government employees’ wives are still initially more likely to work, but these differences have narrowed compared to Fig. 2. More education is associated with a higher probability of working. Women who have a young child are less likely to work. Although the coefficients are not shown, age, husband’s education, husband’s job characteristics and husband’s race (mainlander or islander) all have significant and expected signs in this model. Women living with their parents are more likely to work, but a women’s race is not a significant determinant of working. The county and the urbanization of the household also have significant effects on working.
because this is where the primary effect on labor supply appears to be concentrated. The first column of Table 7 repeats the estimates from the original specification for comparison. In the second column we add a full set of year-cohort interactions, based on 5-year birth cohorts. One might expect that time trends in labor force participation differ by age, and that these might bias our results since government employees’ wives are considerably older than non-government employees’ wives. Adding year-cohort effects increases the estimated im-pact slightly. In the third column we conduct a similar exercise, interacting all of the control variables with a post-1982 dummy to see whether other covariates can explain any of the pre-post decline in labor force participation among government employees’ wives. Again, the estimated impact increases slightly. In column 4 we control for the log of non-wife income. This variable is arguably endogenous, but also may have followed different time trends for government and non-government workers so that omitting it introduces bias. When we control for non-wife income it has the expected negative sign (through income effects on labor supply) and our estimated effect become somewhat smaller but remains negative and marginally significant (P =0.08). In the final column, we investigate whether including the first year following the change in insurance availability (1982) affects the results and again find the estimate to be robust.
Overall, these estimates from the 1979–1985 period suggest that the availability of subsi-dized health insurance that was not linked to employment had a sizable negative impact on a women’s probability of working. The estimated impact is largest among women with less educated husbands and is not particularly sensitive to reasonable changes in the specification.
5.3. Probit estimates: 1992–1997
If wives of government employees worked less after insurance became available to them through their husbands in 1982, then we would expect the wives of non-government em-ployees to work less after insurance became available to them through National Health Insurance (NHI) in early 1995. Tables 8 and 9 report probit estimates analogous to those
Table 8
Probit models for labor force participation, 1992–1997a
Total sample Husband did not
In likelihood −17774.03 −12710.06 −4978.94
Sample size 27753 19454 8299
aThe coefficients have been transformed to the marginal effects.
bIn addition to the variables reported, all probit models control for husband’s employment, youngest kid’s age, wife’s education, age and age squared of the husband and wife, husband’s education, county, urbanization, living with parents, husband’s occupation and year dummies.
cStandard errors are shown in parentheses beneath marginal effects.
of Tables 6 and 7. Once again, we estimate models of the probability that a women worked for the whole sample and then separately for wives with more and less educated hus-bands. Since non-government employees’ wives are now getting the insurance, we fo-cus on the interaction between being the spouse of a non-government employee and the years 1996–1997 (when insurance was available to these women). Since other coefficients are quite similar to the earlier tables, we only report the coefficient from the interaction term.
The coefficient estimates on the interaction term in these models are quite similar to our earlier estimates: the availability of insurance in 1996–1997 was associated with a decline of 4.6 percentage points in the labor force participation of non-government employees’ wives relative to government employees’ wives, with larger effects (6.7 percentage points) among wives of less educated men. Not surprisingly, with only 2 years of post-NHI data these estimates are not as precise as in Table 6, but are still significant at the 5% level. Table 9 reports the results from specification checks parallel to those reported in Table 7, using only women with less educated husbands. Once again, the coefficient estimates are reasonably robust to these specification changes. Overall, the results are quite consistent with estimates based on the expansion of Government Employee Insurance to cover spouses in 1982.
5.4. Probit estimates of working in the covered sector
Employer provided insurance was only available to employees, and not to employers, the self-employed and family workers. Therefore, with the availability of insurance through a spouse or through National Health Insurance, working women had less incentive to work as employees, i.e. in the covered sector. Table 10 investigates whether the fraction of working women who were employees fell after insurance became available. The table reports esti-mates of probit models of whether a women was an employee, conditional on working. The specifications are similar to those in previous tables. The top (bottom) panel of the table reports the coefficient for the interaction between being a government (non-government) employees’ spouse and years after 1982 (1995). To conserve space, we present only results for wives of less educated men for whom the effects are expected to be largest. The estimates for wives or more educated men are uniformly small and insignificant.
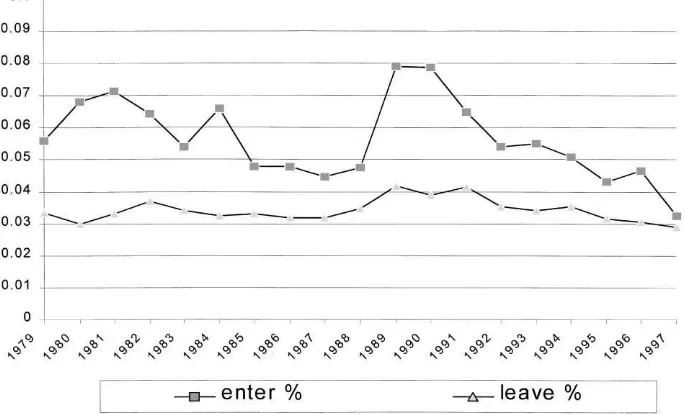
Fig. 4. Turnover in government sector in Taiwan.
5.5. Evidence on sorting between sectors
One possible interpretation of our findings is that men with non-working wives sorted into government jobs after spousal benefits were offered and then sorted back into non-government jobs after National Health Insurance. Our assumption is that this type of sorting happens slowly, so that the short-run effect we estimate is primarily due to labor supply effects on wives and not due to the self selection of couples into jobs. There are three pieces of evidence that support this assumption. First, as can be seen in Fig. 4, turnover (both entry and exit) is very low in the government sector in Taiwan and has changed little over the study period.9 In our sample, turnover might be expected to be even lower since we only consider married couples (over 80% of government employees are married). These low turnover rates limit the amount of sorting that could have occurred, and if there was sorting we would have expected some change in turnover rates after the availability of insurance changed in 1982 and 1995.
A second reason to think that our results are not due to sorting is that the estimates of the effect of insurance availability on labor supply are not sensitive to how one controls for characteristics of the couple such as education or number of children. For example, without controls for individual characteristics (i.e. only year dummies, a dummy for government employees’ wife, and the interaction term) the estimates from Tables 6 and 8 are quite similar: for the total sample we estimate a reduction in labor force participation of 4.2 percentage points in 1982 and of 4.6 percentage points in 1995 (compared to estimates of
3.5 and 4.6 percentage points with controls); while for the sample whose husband was less educated we obtain estimates of 6.5 and 6.9 percentage points (compared to 4.5 and 6.7 percentage points with controls). Thus, adding controls may reduce the estimated effects slightly in 1982 but have no effect at all in 1995. If there had been sorting of couples with non-working wives into jobs with insurance, we would have expected that some of this could be predicted by changing characteristics of government employees and their spouses. The fact that controlling for these characteristics does not systematically or materially reduce the estimated effects suggests that sorting was not a major factor.
Finally, if sorting was a problem one would expect to see systematic changes in the average characteristics of government employees following the change in coverage. In particular, women who are less likely to work (with young children, less educated) should sort into the government employee sample after 1982 and the opposite should occur after 1995. However, we see no evidence of this in Tables 4 and 5. For example, between 1979–1981 and 1983–1985 the fraction of government employees with a young child fell by 1.8 percentage points, while the fraction of non-government employees with a young child fell by 1.6 percentage points. Similarly, changes in the education of the wife were not very different between the two samples. Finally, after 1995 it looks like, if anything, we see the opposite of what would be expected based on the sorting interpretation: women who are less likely to work are increasingly found in the government employee sample (e.g. the percent with young children rises relative to the non-government sample).
6. Conclusion
In 1996, the Taiwanese government announced that the labor force participation rate was at its lowest point in the last 10 years. Experts and scholars pointed to a variety of potential factors, ranging from the economic recession to the uncertain economic environment. In this paper, we point to the implementation of National Health Insurance as another important factor causing the recent decline in labor force participation in Taiwan.
Overall, we find strong evidence that the availability of subsidized health insurance for non-working women in Taiwan has reduced labor force participation among married women by approximately 4 percentage points. The results based on the availability of National Health Insurance in 1995 reinforce the findings based on the expansion of government employee insurance to spouses in 1982. In both cases, making subsidized health insurance available to women if they chose not to work was associated with a significant decline in the fraction of women working. Moreover, this decline occurred primarily among wives of less educated men as predicted by a standard model of labor force participation.
Not surprisingly, our results suggest that insurance is a powerful work incentive. When social insurance programs offer subsidized health insurance to non-working adults, as was the case in Taiwan, this provides significant work disincentives for individuals who could not otherwise purchase health insurance. Recent health care reform proposals in the US and other countries have, to various degrees, proposed expanding subsidized health insurance coverage among non-working adults. The Taiwan experience suggests that these countries should anticipate a decline in labor force participation if such proposals are implemented. Conversely, our results imply that creation of government insurance programs to cover the working poor (such as the recent medicaid expansions) may have much larger impacts than equivalent financial incentives (such as the earned income tax credit) because of the value individuals place on insurance. For policy makers looking to increase work incentives, health insurance may provide a very cost-effective tool.
Acknowledgements
We thank William Hsiao, Brigitte Madrian, Joseph Newhouse, Chris Paxson, and seminar participants at Harvard, Princeton, Wisconsin, and the NBER for helpful comments.
References
Bureau of Labor Insurance, 1995. Statistical Data for Taiwan-Fukien Area Labor Insurance, 1994, Taipei, Taiwan. Bureau of National Health Insurance, 1997. National Health Insurance Profile, Taipei, Taiwan.
Card, D., Robins, P.K., 1996. Do financial incentives encourage welfare recipients to work? Evidence from a randomized evaluation of the self-sufficiency project NBER. Working Paper No. 5701.
Central Trust of China, 1998. Statistical Data for Government Employees Insurance, 1997, Taipei, Taiwan. Currie, J., Madrian, B.C., 1998. Health, Health Insurance and the Labor Market. Handbook of Labor Economics,
in press.
Deaton, A., Paxson, C., 1994. Intertemporal choice and inequality. Journal of Political Economy 102, 437–467. Eissa, N., Liebman, J.B., 1996. Labor supply response to the earned income tax credit. Quarterly Journal of
Economics 111, 605–637.
Engen, E., 1993. A stochastic life-cycle model with mortality risk: estimation with panel data. UCLA mimeo. Executive Yuan, 1997. Director-General of Budget, Accounting, and Statistics. Yearbook of Manpower Serving
Statistics, Taiwan Area, pp. 50–51.
Gruber, J., 1998. Health-Insurance and the Labor Market. Handbook of Health Economics, in press.
Manning, W.G., et al., 1987. Health insurance and the demand for medical care: evidence from a randomized experiment. Published No. R-3476-HHS, Santa Monica, Rand Corporation.
Peabody, J.W., Yu, J.C.-I., Wang, Y.-R., Bickel, S.R., 1995. Health system reform in the republic of China. Journal of American Medical Association 273, 777–781.
Pratt, J.W., 1964. Risk aversion in the small and in the large. Econometrica 32, 122–136.