J. Food Pharm. Sci. 2 (2014) 1-6
Avalaible online at www. jfoodpharmsci.com
Research Article
Differentiation of Bovine and Porcine Gelatins in Soft Candy Based on
Amino Acid Profiles and Chemometrics
Mita Amalia Raraswati
1,2, Kuwat Triyana
1, Triwahyudi
1, and Abdul Rohman
1,2*1Research center of Halal Products, Gadjah Mada University, Yogyakarta 55281 Indonesia
2Faculty of Pharmacy, Gadjah Mada University, Yogyakarta 55281 Indonesia
ARTICLE INFO ABSTRACT
Received 12 May 2012
Received in revised form 12 June 2012 Accepted 01 October 2012
Available online 15 January 2013
1. Introduction
Gelatin is an important hydrocolloid which has a large application in pharmaceutical and food product. Generally, mammalian gelatin has been utilized due to its high melting, gelling point and thermo-reversibility (Gudmundsson, 2002). Gelatin is widely used in confections because it foams, gels, or solidifies into a piece that dissolves slowly or melts in the mouth (GMIA, 2012). The amino acid composition and its sequences in gelatin are different from one source to another, but always consist of large amount of glycine, proline and hydroxyproline (Gilsenan and Ross-Murphy, 2000).
Commercial gelatin was obtained from bovine and porcine, in which an approximately of 90% of gelatin is coming from porcine (GMIA, 2012). Meanwhile, Al-Qur'an
surat Al-Maidah: 3, explained that Muslims are forbidden to consume any pig products and animals which were not slaughtered based on Islamic law. It is also evident that Muslims are forbidden to consume foods classified as dead animals or carrion (maytah), blood, pork and meat dedicated for other than Allah (Nurdeng, 2009). Hindus also prohibits the usage of cow. In the health aspects, the outbreak of bovine spongiform encephalopathy (BSE) or commonly known as mad cow disease in Europe has caused restriction on the usage of bovine gelatin in food products (Hidaka and Liu, 2002; Venien and Levieux, 2005a; Venien and Levieux, 2005b). The bovine and porcine gelatins also would give risks to gelatin-allergic patients (Doi et al., 2009). Therefore, it is necessary to differentiate porcine and bovine in food products, especially in soft candy which is preferred by children.
Gelatin is widely used in some food products, including soft candy (one of food products preferred by children). Most of the gelatin available in the market derived from pigs. Some religions like Islam and Jews prohibited their followers to consume any food products containing pig derivatives, including porcine gelatin. Therefore, it is necessary to develop some rapid and reliable methods for detection of porcine gelatin in soft candy. The purpose of this study was to differentiate and classification the gelatin sources (porcine or bovine) in soft candy based on amino acid profiles combined with chemometrics of principal component analysis (PCA). Separation and determination of amino acid was conducted by reversed-phase HPLC using a fluorescent detector, after being derivatized with ortho-phtalaldehyde in 2-mercaptoethanol (OPA/2-MCE). Parameters of peak height percentage of each amino acids from each sample were analyzed by PCA. Based on PC1 and PC2, porcine and bovine gelatins in soft candy could be apparently distinguished.
Keywords: bovine gelatin; porcine gelatin; amino acid profile; principal component analysis.
Several methods have been reported to differentiate gelatins mainly involving bovine and porcine gelatins. Hikada and Liu (2002) have differentiated between bovine and porcine gelatins based on chemical precipitation by calcium phosphate. Nemati et al. (2004) used reversed phase-high performance liquid chromatography in combination with fluorescence detection, while Zhang et al. (2008) have developed HPLC coupled with mass spectrometry to identify bovine and porcine gelatins. The same study by Zang et al. (2009) used HPLC coupled with tandem mass spectrometry; Venien and Levieux (2005b) used enzyme-linked immunosorbent assay. Demirhan et al. (2012) and Cai et al. (2012) have developed DNA-based technique using polymerase chain reaction. Based on literature review, there is no available report regarding the differentiation between porcine and bovine gelatins in food products (soft candy) using RP-HPLC with fluorescence detection in combination with chemometrics of principal component analysis.
In this study, RP-HPLC with fluorescence detection was used for profiling amino acid contents present in bovine and porcine gelatins. The amino acid profiles were subsequently processed using chemometrics of principal component analysis (PCA). PCA is an unsupervised data projection method used for classification and differentiation of objects (Miller and Miller, 2005). In practice, PCA has acted as a form of variable reduction which reduce large original dataset to a much smaller, more manageable dataset which can be interpreted more easily (Brereton, 2007).
2. Materials and methods
2.1. Materials
Standards of amino acids, ortho-phtalaldehyde (OPA), 2-mercaptoethanol (MCE) and gelatins from porcine and bovine were purchased from Sigma (St. Louis, USA). HPLC-grade methanol, tetrahydrofuran, sodium hydroxide, hydrochloric acid, Pb(II)acetate, oxalic acid were obtained from E. Merck (Darmstat Germany), bidistilled sterile water (Otsuka). The materials used for preparation of soft candy were obtained from Faculty of Pharmacy, Gadjah Mada University. The commercial food products were bought from local market in Yogyakarta, Indonesia.
2.2. Standard solutions and reagents
The stock solution of standard amino acids (19 amino acids) was prepared by dissolving 10 mg of each amino acids with bidistilled water until 10-mL in standard volumetric flask. The derivatizing reagent of OPA-MCE was prepared by dissolving 100 mg ortho-phtalaldehyde (OPA) and 100 µl 2-mercaptoethanol (MCE) in 50 ml volumetric flask, added with 10 ml methanol, and made with volume using borate buffer (pH 9.1 ± 0.05).
2.3. Preparation of soft candy
An approximately 20 g of bovine or porcine gelatins was weighed quantitatively and subsequently immersed with 100 ml of water for 15 minutes. Meanwhile, 150
grams of sugar and 3 ml of fruit flavor were dissolved in 100 ml of water. Gelatin that has been immersed was subsequently poured into a pan containing solution of sugar and fruit flavor. The solution was cooked and stirred constantly until all of the gelatins were soluble and thickened. The solution was subsequently removed from the heat, and poured into the prepared loaf pan. separated and determined using RP-HPLC with fluorescence detector. The analytical steps include hydrolysis of gelatin to release their amino acid residues and derivatization of amino acids with OPA-MCE. The detector was set at excitation and emission wavelengths at 340 and 450 nm, respectively.
2.5. Hydrolysis and derivatization
An approximately of 5 g samples (laboratory prepared soft candy and commercial products) were carefully weighed, placed in glass vials containing of 20 ml of 6 N HCl. The vials were subsequently sealed with their caps and placed in an autoclave, which was heated
to ˚C. After hour- hydrolysis period, the samples
were neutralized with addition of NaOH 1 M or HCl 6 N. The Samples were transferred into 100-ml volumetric flask, added with 5 ml Pb(II) acetate 40 % and 2 ml oxalic acid 15%. The samples were diluted until 100,0 mL with bidistilled sterile water and shaken smoothly. Furthermore, each sample was filtered using syringe-driven filter with pore size of 0.45 µm. A-50 µL of filtered solution was added with 950 µL of derivatisation reagent and 30 µL of solution was injected into HPLC system.
2.6. Statistical analysis
Principal Component Analysis (PCA) for classification and differentiation of samples was carried out using the Minitab software version 16 (Pennsylvania, USA). Parameters of peak height percentage of each amino acid from each sample were used as variables.
3. Results and discussion
medium (pH 9.1) to produce an intense blue colored fluorescent product called isoindole, having a maximum wavelength of excitation of 340 nm and emission at 450 nm (Figure 1).
Figure 1. The reaction takes place during the derivatization of amino acids with OPA-MCE (Snyder et al., 1997).
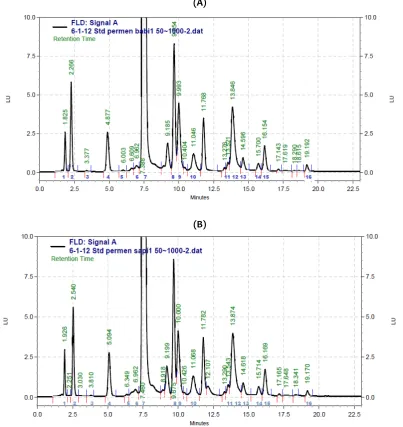
Figure 2 shows the chromatograms of amino acids in porcine and bovine gelatins from Sigma and laboratory prepared soft candy after hydrolysis and
pre-column derivatization. The level of amino acids in bovine and porcine gelatins were shown in Table 1. Certain amino acids like glutamic acid, glutamine, tyrosine, methionine, tryptophan, and phenylalanine in soft candy made from porcine gelatin were present in higher level than in soft candy made from bovine gelatin. While, the concentrations of aspartic acid, asparagine, histidine, alanine, arginine, isoleucine, leucine and lysine in soft candy made from bovine gelatin were higher than those in soft candy made from porcine gelatin. Meanwhile, the levels of valine, serine, and cysteine in soft candy made from porcine were present as high as in soft candy made from bovine gelatin. Table 2 shows the level of amino acids in commercial soft candy samples. Asparagine was not detected in all samples, while glutamine was detected only in sample 2 and 7. It also shows that sample 6 has the fewest of amino acid contents compared to other samples.
(A)
(B)
Table 1. Amino acid composition in porcine and bovine gelatins as well as laboratory prepared soft candy from bovine gelatin and porcine gelatin.
Amino Acid Bovine Gelatin (% b/b)
Bovine Gelatin (% b/b)
Soft Candy made
from bovine gelatin (% b/b)
Soft Candy made
from porcine gelatin (% b/b)
Aspartic acid 0.76 0.77 1.029 ± 0.05 0.873 ± 0.04
Glutamic acid 1.61 1.62 1.861 ± 0.09 1.918 ± 0.10
Asparagin 0.05 0.04 0.053 ± 0.00 0.043 ± 0.00
Serine and Cysteine 0.75 0.74 0.656 ± 0.03 0.655 ± 0.03
Glutamine 0.95 0.85 0.164 ± 0.01 0.188 ± 0.01
Histidin 0.43 0.40 0.349 ± 0.02 0.232 ± 0.01
Glycine & Threonine 4.01 3.99 4.238 ± 0.21 4.283 ± 0.21
Alanine 1.72 1.72 1.496 ± 0.08 1.373 ± 0.07
Arginine 1.71 1.87 1.673 ± 0.08 1.380 ± 0.07
Tyrosine 0.67 0.19 0.456 ± 0.02 0.959 ± 0.05
Methionine &
Thryptophan 0.92 1.00 0.143 ± 0.01 0.152 ± 0.01
Valine 0.33 0.34 0.773 ± 0.04 0.774 ± 0.04
Phenylalanine 0.06 0.52 0.388 ± 0.02 0.487 ± 0.02
Isoleucine 0.49 0.26 0.268 ± 0.01 0.214 ± 0.01
Leucine 0.03 0.85 0.740 ± 0.04 0.698 ± 0.04
Lycine 0.06 0.06 0.246 ± 0.01 0.221 ± 0.01
Table 2. Amino acid composition in commercial food product samples (nd = not detected).
It seems that the peak height of these amino acids can be used as simple discrimination between porcine and bovine gelatins. However, employing only these amino acid profiles for differentiation may not provide enough confidence. Therefore, the application of a
multivariate statistical method could be helpful to establish the difference between bovine and porcine gelatins in soft candy samples using amino acid profiles as variable.
3.1. Principal component analysis variables from parameters of peak height percentage for each amino acids. The result of PCA is the principal component (PC), which contains information to a certain amount of data variability. PC1 (first principal candy) were processed by PCA. The results of PCA were presented in a two dimensional graph. Figure 3 shows the PCA score plot of porcine and bovine gelatins coming from Sigma and laboratory prepared soft candy. The horizontal axis is the scores for the first PC, and the vertical axis for the second PC. Bovine and porcine gelatins, both in standard or in soft candy, were clearly separated. The original variables (15 amino acids) are reduced to a number of significant PCs, each of which is orthogonal to each other. PC1 described 37.9 % variation of data, while PC2, PC3, and PC4, explained 32.1 %; 15.9 %; and 11.0 % variations, respectively. Therefore, four PCs could extract 96.9 % of information from original data.
Figure 3. PCA score plot for classification of porcine and bovine gelatins and laboratory prepared soft candy from bovine and porcine gelatins. 1= porcine gelatin; 2 = bovine gelatin; 3= laboratory prepared soft candy from porcine gelatin; 4 and 5 = laboratory prepared soft candy from bovine gelatin; 6 and 7 = laboratory prepared soft candy from porcine and bovine gelatins.
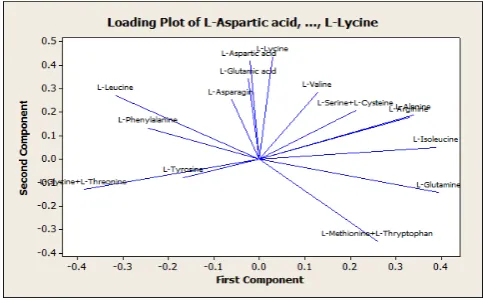
Figure 4 shows the loading plot for the determination of amino acid levels contributing to the differentiation and separation of the samples. It shows that lycine, aspartic acid, and glutamic acid seem closely clustered. This suggests that these three variables measure something very similar (Brereton, 2007). The further away an amino acid from the origin of variable point, the larger contribution of that variable (amino acid) to the PCA model (Marina et al., 2012; Rohman et
al., 2012). Lycine, as shown in Fig. 4, is variable having the most contribution toward PCA separation, since it has the furthest space from the origin point. In addition, variables in the centre of the loading plot like asparagin and tyrosine can be ignored (Brereton, 2007).
Figure 4. The loading plot of PCA model describing the contribution of amino acids for PC1 and PC2.
Some commercial soft candy products (7 samples) and laboratory prepared soft candy (3 samples) were also analyzed by determining the level of amino acid contents and subsequently processed using PCA. The result showed that PCA could not distinguish porcine or bovine gelatins in commercial food products. It could be explained that the commercial food products may be prepared from different organs or different cooking method from the laboratory prepared soft candy.
4. Conclusion
It can be concluded that amino acid profiles in combination with principal component analysis can classify and differentiate laboratory prepared-food products made from bovine and porcine gelatins. However, PCA was not successful for classification of commercial food products.
5. Acknowledgement
The authors thank to Directorate of higher education, Ministry of Education and Culture, Republic of Indonesia for financial support during this research via project grant of Riset Unggulan Strategis Nasional with contract number: LPPM-UGM/0004/2011.
References
Brereton, Richard G. Applied chemometrics for scientists. John Wiley & Sons Ltd, England. 2007.
Cai, H., Gu, X., Scanlan, M.S., Ramatlapeng, D.H. and Lively, C.R. Real-time PCR assays for detection and quantitation of porcine and bovine DNA in gelatin mixtures and gelatin capsules. Journal of Food
Composition and Analysis. 2012. 25: 83–87.
products – Halal / Kosher authentication. Meat Science.
2012. 90: 686–689.
Doi, H., Watanabe, E., Shibata, H., Tanabe, S. A reliable enzyme linked immunosorbent assay for the determination of bovine and porcine gelatin in processed foods. Journal of
Agricultural and Food Chemistry. 2009. 57: 1721-6.
Gudmundsson, M. Rheological properties of fish gelatin.
Journal of Food Science. 2002. 67 (6): 2172-2176.
Gelatin Manufacturer’s Institute of America, Inc (GMIA) revised 2012. Gelatin Handbook, available in http://www.gelatingmia.com/images/GMIA_Gelatin_Man ual_ 2012.pdf.
Gilsenan, P.M. and Ross-Murphy, S.B. Rheological characterization of gelatins from mammalian and marine sources. Food Hydrocolloids. 2000. 14: 191-195.
Hidaka, S., and S. Y. Liu. Effects of gelatins on calcium phosphate precipitation: A possible application for distinguishing bovine bone gelatin from porcine skin gelatin. Journal of Food Composition and Analysis. 2002.
16: 477–483.
Marina, A.M., Che Man, Y.B. and Ismail, A. Use of the SAW sensor electronic nose for detecting the adulteration of virgin coconut oil with RBD palm kernel olein. Journal of
the American Oil Chemists’ Society. 2010 87: 263–270.
Miller, J.N. and Miller, J.C. Statistic and Chemometrics for
Analytical Chemistry 5th Edition, Pearson Education
Limited, Harlow. 2005.
Nemati, M., Oveisi, M.R., Abdollahi, H., Sabzevari, O. Differentiation of bovine and porcine gelatins using principal component analysis. Journal of Pharmaceutical
and Biomedical Analysis. 2004. 34: 485–492.
Nurdeng, D. Lawful and unlawful foods in Islamic law focus on Islamic medical and ethical aspects. International Food
Research Journal. 2009. 16: 469-478.
Rohman, A., Triyana, K., Sismindari and Erwanto, Y. Differentiation of lard and other animal fats based on triacylglycerols composition and principal component analysis. International Food Research Journal. 2012. 19(2): 475-479.
Snyder, L.R., Kirkland, J.J. and Glajch, J.L. Practical HPLC Method
Development, 2nd edition, John Wiley & Sons Inc., New
York. 1997.
Venien, A. and Levieux, A. Differentation of Gelatins Using Polyclonal Antibodies Raised against Tyrosilated Bovine and Porcine Gelatin. Journal of Immunoassay and
Immunochemistry. 2005a. 26: 215-229.
Venien, A. and Levieux, A. Differentiation of bovine from porcine gelatins using polyclonal abti-peptide antibodies in indirect and competitive indirect ELISA. Journal of
Pharmaceutical and Biomedical Analysis. 2005b. 39: 418-24.
Zhang, G.F., Liu, T., Wang, Q., Lei, J.D., Ma, G.H. and Su, Z.G. Identification of marker peptides in digested gelatins by high performance liquid chromatography/mass spectrometry. Chinese Journal of Analytical Chemistry.
2008. 36: 1499–504.
Zhang, G.F., Liu, T., Wang, Q., Chen, L., Lei, J., Luo, J., Ma, G. and Su, Z. Mass spectrometric detection of marker peptides in tryptic digests of gelatin: a new method to differentiate between bovine and porcine gelatin. Food
Hydrocolloids. 2009. 23: 2001–2007.