with Breast Cancer
Sandra L. Decker
A B S T R A C T
This paper investigates the effect of health insurance on health and the use of health services by exploiting a change in insurance status that occurs for most Americans at age 65; that is, eligibility for the U.S. Medicare program. A regression discontinuity design is employed to identify discontinuities at age 65 in the relationship between age and access to care and health status, especially for groups more likely to be uninsured prior to age 65, such as those with less than a high school education or blacks and Hispanics. The paper focuses on the use of health services and health outcome related to breast cancer, a common cause of death among women, and one for which good access to early detection services is thought to significantly improve survival. Results show that the use of health services including mammogra-phy increases discontinuously at age 65, especially for women without a high school degree and for black and Hispanic women. A modest decrease in the probability of late-stage breast cancer diagnosis at age 65 is also found for white and Hispanic women.
I. Introduction
While Medicare provides nearly universal health insurance coverage to those at least 65 years old, a substantial fraction of the population younger than age 65 lacks insurance. This paper investigates the impact of the sudden increase in insurance coverage occurring for most uninsured American women when they turn 65. The focus is on the use of health services and health status related to breast cancer, the third most common cause of death, and the second leading cause of cancer death, among American women (DHHS 2002). The U.S. Preventive Services Task Force recommends mam-mography screening for women beginning at age 50 every 12–33 months in order to
Sandra L. Decker is a senior research analyst at the International Longevity Center-USA (ILC-USA) and a Research Economist at the National Bureau of Economic Research. She would like to thank Byung-Sun Lee for excellent research assistance, and the Commonwealth Fund for partial funding. The data used in this article can be obtained beginning May 2006 through April 2009 from Sandra Decker, ILC-USA, <sandrad@ilcusa.org>.
[Submitted August 2004; accepted February 2005]
ISSN 022-166X E-ISSN 1548-8004 © 2005 by the Board of Regents of the University of Wisconsin System
reduce the risk of death from breast cancer (2002). Using data from population-based health surveys, I first test whether the Medicare program helps improve access to this important early detection service. I then go on to test whether Medicare improves stage of diagnosis or survival of breast cancer, using data on a universe of women diagnosed with breast cancer within certain areas of the United States.1
Medicare eligibility at age 65 leads to a substantial increase in the probability of insurance coverage, particularly among women with less than a high school educa-tion, and among black and Hispanic women. I find that turning 65 leads to a discrete jump in the use of health services, including mammography, particularly among women least likely to be insured prior to age 65. For example, women without a high school education increase their likelihood of having had a recent mammogram by nearly five percentage points at age 65, compared to a one percentage point or smaller increase for college-educated women. The likelihood of late detection of breast can-cer also falls by about two percentage points at age 65.
II. Background and Empirical Approach
The goal is to compare the use of health services and health outcome among women before and after the age of Medicare eligibility. Previous work in this area has found that the use of health services increases discontinuously at age 65 for the population as a whole in the United States (Lichtenberg 2002). McWilliams et al. (2003) use panel data from the Health and Retirement Study (HRS), and find a stronger increase in the use of preventive health services at age 65 for those who have been uninsured before the age of 65 than for others. In a similar study, Decker, Dushi, and Deb (2004) find that the uninsured have lower overall total medical expenses than others before the age of 65 but higher expenses than others after age 65, when they also encounter a discontinuous increase in the probability of being diagnosed with certain medical conditions such as diabetes.
The closest study to this one is Card, Dobkin, and Maestas (2004), who use the same survey data on the use of health services and a similar study design, and find results quite similar to both Decker and Rapaport (2002) and to this paper. Card, Dobkin, and Maestas (2004), however, rely on self-reported health and aggregate mortality rates as measures of health status. They find no effect of Medicare on aggregate mortality rates. Of course, aggregate mortality rates may not be very sensitive to differences in access to healthcare, since some causes of death cannot be prevented or effectively treated. Using aggregate mortality rates also will fail to capture any improvement in quality as opposed to length of life. The authors find a small effect of Medicare on self-reported health, though such measures are subject to considerable measurement error. Baker, Stabile, and Deri (2004) find, for example, that the correlation between self-reported
Decker 949
prevalence of several health conditions and the presence of these conditions in medical records is not particularly high.
This paper tests Medicare’s effect on the use of healthcare services, and its effect on stage of diagnosis and survival of breast cancer. The objective of the work is to identify discontinuous changes in the use of health services (and in health) at age 65 corresponding to a decline in the probability of uninsurance at age 65. The study focuses on women aged 50 to 80 and estimates a model of the following form:
(1) _
_ _ * _ ,
H X Age MEDICARE ELIGIBLE
LOW SES MEDICARE ELIGIBLE LOW SES e
i i i i
where Hidenotes a measure of the use of health services or health outcome and Xiis a vector of covariates. MEDICARE_ELIGIBLEis a dichotomous variable indicating whether an individual is age 65 or older. β3is expected to be positive as Medicare low-ers the out-of-pocket price of medical care and increases its use. LOW_SESis a meas-ure of low socioeconomic status. Low socioeconomic status, associated with higher rates of uninsurance before the age of 65, is expected to be negatively associated with health and the use of health services (β4 < 0), though less after age 65 compared to before (that is, β5> 0). Education is chosen as the measure of socioeconomic status since most individuals near the age of Medicare eligibility have completed their for-mal education, thus making education, unlike income, exogenous to health.2 Differences in the use of health services and in health by race also are considered.
Equation 1 includes a control for age (in years) in order to distinguish the effect of turning 65 and gaining Medicare eligibility from other more continuous effects of age on the use of health services and on health. Identification of the discontinuous age 65 effect will also be tested using quadratic and cubic functions of age.3This analysis in effect follows a regression discontinuity design, an approach that is being increasingly used by empirical economists (for example, Lemieux and Milligan 2004; Card, Dobkin, and Maestas 2004; and Jacob and Legfren 2004).
Normally, identifying a causal effect of insurance status on health or the use of health services is difficult, since the insured may differ from the uninsured in ways that may be unobservable.4 Conditional upon living until then, however, gaining Medicare coverage at age 65 is exogenous to personal characteristics, allowing for unbiased estimates of the effect of insurance coverage on health and the use of health services. It should be noted, however, that personal characteristics that change right at age 65 could be erroneously captured in the Medicare Eligible variable. Although many retire earlier, age 65 is, for example, the normal age of retirement in the United
2. Low-income individuals are more likely to lack health insurance before the age of 65 and therefore may have poorer health, but poor health also may reduce the chance that a near-elderly individual is in the labor force and has health insurance.
3. The original version of this paper, Decker and Rapaport (2002), reported results using a linear function of age only.
States. Retirement might decrease the time cost of seeking healthcare, an effect that could be erroneously attributed to a Medicare price effect in the analysis above. Although employment status could itself be a function of health (for example, Dwyer and Mitchell 1999; Bound 1991), the sensitivity of the results in this paper to the inclusion of a dummy variable for paid employment has been tested. Although the employment variable is generally statistically significant (for example, working women are less likely to have had a recent mammogram, all else equal), neither the magnitude nor the significance level of coefficients associated with the Medicare Eligible variable is affected substantially. This is consistent with evidence that the peak in retirement rates in the United States had moved from age 65 to age 62 by the 1990s (Burtless 1999).
III. Data
The study pools 11 years of data on the use of health services from the Centers for Disease Control and Prevention’s Behavioral Risk Factor Surveillance System (BRFSS), starting in 1991, when questions regarding mammography use and physician breast exams were asked by phone in all participating states. The survey is designed to be representative by state and is stratified by age, sex, and race.5Data were missing for less than 5 percent of the sample, so these individuals were excluded from the analysis. The sample was limited to women in the 50 to 80 age range who were either (non-Hispanic) white, (non-Hispanic) black or Hispanic, producing a final sample size for the BRFSS of 252,605 women.
Data on breast cancer stage of diagnosis and survival among white, black, and Hispanic women diagnosed with breast cancer between the ages of 50 and 80 come from the National Cancer Institute’s 1973–2001 Surveillance, Epidemiology and End Results (SEER) program. The SEER program collects data on all cancer diagnoses within eleven population-based cancer registry areas throughout the United States.6 The study focuses on the time period beginning in 1980, as this is the period of sig-nificant improvement in stage of diagnosis and breast cancer survival. The analysis classifies breast cancer diagnoses into those diagnosed “early” (precancerous lesions and cancer that has not yet spread to the lymph nodes), and “late” (cancers that have spread to at least one lymph node and those which have metastasized to distant areas). Since SEER provides exact dates of diagnosis but only the month of death, the unit of analysis for survival is months. For this reason, 2,174 people in the sample who sur-vived less than one month after diagnosis were eliminated. The final sample consists of 234,410 women who were diagnosed with breast cancer between January 1, 1980 and December 31, 2001.
Because the SEER data contain limited demographic information, they were merged with data from the Area Resource File (ARF) on the percent of adults aged
Decker 951
5. More information about the BRFSS data can be found at http://www.cdc.dov/brfss/ (accessed February 20, 2005).
25 and older who were high school-educated by county, race, and year.7Using the sample data, women were then classified as living in the bottom, middle, and top thirds of the county education distribution by year.8 Other methods of classifying county education status were used with no substantive effect on the results.
IV. Results
A. The Use of Health Services
1. The Use of Health Services by Education
Table 1 reports sample statistics from the BRFSS on the receipt of mammography, physician breast exams, and two general measures of access to healthcare—whether a woman reported that she needed to see a doctor sometime in the past year and could not due to cost; and whether she has had a physician checkup in the past two years. These general measures of access to healthcare are analyzed since the probability of obtaining a mammogram is highly correlated with other measures of access to care. Although Medicare began covering the cost of screening mammography for Medicare beneficiaries every two years in 1991 and annually since 1998, the program would therefore have been likely to have had an impact on health related to breast cancer before the 1990s.9As be seen in Table 1, disparities in the use of health services among women aged 50 to 80 are striking. For example, women with less than a high school degree are much more likely to report that they did not seek care because of cost (15.2 percent) than women with college degrees (4.6 percent).
As expected, Medicare eligibility at age 65 leads to an abrupt decline in the prob-ability of uninsurance, particularly among women with less than a high school edu-cation. Nearly one-third of women without a high school degree are uninsured before the age of 65; this figure declines to less than 3 percent for women without a high school degree after age 65 (see Figure 1). Figures 2 to 4 graph means of the measures of the use of health services by age and education. These figures show that the use of health services increases discontinuously at age 65, and most for women without a high school education. Yet, the magnitude of the age 65 effect varies by the type of healthcare service. Figure 2, for example, shows a modest pre-65 disparity in the
7. ARF data by county and race (white versus non-white) on the percent of adults aged 25 and older who were high school-educated in 1980, 1990 and 2000 were used. Data for years between 1980 and 1990 and 1990 and 2000 were interpolated by county and race, and values for 2001 were assumed equal to those for 2000. Among women diagnosed with breast cancer between 1980 and 2001, on average white women lived in a county where about 84 percent of white adults were high school-educated, and black and Hispanic women lived in a county where about 65 percent of nonwhite adults were high school-educated.
8. Women in the bottom, middle, and top county-education thirds lived in counties with an average of 73, 84, and 89 percent of adults high school-educated.
Deck
er
953
Table 1
Sample Characteristics, BRFSS 1991–2001 (Women Aged 50 to 80)
Individual education
(Weighted percent) All Less than high school High school degree College degree
Mammogram in the past two years 74.1 62.6 75.3 83.6
Physician breast exam in the past two years 79.2 65.2 79.3 87.8
Needed to see a doctor in the past year but could 8.4 15.2 7.2 4.6
not due to cost
Checkup in the past two years 90.7 89.8 90.6 92.0
N 252,605 51,342 155,717 45,546
Race
White Black Hispanic
Mammogram in the past two years 74.1 74.3 74.1 71.5
Physician breast exam in the past two years 79.2 80.4 79.7 68.4
Needed to see a doctor in the past year but could
not due to cost 8.4 7.0 14.7 18.8
Checkup in the past two years 90.7 90.3 95.3 88.2
0
Fraction of Women Who are Uninsured (By Education) Source: BRFSS 1991–2001.
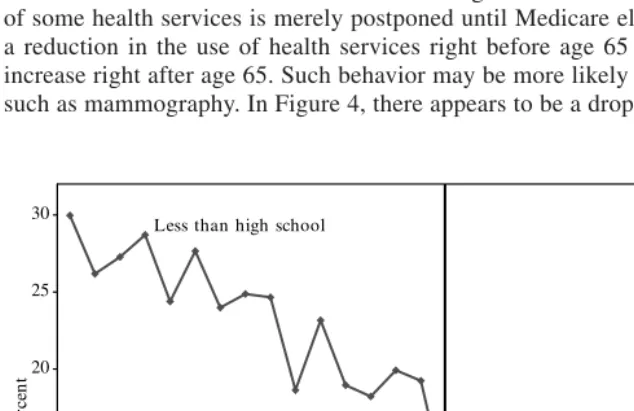
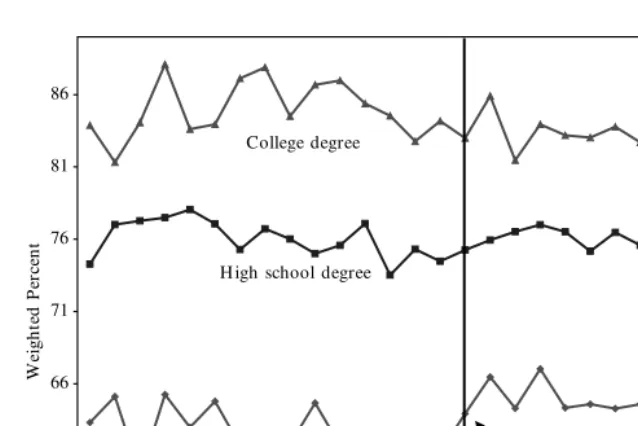
probability of having had a recent checkup by education status. The increase in the probability of having had a recent checkup at age 65 is strongest for women with lower education levels, resulting in an elimination of the gap in service use by educa-tion status after the age of 65. Figure 3 indicates that differences by educaeduca-tion in the probability that a woman could not see a doctor due to cost are substantial before 65 and are substantially reduced, although not eliminated, after age 65. Figure 4 indicates that although the probability of having had a recent mammogram increases at age 65 for women without a high school education, this does not nearly eliminate the gap in mammography receipt between these women and those with more education. This gap remains very substantial after age 65, a finding that merits future investigation. In fact, Skinner and Zhou (2004) find that although Medicare expenditures among indi-viduals of different income levels are more equally distributed than they have been in the past, socioeconomic differences in the use of several effective health services, including mammography, have not lessened in the past 15 years.
This paper hypothesizes that an increase in insurance coverage rates at age 65 results in a reduction in the out-of-pocket price of healthcare, producing a perma-nent increase in the use of health services at age 65. It is also possible that the use of some health services is merely postponed until Medicare eligibility, resulting in a reduction in the use of health services right before age 65 and a compensating increase right after age 65. Such behavior may be more likely for periodic services such as mammography. In Figure 4, there appears to be a drop in the probability of
Decker 955
Fraction of Women Who Needed to See a Doctor in the Past Year But Could Not Due to Cost
having had a recent mammogram between ages 62 and 64 for women with less than a high school education. However, the increase in the probability at age 65 is larger than the earlier decrease. For women with less than a high school education, the probability also appears to remain higher than it was until age 70, when the proba-bility of having had a recent mammogram declines for women of all education lev-els. Increases in the use of health services at age 65 may consist in part of both temporary and more permanent components. Although far from definitive, this analysis suggests that the majority of the increase in service use at age 65 is likely to be a permanent price effect.
Table 2 shows estimates of the effect of turning 65 on the use of health services using simple linear probability models controlling for education, race, region, and year effects.10Age is controlled for using linear, quadratic, and cubic specifications.
Models are first estimated without interacting the age 65 dichotomous variable with education or race, in order to estimate the overall effect of turning 65 on the use of health services.
“Turning 65” increases the chances of having had a recent mammogram. The lin-ear specification for age in Table 2 shows that turning 65 and becoming Medicare eligible increases the chance of having had a mammogram in the past two years by
10. Logit models produce results very similar to those presented here using a linear specification. The lin-ear model is used only to ease presentation.
56 61 66 71 76 81 86
50 51 52 53 54 55 56 57 58 59 60 61 62 63 64 65 66 67 68 69 70 71 72 73 74 75 76 77 78 79 80 Age
W
ei
gh
te
d
P
er
ce
n
t
Age 65 College degree
H igh school degree
Less than high school
Figure 4
Deck
er
957
Table 2
Education Differences in the Use of Health Services (Women Aged 50 to 80)
Linear in Age Quadratic in Age Cubic in Age
Mammogram in the past two years
Specifications 1–3: Medicare Eligible 2.87 2.81 2.21
(0.53) (0.53) (0.71)
Specifications 4–6: Medicare Eligible with Education Interactions
Less than high school 4.82 [0.00] 5.13 [0.00] 4.54 [0.00]
(0.82) (0.83) (0.94)
High school degree 2.56 [0.08] 2.44 [0.03] 1.84 [0.04]
(0.57) (0.57) (0.74)
College degree 1.36 [Reference 1.00 [Reference 0.42 [Reference
(0.75) category] (0.75) category] (0.88) category]
Physician breast exam in the past two years
Specifications 1–3: Medicare Eligible 1.84 1.80 1.07
(0.51) (0.51) (0.68)
Specifications 4–6: Medicare Eligible with Education Interactions
Less than high school 3.80 [0.00] 4.01 [0.00] 3.30 [0.00]
(0.80) (0.81) (0.92)
High school degree 1.44 [0.24] 1.36 [0.15] 0.63 [0.16]
(0.54) (0.54) (0.71)
College degree 0.68 [Reference 0.44 [Reference −0.27 [Reference
(0.72) category] (0.72) category] (0.85) category]
Needed to see a doctor in the past year but could not due to cost
Specifications 1–3: Medicare Eligible −3.28 −3.26 −2.71
(0.33) (0.33) (0.43)
The Journal of Human Resources Table 2 (continued)
Linear in Age Quadratic in Age Cubic in Age
Specifications 4–6: Medicare Eligible with Education Interactions
Less than high school −9.41 [0.00] −9.55 [0.00] −9.02 [0.00]
(0.61) (0.61) (0.66)
High school degree −2.16 [0.00] −2.11 [0.00] −1.57 [0.00]
(0.34) (0.34) (0.45)
College degree 0.85 [Reference 1.01 [Reference 1.53 [Reference
(0.42) category] (0.42) category] (0.50) category]
Checkup in the past two years
Specifications 1–3: Medicare Eligible 1.48 1.49 1.21
(0.37) (0.37) (0.49)
Specifications 4–6: Medicare Eligible with Education Interactions
Less than high school 3.35 [0.00] 3.31 [0.00] 3.04 [0.00]
(0.55) (0.55) (0.65)
High school degree 1.29 [0.00] 1.31 [0.00] 1.04 [0.00]
(0.40) (0.40) (0.51)
College degree −0.42 [Reference −0.37 [Reference −0.63 [Reference
(0.52) category] (0.52) category] (0.61) category]
Specifications 1–3report coefficients and standard errors (in parentheses) on a Medicare Eligible dummy from three weighted linear probability models (with linear, quad-ratic and cubic controls for age, respectively). These specifications also include controls for education, race, region, and year effects.
Specifications 4–6are the same as 1–3, but include interactions between the Medicare Eligible dummy and education categories. “College degree” is the omitted education category; therefore, rows labeled “College degree” simply report the coefficient on the Medicare Eligible dummy. Rows labeled “Less than high school” and “High school degree” report the sum of the coefficients on the Medicare Eligible dummy and the Medicare Eligible dummy interacted with that education category. P values reporting the significance level of the interactions are reported in square brackets.
nearly 2.9 percentage points for women aged 50 to 80.11This is a modest, statistically significant increase of approximately 3.9 percent, relative to the average chance that a woman has had a recent mammogram of about 74 percent. The chance of having had a recent physician breast exam also increases discontinuously at age 65.
Models are then estimated interacting the dichotomous age 65 and over variable with education dummies. Results for the sum of these interactions and the age 65 dummy, reported in Table 2, show that the increase in the probability that a woman has had a recent mammogram or physician breast exam at age 65 varies strongly by education. There is no statistically significant increase in the chance that a college-educated woman has a mammogram at age 65, which seems consistent with the fact that insurance status for these women changes little at that age. There is, however, a 4.8 percentage point increase in the chance that a woman with less than a high school education has had a mammogram in the past two years, a nearly 8 percent increase relative to the average chance that a woman with less than a high school degree has had a mammogram of less than 63 percent. Similarly, there is no statis-tically significant increase in the probability that a college-educated woman has had a recent physician breast exam at age 65, but an approximate 3.8 percentage point increase in the chance that a woman with less than a high school education has had a recent exam.
There is also a statistically significant improvement at age 65 in the other measures of access to care. For women aged 50 to 80, for example, turning 65 reduces the chance that a woman reported having needed to see a doctor in the past year but could not due to cost by almost 3.3 percentage point. This is a very large, approximately 39 percent decrease, relative to the average chance that a women reports having needed to see a doctor but could not due to cost of 8.4 percent. This result again varies strongly by education. There is no statistically significant change at age 65 in the probability that a college-educated woman reports having needed to see a doctor but could not due to cost, but a very large change for women with less than a high school education.
All three columns of results in Table 2 show that estimated effects of turning 65 and becoming Medicare eligible using quadratic and cubic specifications for age are very similar to those using a linear specification, though estimated effects are somewhat smaller. The stability of the results to the addition of a higher order polynomial in age is not surprising, since Figures 3-5 do not seem to suggest a quadratic or cubic pat-tern in the use of health services by age.12
Decker 959
11. Card, Dobkin, and Maestas (2004) use a smaller sample of data from the BRFSS and do not find a sta-tistically significant effect of turning 65 on the probability of having had a recent mammogram. The results in this paper using a larger sample of available data from the BRFSS and reporting a modest statistically sig-nificant effect of turning 65 on the probability of having had a recent mammogram are more consistent with other results, for example by McWilliams et al. (2003) and Decker, Dushi, and Deb (2004) using the Health and Retirement Survey.
2. The Use of Health Services by Race
Medicare eligibility at age 65 also leads to a particular decline in the probability that black and Hispanic women lack health insurance. About 20 percent of black women and a quarter of Hispanic women lack insurance before age 65; this is true of only about 5 percent of these women after age 65 (see Figure 5).
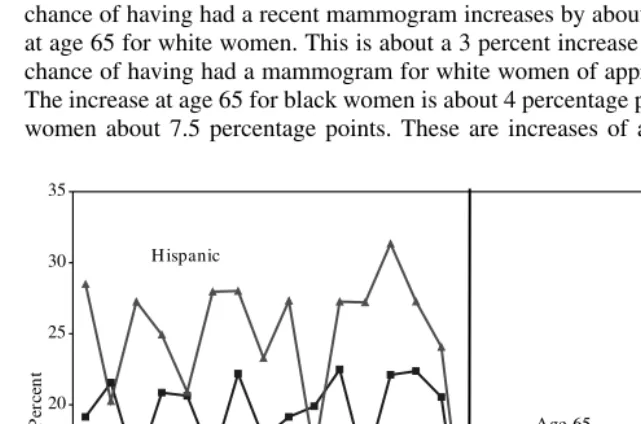
Table 1 clearly shows that Hispanic women use fewer health services than do white women. For example, nearly 19 percent of Hispanic women have needed to see a doc-tor in the past year but could not due to cost, compared to only about 7 percent of white women. Less than 72 percent of Hispanic women have had a mammogram, compared to a little more than 74 percent of white women. Differences in the use of health services between black and white women are less clear. Black and white women appear about equally likely to have had a mammogram and physician breast exam in the past two years (about 74 and 80 percent). Black women are more likely than white women to have had a checkup in the past two years, possibly due to black women’s poorer overall health status. Since aggregate race differences in the use of health services are less clear than education differences, these differences are not graphed, though analyzed in Table 3. The linear specification for age shows that the chance of having had a recent mammogram increases by about 2.4 percentage points at age 65 for white women. This is about a 3 percent increase relative to the average chance of having had a mammogram for white women of approximately 74 percent. The increase at age 65 for black women is about 4 percentage points and for Hispanic women about 7.5 percentage points. These are increases of approximately 5.9 and
0
Deck
er
961
Table 3
Race Differences in the Use of Health Services (Women Aged 50 to 80)
Linear in Age Quadratic in Age Cubic in Age
Mammogram in the past two years
Specifications 1–3: Medicare Eligible 2.87 2.81 2.21
(0.53) (0.53) (0.71)
Specifications 4–6: Medicare Eligible with Education Interactions
White 2.39 [Reference 2.39 [Reference 1.77 [Reference
(0.54) category] (0.54) category] (0.71) category]
Black 4.35 [0.04] 4.11 [0.08] 3.50 [0.08]
(1.03) (1.03) (1.13)
Hispanic 7.48 [0.00] 7.03 [0.00] 6.42 [0.00]
(1.60) (1.61 (1.68)
Physician breast exam in the past two years
Specifications 1–3: Medicare Eligible 1.84 1.80 1.07
(0.51) (0.51) (0.68)
Specifications 4–6: Medicare Eligible with Education Interactions
White 1.40 [Reference 1.39 [Reference 0.65 [Reference
(0.51) category] (0.52) category] (0.68) category]
Black 4.29 [0.00] 4.13 [0.00] 3.40 [0.00]
(1.00) (1.00) (1.10)
Hispanic 4.36 [0.07] 4.06 [0.10] 3.33 [0.10]
(1.66) (1.66) (1.72)
The Journal of Human Resources
Linear in Age Quadratic in Age Cubic in Age
Needed to see a doctor in the past year but could not due to cost
Specifications 1–3: Medicare Eligible −3.28 −3.26 −2.71
(0.33) (0.33) (0.43)
Specifications 4–6: Medicare Eligible with Education Interactions
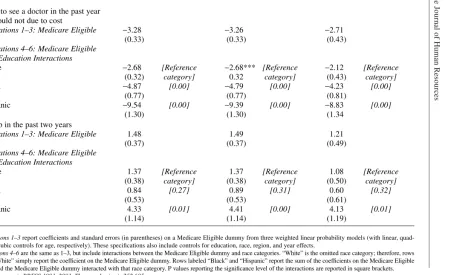
White −2.68 [Reference −2.68*** [Reference −2.12 [Reference
(0.32) category] 0.32 category] (0.43) category]
Black −4.87 [0.00] −4.79 [0.00] −4.23 [0.00]
(0.77) (0.77) (0.81)
Hispanic −9.54 [0.00] −9.39 [0.00] −8.83 [0.00]
(1.30) (1.30) (1.34
Checkup in the past two years
Specifications 1–3: Medicare Eligible 1.48 1.49 1.21
(0.37) (0.37) (0.49)
Specifications 4–6: Medicare Eligible with Education Interactions
White 1.37 [Reference 1.37 [Reference 1.08 [Reference
(0.38) category] (0.38) category] (0.50) category]
Black 0.84 [0.27] 0.89 [0.31] 0.60 [0.32]
(0.53) (0.53) (0.61)
Hispanic 4.33 [0.01] 4.41 [0.00] 4.13 [0.01]
(1.14) (1.14) (1.19)
Specifications 1–3report coefficients and standard errors (in parentheses) on a Medicare Eligible dummy from three weighted linear probability models (with linear, quad-ratic and cubic controls for age, respectively). These specifications also include controls for education, race, region, and year effects.
10.5 percent respectively. Again, estimates of the increase in the chance of having had a recent mammogram are similar for quadratic and cubic specifications for age com-pared to the linear specification. The cubic specifications are, however, particularly weak for blacks and Hispanics, which is undoubtedly a result of the relatively small sample size available to estimate four age parameters for these women.
B. Breast Cancer Stage of Diagnosis and Survival
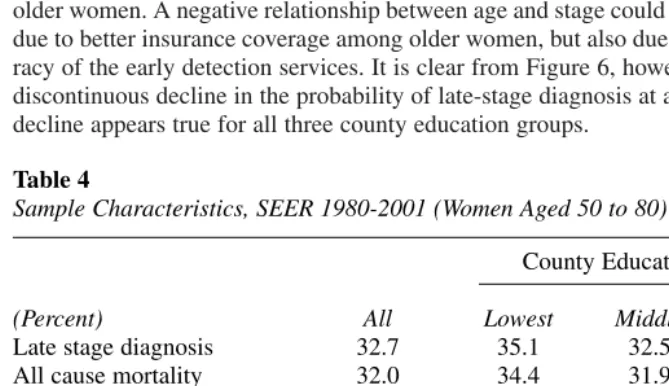
Table 4 contains descriptive statistics for women aged 50 to 80 diagnosed with breast cancer between 1980 and 2001 from the SEER data. Although the county-based measure of socioeconomic status is not precise, women living in counties with fewer adults high school-educated are more likely to have their breast cancer diagnosed late. About 35 percent of women living in the lowest county education third are diagnosed late, compared to about 30 percent of women living in the top county education cat-egory. Although information on survival is right-censored, the simple means also sug-gest that women in counties with a higher fraction of adults high school-educated are more likely to survive and survive longer after a diagnosis of breast cancer. Figure 6 graphs the fraction of women diagnosed late with breast cancer by age and county education status. Age in general is negatively correlated with the probability of late-stage diagnosis, possibly because of mammography’s increased chance of correctly detecting early cancers in less dense breasts of older women. For this reason, Kerlikowske at al. (1996) report that mammography screening is more accurate for older women. A negative relationship between age and stage could therefore be partly due to better insurance coverage among older women, but also due to increased accu-racy of the early detection services. It is clear from Figure 6, however, that there is a discontinuous decline in the probability of late-stage diagnosis at age 65, though this decline appears true for all three county education groups.
Decker 963
Table 4
Sample Characteristics, SEER 1980-2001 (Women Aged 50 to 80)
County Education Thirds
(Percent) All Lowest Middle Highest
Late stage diagnosis 32.7 35.1 32.5 30.3
All cause mortality 32.0 34.4 31.9 29.5
Mean survival time for death
among all causes (months) 68.7 63.2 71.7 72.8
N 234,410 84,642 73,673 76,095
Race
White Black Hispanic
Late stage diagnosis 32.7 32.0 39.6 34.8
All cause mortality 32.0 31.9 39.0 23.5
Mean survival time for death
among all causes (months) 68.7 71.0 53.6 54.6
Table 5 estimates the probability that a woman is diagnosed late rather than early with breast cancer, again using a simple linear probability model. For women age 50 to 80, turning 65 decreases the chance of late-stage diagnosis by about 1.88 percent-age points. This is an approximately 5.7 percent decrease relative to the averpercent-age frac-tion of women diagnosed late of about 32.7 percent. The size of the improvement in stage of diagnosis at age 65, however, does not differ significantly by county educa-tion status. In the future, better socioeconomic identifiers would be helpful in esti-mating the decrease in stage in poorer communities (with higher rates of uninsurance before age 65) compared to wealthier ones.
The bottom panel of Table 4 indicates that race differences in the health of women with breast cancer are also pronounced. On average, about 32 percent of white women are diagnosed late with breast cancer, compared to nearly 35 percent of Hispanic women and nearly 40 percent of black women. The bottom panel of Table 5 indicates that turning 65 significantly decreases the chance of late-stage diagnosis of breast cancer, particularly for Hispanic women. For white women, the chance of being diag-nosed late rather than early with breast cancer decreases by about 1.8 percentage points at age 65. This is an approximately 5.8 percentage point decline relative to the average fraction of white women diagnosed late of about 32 percent. Turning 65 decreases the chance that a Hispanic woman is diagnosed late with breast cancer by nearly 3.4 percentage points. This is an approximately 10 percent decline, relative to the average fraction of Hispanic women diagnosed late of about 35 percent. Again,
25 27 29 31 33 35 37 39 41
50 51 52 53 54 55 56 57 58 59 60 61 62 63 64 65 66 67 68 69 70 71 72 73 74 75 76 77 78 79 80 Age
P
er
ce
n
t
Age 65 Lowest
M iddle
H ighest
Figure 6
Fraction of Women Whose Breast Cancer is Diagnosed Late By County Education Thirds
Deck
er
965
Table 5
Late Stage Breast Cancer Diagnosis (Women Aged 50 to 80)
Linear in Age Quadratic in Age Cubic in Age N
Specifications 1–3: Medicare Eligible −1.88 −1.84 −0.86
(0.37) (0.37) (0.50) 234,410
Specifications 4–6: Medicare Eligible with County-Education Interactions
Lowest County-Education Third −2.01 [0.86] −2.00 [0.86] −0.99 [0.85] 84,642
(0.45) (0.45) (0.56)
Middle County-Education Third −1.66 [0.58] (0.47) [0.61] −0.66 [0.61] 73,673
(0.47) −1.64 (0.57)
Highest County-Education Third −1.93 [Reference −1.88 [Reference −0.91 [Reference 76,095
(0.47) category] (0.47) category] (0.57) category] Specifications 7–9: Medicare Eligible with
Race Interactions
White −1.84 [Reference −1.80 [Reference −0.83 [Reference 204,008
(0.38) category] (0.38) category] (0.50) category]
Black −1.29 [0.45] −1.22 [0.41] −0.23 [0.41] 18,202
(0.76) (0.76) (0.83)
Hispanic −3.38 [0.08] −3.28 [0.09] −2.31 [0.09] 12,200
(0.91) (0.91) (0.96)
Specifications 1–3report coefficients and standard errors (in parentheses) on a Medicare Eligible dummy from linear probability models (with linear, quadratic and cubic controls for age, respectively). These specifications also include controls for county-education third, race, region and year effects.
Specifications 4–6are the same as 1–3, but include interactions between the Medicare Eligible dummy and county-education categories. “Highest County-Education Third”
is the omitted education category; therefore, rows labeled “Highest County-Education Third” simply report the coefficient on the Medicare Eligible dummy. Rows labeled “Lowest County-Education Third” and “Middle County-Education Third” report the sum of the coefficients on the Medicare Eligible dummy and the Medicare Eligible dummy interacted with that education category. P values reporting the significance level of the interactions are reported in square brackets.
most estimates in Table 5 that use a quadratic or cubic specification for age produce similar results compared to those using a linear specification, except the cubic speci-fication for Hispanic women.
The ultimate health-outcome measure is, of course, survival. Table 6 uses a simple Cox proportional hazard model to analyze survival time using linear, quadratic and cubic formulations for age. When linear specification is used, turning 65 decreases the chance of death among women diagnosed with breast cancer by about 11 percent. This improvement in survival comes about either as a result of either earlier stage diagnosis at age 65 (shown in Table 5) or more effective treatment following diagnosis. Table 6 presents mortality models without controlling for stage of diagnosis. Although not reported, models controlling for late-stage diagnosis—and therefore focusing more on the possible effect of better treatment conditional on stage—have also been estimated. These models show similar patterns compared to those in Table 6, though the magni-tude of the age 65 effect is, of course, somewhat smaller. For women aged 50 to 80 overall, for example, turning 65 decreases the chance of death by about 9 percent (compared to the 11 percent reported in Table 6). This finding suggests the importance of future work investigating differences in types and timeliness of treatment of women with different insurance status following a diagnosis of breast cancer.
Although the effect of turning 65 does appear largest among women in the lowest county education third, differences in the pattern of the decrease in mortality at age 65 by county education status are not significant.13The effect of turning 65 on mor-tality among Hispanic women is weakly estimated, although the linear and quadratic estimations imply a reduction in mortality for white and black women of about 10 percent.
V. Discussion
This paper finds that the use of health services including mammogra-phy increases discontinuously at age 65, especially for women without a high school degree and for black and Hispanic women. A modest decrease in the probability of late-stage breast cancer diagnosis at age 65 is also found for white and Hispanic women. Future work investigating the effect of turning 65 on meaningful measures of health outcome in addition to breast cancer would be helpful in identifying the suc-cesses and areas of possible improvement for the Medicare program. Further investi-gation of the reasons for continuing disparities after the age of 65 in the use of certain health services such as mammography is also important. These reasons might include differences in receipt of supplementary health insurance, differences in practice pat-terns of physicians used by Medicare recipients of different income levels, and cul-tural differences in knowledge about and attitudes toward the use of different kinds of health services.
Deck
er
967
Table 6
All Cause Mortality (Women Aged 50 to 80)
Linear in Age Quadratic in Age Cubic in Age N
Coefficient Hazard Coefficient Hazard Coefficient Hazard (Std. Error) Ratio (Std. Error) Ratio (Std. Error) Ratio Specifications 1–3: Medicare Eligible −0.12 0.89 −0.06 −0.02
(0.01) (0.01) 0.94 (0.02) 0.98 234,410
Specifications 4–12: Medicare Eligible by County-Education Third
Lowest County-Education Third −0.13 0.88 −0.09 0.92 −0.04 0.97 84,642
(0.02) (0.02) (0.03)
Middle County-Education Third −0.10 0.91 −0.04 0.96 0.01 1.01 73,673
(0.03) (0.03) (0.03)
Highest County-Education Third −0.11 0.89 −0.05 0.95 −0.01 0.99 76,095
(0.03) (0.03) (0.03)
Specifications 13–21: Medicare Eligible by Race
White −0.12 0.89 −0.06 0.94 −0.02
(0.02) (0.02) (0.02) 0.98 204,008
Black −0.11 0.90 −0.10 0.91 0.07
(0.05) (0.05) (0.06) 1.07 18,202
Hispanic −0.08 0.93 −0.05 0.95 −0.02 0.98 12,200
(0.07) (0.07) (0.10)
Specifications 1–3report coefficients, standard errors (in parentheses), and hazard ratios from three Cox proportional hazard models (with linear, quadratic and cubic con-trols for age, respectively). These specifications also include concon-trols for county-education third, race, region and year effects.
Specifications 4–12are the same as 1–3 but are performed separately by county-education third. Specifications 13–21are the same as 1–3 but are performed separately by race.
References
Baker, M., Mark Stabile, and C. Deri. 2004. “What Do Self-Reported, Objective, Measures of Health Measure?” Journal of Human Resources39(4):1067–93:
Bound, John. 1991. “Self-reported Versus Objective Measures of Health in Retirement Models.” Journal of Human Resources26(1):106–38.
Burtless, Gary. 1999. “An Economic View of Retirement.” In Behavioral Dimensions of Retirement Economics, ed. Henry J. Aaron, 7–42. Washington, D.C.: Brookings Institution Press.
Card, David, Carlos Dobkin, and Nicole Maestas. 2004. “The Impact of Nearly Universal Insurance Coverage on Healthcare Utilization and Health: Evidence from Medicare.” Cambridge, MA: National Bureau of Economic Research Working Paper #10365. Decker, Sandra L., and Carol Rapaport. 2002. “Medicare and Disparities in Women’s Health.”
National Bureau of Economic Research Working Paper #8761, Cambridge, Mass. Decker, Sandra L., Irena Dushi, and Partha Deb. 2004. “Medicare at Age 65: Does It Level
the Playing Field?” New York: ILC Working Paper.
Dwyer, D. S., and O. S. Mitchell. 1999. “Health Problems as Determinants of Retirement: Are Self-rated Measures Endogenous?” Journal of Health Economics18(2):173–93.
Jacob, B.A., and L. Legfren. 2004. “Remedial Education and Student Achievement: A Regression-Discontinuity Analysis.” Review of Economics and Statistics86(1):226–44. Kerlikowske, Karla, Deborah Grady, John Barclay, Edward Sickles, and Virginia Ernster.
1996. “Likelihood Ratios for Modern Screening Mammography: Risk of Breast Cancer Based on Age and Mammographic Interpretation. Journal of the American Medical Association276(1):49–43.
Lemieux, T., and K. Milligan. 2004. “Incentive Effects of Social Assistance: A Regression Discontinuity Approach.” Cambridge, Mass.: National Bureau of Economic Research Working Paper #10541.
Lichtenberg, Frank. 2002. “The Effects of Medicare on Healthcare Utilization and Outcomes.” in Frontiers in Health Policy Research, ed. Alan Garber, 27–52. Cambridge, Mass.: MIT Press.
McWilliams, J. M,. A. M. Zaslavsky A. M., E. Meara, and J. Z. Ayanian. 2003. “Impact of Medicare Coverage on Basic Clinical Services for Previously Uninsured Adults.” New England Journal of Medicine290(6):757–64.
National Cancer Institute (NCI), About SEER,htttp://seer.cancer.gov/about/. Website accessed March 1, 2004.
Skinner, Jonathan, and Weiping Zhou. 2004. “The Measurement and Evolution of Healthy Inequality: Evidence from the U.S. Medicare Population.” National Bureau of Economic Research. Cambridge, Mass.: National Bureau of Economic Research Working Paper #10842.
U. S. Department of Health and Human Services (DHHS), Centers for Disease Control and Prevention, National Center for Health Statistics. 2002. Deaths: Final Data for 2000. Hyattsville, Md.: National Vital Statistics Reports 50, 1–120.